Heavy Early Warning System in Merapi Mount based on
Android
Badie Uddin
Departartmen Of Computer
Engineering
Cimahi TEDC Polytechnic
Pesantren KM 2 Cibabat
Rachmat Iskandar
Departartmen Of Computer
Engineering
Cimahi TEDC Polytechnic
Pesantren KM 2 Cibabat
Ida Bagus Budiyanto
Departartmen Of Computer
Engineering
Cimahi TEDC Polytechnic
Pesantren KM 2 Cibabat
ABSTRACT
Early Warning System (Early Warning System) is a series of systems to inform the occurrence of natural events, can be disaster or other natural signs. The community's early warning of disaster is an act of providing information in a language easily digested by the community. This application development research aims to assist the public in estimating the early warning of hot clouds so as to avoid the possibility of hot clouds known. This android-based GIS application is a GIS framework for natural disasters as it is designed to grow as a mapping application of other natural disasters such as erupting volcanoes, floods etc. One of the primary dangers posed by the volcanic activity of Mount Merapi is the rapidly moving pyroclastic flow and consists of hot gas, volcanic ash and rocks. This flow can move quickly down the slopes with very high temperatures. Mount Merapi's natural conditions cause difficulties in visually monitoring of hot clouds, while the use of seismic equipment requires experts to analyze data. This makes it difficult for officers to provide early warning to the community quickly and accurately. The results obtained from this research is an early warning system of geothermal cloud based geo-based geographic information system by utilizing the temperature sensor as a tool of hot cloud detection. The temperature sensor used in system testing is the infrared temperature sensor by using a microcontroller as an analog to digital signal converter. This system has the facility to set the laying of the sensor, read the temperature on each sensor, and provide a warning of danger in accordance with the limitations that have been determined.
Keywords
Early warning systems,geographic information systems, hot clouds, android
1.
INTRODUCTION
Indonesia's geographic location is stretched from 94o-141o east longitude and 6o LU-11o LS is an archipelagic country with an active volcano level. Indonesian geography is dominated by volcanoes formed by a subduction zone between the Eurasian plate and the Indo-Australian plate. Volcanoes in Indonesia are part of the Pacific Ring of Fire. The most active volcano of Merapi on the island of Java, which is responsible for thousands of deaths from its eruption in the region. Mount Merapi has erupted more than 80 times .. During the previous eruption of Merapi in 2006, the PDC domes were originally placed in the southwest with a runout spacing of less than 4 km until the topographical topographic limit collapsed in early June of that year. Further, the valleys-limited, concentrated, southward-directed PDC extending from 7-7.8 km in the Gendol River (Thouret et al., 2010; Charbonnier and Gertisser, 2011) are repeated excessively to
influence villages from Kaliadem (Charbonnier and Gertisser, 2008, 2011; Thouret et al., 2010; Lube et al., 2011; Gertisser et al., 2012a). The 2006 eruption is typical of the 20th-century Merapi eruption in terms of PDC's runout, which involves extrusion of a non-explosive dome. The 2006 eruption experienced an extremely high magma flux (mean 2.4 m3s-1, peak ~ 4m3s-1 (Ratdomopurbo et al., 2013)), much higher than the typical tariff of 0.05 to 1 m3s- 1 (Hammer et al., 2000; Newhall et al., 2000; Voight et al., 2000; Charbonnier and Gertisser, 2008; Gertisser et al., 2012b), but the degree of order is lower than the rate of lava effusion during the 2010 eruption ( Pallister et al., 2013). However, the eruption of 2006, such as the more typical Merapi eruption and lower-extrusion The collapsed, concentrated dome, mostly valleys-is limited with b10 km runouts. By contrast, since about 1800 AD, the larger VEI 4 Explosive eruption has resulted in the collapse of existing PDC fountains in some instances of> 12 km (Voight et al., 2000). During the Holocene, larger subplinant explosive eruptions, partially collapsed partial buildings with emplacement of debris and the possibility of laterally directed explosions have been documented (Newhall et al., 2000; Thouret et al., 2000; Gertisser et al. 2012b). Despite some debates, Grandjean (1931, in Voight et al., 2000) suggests that the third type of PDC, "Pélean-type nuées ardentes" also occurs in Merapi (eg eruption 1930) as a result of a directional explosion of a dome similar to that described by Lacroix in Mount Pelée in 1902 (Lacroix, 1904). The International Association of Volcanology and Earth Interior Chemistry has named Merapi as the Volcano of the Decade since 1995 because of its very high volcanic activity. Until 2012, Indonesia has 127 active volcanoes with approximately 5 million inhabitants dwelling around it. Since 26 December 2004, after large earthquakes and tsunamis have occurred, all volcanic eruptions have changed, such as Mount Sinabung, which last erupted in the 1600s, but suddenly re-activated in 2010 and erupted in 2013 Seeing so many volcanoes in Indonesia are still active then considered necessary to make an early warning system based on android. In this study, built a system of heat detection and monitoring of Merapi volcano-based geographic information system by utilizing the temperature sensor as an android-based hot cloud detection tool.
2.
LITERATURE REVIEW
Mount Merapi brings out a very hot hot cloud on the border of Central Java-Yogyakarta. hot clouds spewed Mount Merapi is often called the Wedhus Gembel with temperatures that can reach 1,000-1,100 ° C at the exit of the crater, and when crashing the settlement temperature to around 500-600 ° C. speed Wedhus Gembel can reach 200 km per hour.
Figure 1. Review of Mount Merapi Eruption (source BMKG Yogyakarta)
The term hot clouds is used to refer to the flow of suspension from rocks, gravel, ash, sand in a period of hot volcanic gas coming out of the volcano and flowing down its slope at speeds of over 100 km per hour as far as tens of km. The turbulent flow from afar looks like a cloud rolling down the slopes of the volcano and when it happens at night it looks smoldering.
Hot clouds are usually not all the usual avalanches because of the high pressure of the gas on the material causing collisions between the rocks or the material inside the hot cloud does not occur in other words the impact is damped by the gas. Residents around Merapi call hot clouds as wedhus gembel in Javanese means sheep because visually it looks like hot clouds like sheep down the slope. This term is thought to have been used for centuries by the locals (older than the term nuee-ardente).
Figure 2. Pyroclastic flow from Merapi in 1901-2000 (source BMKG Yogyakarta)
2.1.
Early Warning System In General
[image:2.595.54.278.140.303.2]Early Warning System (Early Warning System) is a series of systems to inform the occurrence of natural events, can be disaster or other natural signs. The community's early warning of disaster is an act of providing information in a language easily digested by the community. In critical condition, in general, early warning which is the delivery of information is manifested in the form of siren, kentongan and so forth.
Figure 3. Operational aspects of Early Warning System (source BMKG Yogyakarta)
However, hiding the siren is only part of the form of information delivery that needs to be done because there is no other faster way to deliver information to the public. The hope is that people can respond quickly and accurately. The alertness and speed of the community's reaction is necessary because of the narrow time from the time when information is released with the (disastrous) arrival of the disaster. Critical conditions, narrow time, major disasters and rescue of the population are factors that require early warning. The earlier the information is conveyed, the less time for the population to respond.
3.
METHODOLOGY
3.1
Method of Planning
Planning / planning, careful planning is necessary for the creation of this application, planning in this case includes the design and techniques to be used as well as the adjustment of the content. Feasibility studies on the methods used in the data collection process are also conducted, which include data collection methods, data sources, data collection techniques, and data analysis techniques.
Figure 4. Flow Research
[image:2.595.54.276.499.659.2] [image:2.595.334.521.510.680.2]▪
The measured object has a very high temperature and glide speed characteristics.▪
Objects are dangerous and difficult to reach, so it is impossible to use direct contact sensors• Infrared sensors are able to measure temperature from a distance
3.2
System Design Method
System design is part of a software development methodology that is done after through the stages of analysis, design aims to provide a detailed description. The design of this application using the flow map, Design Use case, menu structure, interface design, network architecture
3.3
System Analysis
System analysis is performed to identify and evaluate a problem and constraints that occur in a system so that it can be proposed an improvement. At this time in the system of early warning hot clouds still manually conducted by BMKG in providing warning to the community around Mount Merapi.
3.4
Test Method
Testing is a way or technique to test the software that has been made, has a mechanism to determine the test data that can test the software completely and have a high ability to find errors in this test against software pernagkat done by the author is testing black box.
Black box testing or behavioral testing more focused on the functional requirements of the software, it can be concluded that black box testing is a test performed for the software interface. This test is performed to show the demo that software functions work well in the sense that all entries are received correctly and the resulting output is really precise and the integeration of external data goes well (file)
3.5
Data Methode Selection
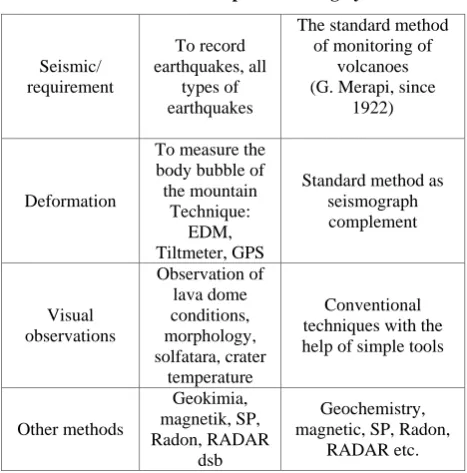
[image:3.595.316.542.216.381.2]Hazard threat Mount Merapi is divided into 3 parts: primary hazard which is the direct danger when eruption (hot cloud, pyroclastic drop, volcanic ash and java flow), secondary age where danger occurs after eruption (rain lava) and tertiary danger environmental damage (loss of catchment area / forest / spring). The table below shows the monitoring system of Mount Merapi.
Table 1. Mount Merapi Monitoring System
Seismic/ requirement To record earthquakes, all types of earthquakes
The standard method of monitoring of
volcanoes (G. Merapi, since
1922)
Deformation
To measure the body bubble of the mountain
Technique: EDM, Tiltmeter, GPS
Standard method as seismograph complement Visual observations Observation of lava dome conditions, morphology, solfatara, crater temperature Conventional techniques with the help of simple tools
Other methods Geokimia, magnetik, SP, Radon, RADAR dsb Geochemistry, magnetic, SP, Radon,
RADAR etc.
*Source BMKG Yogya
4.
RESULTS AND DISCUSSION
Results and Discussion is the part that will be done on the one-year research where application design includes using flow map, use case diagram, block diagram, menu, interface design, network architecture.
4.1.
Flow Map
T
he built models are designed to be placed at each of the Volcano Observation Posts (PGAs), and each is responsible for a particular area. Data from each PGA will be sent to the observation center.Figure 5. Flow Map
4.2.
Use Case
[image:3.595.50.284.532.769.2]Early warning cloud cloud is one aspect that plays an important role in the process of disaster management because as good as any handling becana nature if not implemented effectively then the results of research achieved both cognitive, affective and application aspects will also not be adequate. Therefore, the quality of a research is reflected in the quality of the research achievement process. For that reason the quality criteria and success of the research should be made in detail so that it can really be measured and observed. Clarity of criteria and indicators of success of this study will clarify the target in each stage of achievement of research results
.
Figure 6. Use Case
4.3.
Blok Diagram
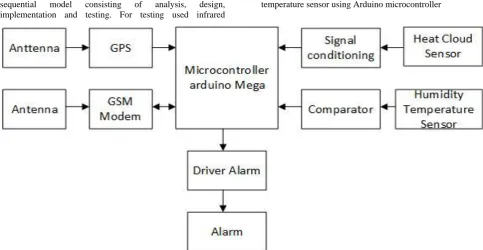
[image:3.595.319.536.535.672.2]sequential model consisting of analysis, design, implementation and testing. For testing used infrared
temperature sensor using Arduino microcontroller
Figure 7. Block Diagram of Hot Cloud Warning System
4.4.
Make Classification Of Heat Status
The data used for this experiment was taken randomly from samples of each mountain status. Each of these mountain statuses has sismograf, hot clouds, rising temperatures, poisonous gas, eruption lava, lava, incandescent rocks, hot mud, and different ash rains.
Bayesian filter or Naïve Bayes Clasifier is the latest method used for classifying. This algorithm utilizes the probability and statistical method proposed by the British scientist Thomas Bayes, predicting future probabilities based on prior experience.
P (A│B) = (P (A│B)) * P (A)/ P (B)
The probability of occurrence A as B is determined from the probability of B when A, Opportunity A and B chance on its application later this formula changes to:
P (Ci│D) = (P (D│Ci) * P(Ci)) / P(D)
Naïve Bayes Clasifies or commonly referred to as multinominal naïve bayes is a simplified model of bayes algorithm that fits in the classification of volcano status. The equations are:
Vmap = arg max P(vj | a1,a2,...aa
Here is one example of the calculation of the entropy value of a particular feature. Here, we take features from hot clouds. Here is the result of the amount of data from each class Table 2. Results of Amount Data From Each Class
Status of Hot Cloud Amount
Normal Yes 21
Normal No 28
Alert Yes 23
Alert No 5
Standby Yes 9
Standby No 13
Caution Yes 5
Caution No 15
5.
RESULTS OF DESIGNS
After analyzing and designing the tools that will be built in the previous Chapter the next stage is the implementation or implementation phase.
5.1
Making GIS Map of Hot Cloud Spread
[image:4.595.54.538.73.323.2]At the Making of Application of geographic information system using QuantumGIS software by integrating in software codeignatier. The basic map used is a map of the earth of Mount Merapi which is a map of raster data. This map is then converted into a vector format so that it can be given the appropriate coordinates.
Figure 8. QuantumGIS Heat Cloud
The quatumGIS data is managed and stored in the form of a table attribute where each table field represents one type of data. Fields in this system are: district field, subdistrict field, village field, field hamlet and field sensors. To create a system interfaces Arduino IDE is used which will communicate with web gIS application file using tracking mapping technique.
5.2.
Notifications on the application
[image:4.595.317.542.497.623.2]6.
ACKNOWLEDGMENTS
Thanks to the Ministry of Research and Technology of Technology and Higher Education , which has funded this research with competitive grants program in 2015 , so as to do research and work well.
7.
REFERENCES
[1] Khotimah, M.K., 2008. Climatology Tropical Cyclone Around Indonesia. Meteorology and Geophysics Bulletins
[2] Kodong, F. R. (2009), "Application of volcano status determination using temperature telemetry", National Seminar of Informatics 2009 (semnasIF 2009), UPN "Veteran" Yogyakarta. .
[3] Grady Booch Rational Santa Clara, California, object-oriented analysis and design.