Implementation of Scott Knott Algorithm in Rule-Base
Expert System for Competency Assessment of Human
Resources
Alifnawati
Master of Information System Diponegoro University
Semarang, Indonesia
R. Rizal Isnanto
Computer Engineering Diponegoro University
Semarang, Indonesia
Oky Dwi Nurhayati
Computer Engineering Diponegoro University Semarang, Indonesia
ABSTRACT
Effective human resources management requires an accurate assessment and representation. Therefore, competency mapping is required for particular occupation and position. That case can be done by identifying the gap between individual competency and the competency demanded in an organization. To obtain the information, it is necessary to identify organizational competence and to evaluate individual competence. The evaluation process is complicated and complex, since this process will adjust the individual’s competence for occupation or position required in organization. By utilizing technological advances and competency standard model proposed, to evaluate, to assess and to analyze individual competence use an expert system. In this study, it can implement in developing an expert system, statistical methods using Scott-Knott algorithm technique and rule-based system approach by backward chaining technique. To evaluate, analyze and classify individual competence into their best qualification group use the Scott-Knott algorithm. Whilst, the rule-based system with backward chaining technique can detect individual who is qualify to the competence of a position. By combining those two methods in the expert system of human resource competency obtained the result of the individual group with the best competence and individual who qualify competency to occupy a position. Compared to conventional methods, expert system of web-based competency assessment is more efficient, and it can manage individual competence profile hence created a good management competency in organization.
General Terms
Clustering of individual competencies
Keywords
Human resources, competency assessment, Scott-Knott algorithm, competency analysis, backward chaining, rule- based.
1.
INTRODUCTION
Effective human resources management requires an accurate assessment and representation. Therefore, competency mapping is required for certain occupation and position. By defining and identifying the appropriate gaps to reveal, the difference between the competencies acquired and required [5]. To obtain the information, each organization needs to conduct the competency evaluation. The evaluation process is such a complicated and complex to adapt the appropriate competency to the proper occupation in accordance with organizational requirements. It takes years of experience to assess the competence and performance of manager in developing a competent team and utilizing team talents to accomplish the work [20].
To identify competency gaps and human resource allocations, competency assessment should be efficient oriented toward goals and outcomes [12]. When Organization has to make a difficult decision, the organization often glances at experts to get an advice. By using the knowledge and skill of human reasoning, the expert system attempts to emulate the problem-solving abilities from human experts [19]. The expert system in human resources management can assess competency gaps between those obtained and required competencies, identifies the weaknesses and helps employee to achieve the required level of work quality for the desired job [1].
The necessity to develop strategy, model and tool for managing competence continues to emerge in variety of scenarios. This emergence continues to increase when needed in supporting human resources management decision systems and learning management systems [14]. The selection of a competency-oriented project portfolio has been facilitated using a multi-objective decision analysis that results in the best calculation of project selection [9]. Selecting items with a computerized adaptive test approach for student competency training [3], evaluating management competence and performance using Sanskrit computational linguistics (6), analyzing and evaluating human resource competencies using mathematical and statistical approaches [5], [12].
Based on this background, to support the successful assessment of human resource competence, statistical methods with Scott-Knott algorithm technique and rule based approach with backward chaining technique can be implemented. To classify and analyze individual competency into their best group based on their competence qualifications and rule-based backward chaining can detect individuals who qualify for the competence of a position by representing the knowledge in the rules of promotion use The Scott-Knott algorithm. In selecting the most accurate prediction model, The Scott-Knott algorithm has successfully applied to estimate software costs [13].
Scott-Knott's approach is most widely used because of its simple intuitive appeal and its excellent results [10], therefore it is very appropriate used to classify the competencies of human resources with many indicators and minimize errors. While the rule-based approach, method with backward chaining techniques will strengthen the expert system to analyze and to identify human resources that qualify the competence of a position. Thus, to strengthen the analysis in the assessment of human resources competence can use the both methods
2.
RESEARCH METHODOLOGY
2.1
Competency Model
so that the competency model is also. When creating a model of competence within an organization, it is necessary to consider various behavior, knowledge, skill and attitude to create their models [4]. Proposed model of competence hierarchy can be seen in Figure 1.
Figure .1 Model of Organizational Competence Hierarchy
Figure 1 is a hierarchical model of organizational competence used in this study. Competence references and sub-competence are taken in government rule. [7], [8], [15], [16], [11] as well as the adaptation of the pyramid competence model [13]. The competency hierarchy model consists of 3 levels: level 1 (Managerial, Technical and Socio-Cultural), level 2 consists of 12 subcategories and level 3 consists of 48 subcategories. Level 3 is the lowest level of the competence hierarchy that contains statements or questionnaires that will be tested to employees.
2.2
Competency Evaluation Using
Mathematical and Statistical Approach
Based on the competency hierarchy model in Figure 1, and then mathematical and statistical models are developed which leads to the ranking of employees for a particular position. The process of competency assessment explained in two stages: evaluation stage and assessment phase. At the evaluation stage, the system obtains information from the employee's actual competence data (ACD) associated with the employee assessment table in the system database. In addition, the system also collects information related to minimum competency requirements of the requested competencies data (RCD) required for the appraisal of employees in occupying a position. The main point to be noted is also in the competence mechanism is to prioritize competency (priority of competence-POC), a hierarchical process to determine the integrity that define the importance and the relative period of the competencies required for a
position [12].
The mathematical description of the evaluation stage, a matrix a n x mi matrixA (level k) consist of scores ACD
in which k = 1,2,3 indicates the level of the competence hierarchy or level of competence, indicates the
individual's being assessed (employees) and
indicates the competence categories of level k. Each element of the matrix ACD is an assessment evaluation stated by
symbol between 1 and 5, i.e. 1 ≤ ≥ 5. These symbols
can be transformed for calculation needs to the next analysis step.
At Figure 1 shows m3 = 48 is competencies level 3, the lowest level. This score is the basis for evaluating a higher level of assessment than the competency hierarchy model. Through the weighting scheme, it can calculate the item groups in each sub-category at level 3. To get level 2 score, each level 2 competency consists of 4 sub-competences level 3, the general equation to calculate the level-2 is:
(1)
With the weights
has been determined for every competence j of 2nd level. In this case, all weights divided by 1/4 and then count the average score of sub-competence level 3. In the same way, based on the value of level 2, level 1 can be counted by different weighting schemes in this case is 1/5 for the managerial competence, 1/3 for technical competence and 1/4 for social and cultural competence, then calculate the average value of each sub-competence of level 2.
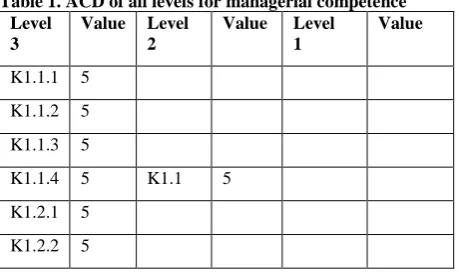
For example, in Table 1 the actual competence data (ACD) displays all levels of individual competence on managerial competence. There are not showing technical and social cultural competencies. On the assesment of competence level 2 and level 3, the competency score is calculated as the average value of the subcategories of level 1 and level 2. Based on the data, we can see the actual competence of employees at level 2 and level 1 before compared with the competencies demanded for a job position or specific position.
On the other hand, the requested data competition (RCD) can be presented as 1 x m3 vector at a single position or as a
matrix k x m3. Each element of RCD vector is an assessment
between 1 and 5, 1 ≤ ≤ 5, j = 1…, m3, at m = 48 the
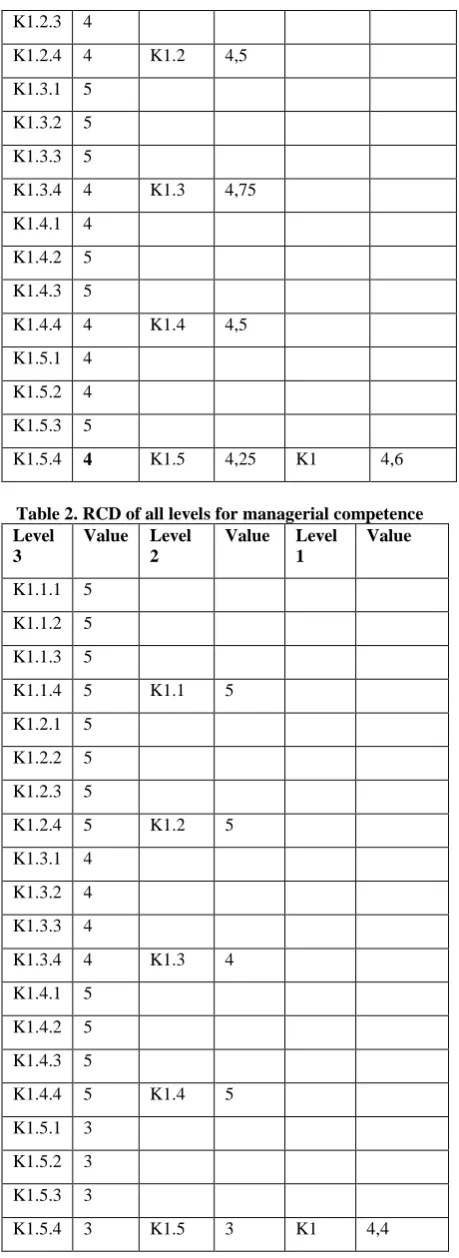
[image:2.595.316.546.635.771.2]competence from level 3. The upper level values are calculated by the same way in ACD. The procedure starts from the bottom up that starts from competence level 3. The following sample in Table 2 shows RCD on all competence levels.
Table 1. ACD of all levels for managerial competence Level
3
Value Level 2
Value Level 1
Value
K1.1.1 5
K1.1.2 5
K1.1.3 5
K1.1.4 5 K1.1 5
K1.2.1 5
K1.2.2 5
level 1 level 2 level 3
Competences (0)
Managerial Competences
(1)
Technical Competences
(2)
Social culture Competences
(3)
Manage other (6) Manage yourelf (5)
Manage tasks (7)
Related work skills (9)
Social skills (10)
Knowledge (11)
Interpersonal skills (13) Team work
(12)
Motivation to work (14)
Adaptation to change (20), Integrity (21), Commitment to the organization (22), Initiative (23)
Flexibility of thinking (16), Innovation (17), Think analytically (18), Conceptual thinking (19)
Cooperation (24), Leadership (25), Developing others (26), Guide (27)
Accuracy (36), Conceptual ability (37), Able to use tools that are relevant to the job (38), Capable of handling interruptions in work (39)
Serving others (40), Negotiation (41), Cooperation (42), Encourage others (43)
Methods in the work (44), Processes and Procedures (45), Job description (46), The suitability of knowledge variations (47)
Working with others (48), Personal qualities (49), Team role (50), Equalization goals (51)
Openness (52), Assertiveness (53), Conflict solving (54), Provide feedback (55)
Passion to work (56), Continual improvement (57), Continuing learning (58), Curiosity (59)
Ability to think (4)
Managing Socioclture (8)
Build a working relationship (28), Planing and organizing (29), Decision maker (30), Writen/oral communication (31)
Empathy (32), Social interaction (33), Responsive to cultural influeces (34), Sensitivity to the work environment (35)
Professionalism
K1.2.3 4
K1.2.4 4 K1.2 4,5
K1.3.1 5
K1.3.2 5
K1.3.3 5
K1.3.4 4 K1.3 4,75
K1.4.1 4
K1.4.2 5
K1.4.3 5
K1.4.4 4 K1.4 4,5
K1.5.1 4
K1.5.2 4
K1.5.3 5
[image:3.595.53.283.67.697.2]K1.5.4 4 K1.5 4,25 K1 4,6
Table 2. RCD of all levels for managerial competence Level
3
Value Level 2
Value Level 1
Value
K1.1.1 5
K1.1.2 5
K1.1.3 5
K1.1.4 5 K1.1 5
K1.2.1 5
K1.2.2 5
K1.2.3 5
K1.2.4 5 K1.2 5
K1.3.1 4
K1.3.2 4
K1.3.3 4
K1.3.4 4 K1.3 4
K1.4.1 5
K1.4.2 5
K1.4.3 5
K1.4.4 5 K1.4 5
K1.5.1 3
K1.5.2 3
K1.5.3 3
K1.5.4 3 K1.5 3 K1 4,4
In the Illustration of Table 2, the competency gap can explain among the competency value required for managerial positions with the actual competency value obtained by the individual's (Table 1). At level 3, we can see that the actual individual's competencies might be lower or higher than the competencies demanded. However, this dual meaning can be
solved at level 2 and level 1 which its value is more clearly visible. At the evaluation stage, the above appraisal has not calculated that the differences in individual's competencies can have different effects on the positions of a job or occupation. Therefore, we need a weighting mechanism that describes the relative preference of competence, and its effect on work or other positions with a hierarchical process called cumulative voting hierarchy (HVC).
The Cumulative voting method (CV) is a priority method for prioritizing items by using a ratio scale. Stakeholders and individual’s priorities usually determine priority of competences combined into one priority. Each stakeholder has different weighting preferences. The CV is also known as the 100-dollar’s method, or the 100-point’s method [17]. Weight distribution is given at level 1 and level 2 items which its value when added to each level will still be worth 100.
At the competency appraisal stage, the methodologies based on gap analysis that takes the different values of ACD and RCD competence weights with the gap value function is
that compare the value in the competencies. Generally, by evaluating the overall measurement (Mean Gap) of all competencies gap scores can cum the value of competency gaps. Finally, statistical methods with Scott-Knott's algorithm with some comparative procedures based on cluster analysis principles used as a ranking methodologies and classify individual competencies into the same (homogeneous) group.
2.3
The Competency Assessment through
Scott-Knott Algorithm
After the evaluation phase, the next stage of the assessment is ranking and classifying individual competences into the same (homogeneous) based on their competence qualifications. The assessment stage conducted by Scott-Knott algorithm that function only works on balanced design and designed to help researchers cooperate with analysis of variance (ANOVA) experiments. In this study, the design chosen is a repeatable measurement equal to a complete random block design (RCDB) [2]. Scott-Knott is algorithm hierarchy classification used as an exploration data analysis tool that its application with analysis of variance (ANOVA). In which comparison of treatment ratio is an important step to find homogeneous and non-homogeneous groups, it means that each situation leads to a significant F test [10]. Adaptation of random complete block design (RCDB) explained in the following general equation:
(2)
in which g is the gap value of each individual, μ is the actual
of entire average treatment (mean rate). While, is the effect
of treatment to or the difference of competence level 2, is
the effect from block to j or individuals within this framework, and is error in the form of effect comes from
the experimental unit to j which is subject to treatment to ,
is the employee (treatment) and j is the level 2 competency.
The experimental unit in the study is a subcategory of competency level 2. After calculating the value in the ANOVA table to the blocking effect, sum of square error, degree of freedom afterword estimation of variance (σ2) of random error which is part of the variable response that cannot be explained by its treatment effect. The following is the steps in ranking and clustering employee competencies using the Scott-Knott algorithm [13]:
candidate in ascending order:
(3)
2. For each , for two averages G into two
sub-groups and
and count the sum of squares between groups:
) + (4)
In which k is the number of treatments or averages in the
groups G1 and G2, |G1|, |G2| are cardinalities of the two
subgroups and , , are the means of groups G, G1
and G2, respectively:
,
, (5)
3. Find the maximum value of sum of square above:
(6)
4. Compute from the analysis of variance (ANOVA) table
the s2, the estimation of σ2 (the variance cannot be explained by the factors of treatment and its block) by dividing the sum of squares error with the appropriate degree of freedom. Next, calculate the comparison (calculate test statistic) with the following equation.
=
(7)
λ =
(8)
Statistic test spreads chi-square by the degree of
freedom (v) is given by v k/( 2) (rounded), in which
= 3.14.
5. The hypothesis test, if λ> χ2 ᴠ; α (in which α is the
parameter called the specified significant level of 0.05) it means the group is not homogeneous, therefore the same test applied to each group separately. If λ ˂ χ2 ᴠ; α then it means all homogeneous groups. The next procedure there is a non-homogeneous group so that the test done again by dividing the group into two subgroups, if λ its criteria are significant, then the homogeneous group is not identified anymore, until no any groups divided.
2.4
The Rule Based Backward Chaining
Approach on Expert System
Competence Assessment
Backward chaining is a strategy driven by a goal that outlines the problem into sub-problems and solves each other. It means the goal reduced to sub-goals and sub-goals reduced further and further until it solved directly. In the context of rule-based systems, backward chaining accomplished by the following algorithm [18]:
1. Assume the goal to infer a fact, for example, G. set the goal to G.
2. Find the rules, which can be, inferred G. If there are no rules for G, it may use step 4.
3. in each of the rules look at the sub-goals to be solved. Treat each sub-goal as a new goal and repeat step 2 and 3 with the new goal as current goal. If all sub-goals in a rule succeed, therefore the conclusion of the rule can be added into working memory.
4. If G matches with working memory element, it succeeds or fails.
The rule-based system is the simplest model created using by the set of statements and rules. The rules expressed in IF - THEN statements (called IF - THEN rules or production rules). The IF-THEN rule is one of the most common forms of knowledge representation that is common used in expert systems [17].
The rule-based system theory begun with a rule base that has all knowledge of the problems encountered that encoded into the IF-THEN rules containing data, preliminary statement and information. The system will check all rules of the IF condition determining the set of existing conflicts. If it found, then the system will do the condition. This iteration will continue until one or two conditions converge. The basic implementation of IF-THEN for rule-based systems is as follows:
IFcond1
and cond2
or cond3
thenaction1, action2, action3
The function applied to form a rule is i.e. [18]:
The domain knowledge of expert system in the competency assessment system is limited to the assessment competence of human resources that qualifying standard competence is Echelon III and echelon IV with the following procedure:
1. Participants have fulfilled the administrative requirements to take the competency promotion test including:
a. The last 2 years SKP has a good value
b. Maximum age is 56 years old
c. Minimum education is D3 for the echelon IV and S1 for the echelon III
d.The lowest position rank is III / d minimum 2 (two) years for echelon III and III / b at least 2 years for echelon IV
e. For the echelon III, it has ever held the position of echelon IV in 2 (two) different places.
2. Participants take competency exams
3. Position competence assessment
4. The results of competency meet the competency standards of a position
The following is a design of the knowledge basis done by creating a rule flow as shown in Figure 2.
Rules = IFcond1 andcond2 orcond3 then
Figure 2. Flow Chart of Position Competence Assessment
From the flow chart above can create rules that become the knowledge basis on the system that to be built by using logic operators in the form of IF-THEN. Some rules on assessment of competency positions in Table 3.
Table 3. Model rules of backward chaining for identification of occupation competence Rule Rules model of backward chaining for
identification of job competence
R1 If qualification S1 or S2
AND ages < = 56 years
AND grades >= III/d
AND echelon position IV
AND MSG > 0 Then
Eligible competency for echelon positions III
R2 If qualification ≠S1 or S2
Or ages > 56 years
Or grades < III/d
Or position ≠ echelon IV
Or MSG < 0 Then
Less qualified for echelon positions III
R3 If qualification D3 or S1 or S2
AND grades >= III/b
AND MSG > 0 Then
Eligible competency for echelon positions IV
R4 If qualification ≠ D3 or ≠S1 or ≠S2
Or grades < III/b
Or MSG < 0 Then
Less qualified for echelon positions IV
3.
RESEARCH DESIGN
3.1
Material and Tools
The material used in this research is survey data obtained by using questionnaire. The object of research is the employees who are qualified as S2, S1 and D3. At the level of staff with the minimum level of D3 and grade 3b is two years of working while at the managerial level, the minimum education level as S1dan grade 3d is two years of working. The numbers of employees as sample in this study consists of 30 staff and 30 structural officials who will take the test for their competence. Data required in this study includes questionnaire data, competency data are classified into 3 levels, they are competencies level 1, level 2 and level 3. Level 1 is the highest hierarchy of the competency model and level 3 is the lowest hierarchy containing the statement / questionnaire tested to the employee, work data, work unit data, the priority level of competence level 1 and level 2 and the required competency weight. To get the value of employee competency gap, it required the competence value data needed or the standard value required by the organization based on an occupation or position. The human resources team provides questionnaires and assessment weights for used in the system. The Likert Scale is used as an answer option from each question given at competence of level 3 with the details, the score being 5 (very important), 4 (important), 3 (very important), 2 (slightly important) and 1 (unimportant). Indicators in the assessment of employee competence using the competency model in Figure 1.
The research tool used in this research consists of hardware (hardware) that is a unit of computer and PHP programming to build the system, SQL to manage the database.
3.2
Research Procedure
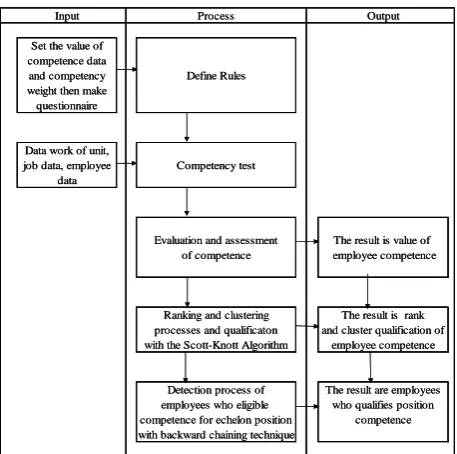
The procedure of this study is shown in Figure 3:
Figure 3. Research Procedure
3.3
The Framework of Information System
In this study, the methods used in expert systems of human resources competency assessment are the Scott Knott algorithm and rule-based approach with backward chaining technique. This research has tested to 60 employees
Echelon III position - Minimum qualification is S1 - Maximum age is 56 years - the position of echelon IV - The lowest position rank is III / d - MSG value is greater than zero (0)
Echelon IV position - Minimum qualification is D3 - Maximum age is 56 years - The lowest position rank is III / b - MSG value is greater than zero (0)
The Fact , Less eligible for echelon positions III and IV
Less eligible for echelon III position - Qualificaton is not S1 Or S2 - Or age over 56 years - the position is not echelon IV - MSG value is small from zero (0)
Less eligle for echelon IV position - Qualification is not D3 or S1 or S2 - Or age over 56 years
- Or the lowest position rank is not III / b
- MSG value is greater than zero (0)
Eligible competence for echelon position III and IV
Less eligible competence for echelon
Competence of positions The Fact ,
Eligible for echelon positions
III and IV
Literature Review
Survey, Identify
and formulatethe
problem
data collection and analysis data
System design
[image:5.595.47.288.339.715.2] [image:5.595.370.483.436.700.2]of Andalas University who have been eligible to take the competency test for promotion. The Scott Knott algorithm used to classify individual's into homogeneous clusters without overlap, qualifying space techniques used to classify individuals into the overheads or under the qualifications of individual's competencies. The backward chaining technique is used to identify personals who eligible to the competency standards of echelon III and IV positions. On Figure 4 described the framework of information system.
There are six stages in this research, they are:
1. Input, the data used in this study are competency
value data, the weight of the assessment questionnaire, the data of employee with work units and positions.
2. The process is defining the rules of competence,
competency testing.
3. Evaluation of competency assessment with
mathematics and statistics.
4. Competency assessment process with Scott-Knott
algorithm to classify competencies into clusters and qualifications
5. By the backward chaining techniques, the process of
identifying personals who meet the competency standards of a position
6. Output is the value of the competence employees,
clusters based on competence and qualifications with the results of individuals who meet the competency standards of position.
Figure. 4 Framework of Information System
4.
RESULTS
The final result of this research is an expert system of web-based human resource competency assessment. The result of
competency evaluation is competency matrix, level 2 and
level 1 and the value of competency gap. The Assessment of competence provides information about personal competence groups based on their best competencies and high or low qualifications of competencies who meet the competency standards of a position.
4.1
Competency Evaluation Results
The final result of competency evaluation conducted on 60 respondents at the managerial and staff level is the value of competency gap. The gap value is the basis for assessing personal's competencies. Table 3 shows the personal's gap values represented by 6 respondents at level of managerial.
[image:6.595.54.283.412.639.2]In the table 3, the competency of the gap value at level 2 obtained from the comparison of the ACD with the priority value of RCD at level 2. Based on the gap value obtained by each respondent, it has seen that Indra, Leni and Raimon have the best competence and performance qualification compared with the other respondents.
Table 3. the gap value of level 2 for 6 respondents
Level
2 TUTI LENI ISMAEL INDRA MON JON
K1.1 0,00 0,00 0,00 0,00 0,00 -0,08
K1.2 -0,05 0,00 -0,03 0,00 0,00 -0,08
K1.3 0,07 0,10 0,10 0,03 0,10 0,05
K1.4 -0,05 0,00 0,00 0,00 0,00 -0,08
K1.5 0,06 0,06 0,09 0,08 0,10 0,05
4.2
Experimental Results through
Scott-Knott Algorithm
Based on the gap value of competency and then calculates the value of analysis of variance (ANOVA). In this study, the type of experimental design used was a random complete block design (RCDB) which combining two experimental factors. The treatment represents 30 respondents and the block is subcategory variable of level 2. The purpose is to investigate the effect of the difference of respondents in the gap response variable; it is to test the differences of respondent's competence through Scott-Knott algorithm. Eta squared (η2) describes the variant ratio explained in the error variable by factors while controlling for other factors. Table 4 shows the significance and effect sizes (partial eta square) of ANOVA.
Table 4. Significance values and effect size (partial eta-squared) of ANOVA
Factors Df F-Value P-Value
partial eta square (η2
)
Respondents 29 9,85 0,000 0,720
Block Effect 4 121,94 0,000 0,814
In the table 4 shows that the treatment (respondent) and block effect are statistically significant (p-value <0,000) with the large effect blocks (η2> 0.14) in the population. It means that there are respondents who are generally better in qualification or competence than others are. Then, the next, give the rate for respondents and select them for the appropriate occupation.
4.3
The Results of Ranking and Clustering
Competencies with the Scott-Knott
Algorithm
Based on the gap value of competency at level 2, and then calculate the average value of competency gaps and its standard deviation by summing up all the gap values of each respondent then divide by the numbers of category variables
Input Process Output
Set the value of competence data
and competency Define Rules
weight then make questionnaire
Data work of unit,
job data, employee Competency test
data
Evaluation and assessment The result is value of
of competence employee competence
Ranking and clustering The result is rank
processes and qualificaton and cluster qualification of with the Scott-Knott Algorithm employee competence
Detection process of The result are employees employees who eligible who qualifies position
competence for echelon position competence
with backward chaining technique
Input Process Output
Set the value of competence data
and competency Define Rules
weight then make questionnaire
Data work of unit,
job data, employee Competency test
data
Evaluation and assessment The result is value of
of competence employee competence
Ranking and clustering The result is rank
processes and qualificaton and cluster qualification of with the Scott-Knott Algorithm employee competence
Detection process of The result are employees employees who eligible who qualifies position
competence for echelon position competence
[image:6.595.316.547.532.594.2]at level 2. Afterwards, find the limit values of upper and lower by adding or subtracting the averages value of competency gap. Figure 5 shows the ranking and clustering of the average
[image:7.595.59.550.107.276.2]competency gap represented by 30 respondents from the managerial level, while the staff level is not shown.
Figure 5. rangking and clustering respondents of level managerial
In Figure 5 there are six clusters formed as the result of ranking and clustering by using the Scott-Knott Algorithm. Cluster A is a group of individuals who have the best competence with over performance qualification (high performance). Cluster B is a group of individuals who have a good competence with performance over qualification (performing normally). While clusters C, D, E and F belong to the groups underperforming (under) competence. Based on that information, the leader can evaluate the individual's ability and put in the appropriate job positions and occupations, predicting the human resource needs in serving the customer by comparing the number of customers served with the number of employees, the promotions of positions and the employees who will be given training to improve their performance. In Figure 5 is also shows that the abilities of personals in performing their tasks and responsibilities influenced by educational factors and work experiences.
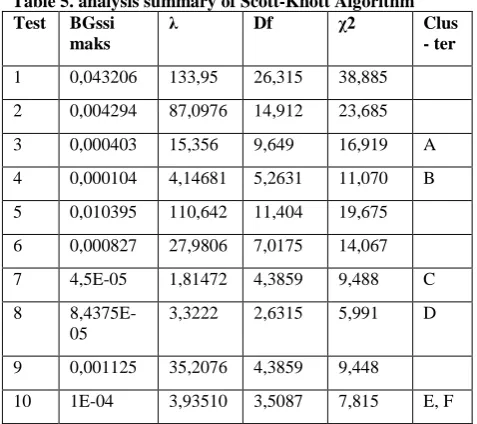
The following is an analysis summary of the clusters formed on Figure 5. It is shown in Table 5.
Table 5. analysis summary of Scott-Knott Algorithm Test BGssi
maks
λ Df χ2 Clus
- ter
1 0,043206 133,95 26,315 38,885
2 0,004294 87,0976 14,912 23,685
3 0,000403 15,356 9,649 16,919 A
4 0,000104 4,14681 5,2631 11,070 B
5 0,010395 110,642 11,404 19,675
6 0,000827 27,9806 7,0175 14,067
7 4,5E-05 1,81472 4,3859 9,488 C
8
8,4375E-05
3,3222 2,6315 5,991 D
9 0,001125 35,2076 4,3859 9,448
10 1E-04 3,93510 3,5087 7,815 E, F
4.4 The Results of Identification of Position
Competencies with Rule-Based
Backward Chaining
[image:7.595.311.531.382.562.2]Based on the rules of position identification that has been made, it obtained the results of positions competence represented by 5 respondents shown in Table 6.
Table 6. The result of echelon 3 position competency
Rank Respondents Education MSG Results
1 Harman S2 0,04 Qualified
competence
2 Ridhawati S2 0,04 Less
qualified competence
3 Isnaretni S1 0,04 Qualified
competence
4 Hadesmon S2 0,04 Less
Qualified competence
5 Iswardi S2 0,035 Qualified
competence
Subsequent tests for individuals who qualify for position competence are interviews conducted by the competence assessment team. Whose decisions will be elected to the positions of echelon III decided by the leadership.
5.
CONCLUSION
Evaluation and assessment of competencies conducted on 30 respondents at the managerial level and 30 respondents at the staff level, by using the Scott-Knott algorithm method are able to rank and to classify individual competencies into their best competence qualification group without overlap. While, the rule-based backward chaining method can identify individuals who qualify the competencies of a position. The result of this study is very helpful to the organization in improving employee performance and quality of their services to customers. For further research, the developed method can be used in context and in other cases such as medical science and pharmaceutical or labor. Further assessment, educational factors and work experience on the assessments of
Rank Resp ondents M SG Lower Up p er Qualification Cluster Rank Resp ondents M SG Lower Up p er Qualification Cluster
1 RAIM ON 0,040 -0,015 0,0948 over A 16 ERIJON -0,003 -0,082 0,0768 under B
2 HARM AN 0,040 -0,015 0,0948 over A 17 YUSM I -0,008 -0,100 0,0850 under B
3 HADESM ON 0,040 -0,015 0,0948 over A 18 WIDYA -0,020 -0,068 0,0281 under C
4 ISNARETNI 0,040 -0,015 0,0948 over A 19 AM EL -0,023 -0,104 0,0587 under C
5 RIDHA 0,040 -0,015 0,0948 over A 20 BETNELI -0,023 -0,113 0,0678 under C
6 ISWARDI 0,035 -0,025 0,0952 over A 21 JON -0,025 -0,093 0,0435 under C
7 LENI 0,033 -0,014 0,0789 over A 22 BEN -0,030 -0,106 0,0458 under C
8 IRWANTO 0,033 -0,014 0,0789 over A 23 RENO -0,040 -0,124 0,0436 under D
9 ISM AEL 0,033 -0,025 0,0895 over A 24 SOS -0,043 -0,139 0,0542 under D
10 ARDI 0,023 -0,045 0,0900 over A 25 YURIZAL -0,053 -0,157 0,0522 under D
11 INDRA 0,020 -0,013 0,0526 over A 26 DASWEN -0,075 -0,148 -0,0021 under E
12 TUTI 0,008 -0,052 0,0672 over B 27 KASREL -0,080 -0,145 -0,0153 under E
13 NURSYAM 0,005 -0,089 0,0992 over B 28 BOY -0,085 -0,196 0,0262 under E
14 DESWAN J 0,003 -0,081 0,0856 over B 29 ALI -0,090 -0,122 -0,0576 under E
[image:7.595.48.287.510.722.2]competence to occupy job need to be noted. To improve the competency of human resources then the evaluations of competence in the organization needs to be done every year.
6.
REFERENCES
[1] Amiri, M., Zandieh, M., Soltani, R., and Vahdani, B, “A Hybrid Multi-criteria Decision Making Model for Firms Competence Evaluation”, Expert Systems with Applications. Elsevier Ltd, 36(10), pp.12314–12322, 2009.
[2] Azhar, D., Riddle, P., Mittas, N., Mendes, E., and
Angelis, L, “Using Ensembles for Web Effort Estimation”, International Symposium on Empirical Software Engineering and Measurement, pp. 173-182, 2013.
[3] Badaracco, M., and Martinnez, L, “A Fuzzy Lingustic
Algortithm for Adaptive Test In Intelligent Tutoring System Based On Competences”, Expert Systems with Applications, 40(8), pp. 3073–3086, 2013.
[4] Barbazette, J. 2005. The Trainer’s Journey to
Competence, Publised by Pfeiffer, Sanfrancisco, CA 94103-1741.
[5] Bohlouli, M., Mittas, N., Kakarontzas, G., Theodosiou,
T., Angelis, L., and Fathi, M, “Competence Assessment as an Expert System for Human Resource Management: A Mathematical Approach”, Expert Systems with Applications. Elsevier Ltd. Vol. 70, 83-102, 2017.
[6] Chaudhari, P. R., Gangurde, P. C., and Kulkarni, N. L, “Design of an expert system for competence and performance management using Sanskrit computational linguistics”, Proceedings of the 2015 International Conference on Green Computing and Internet of Things (ICGCIoT) 2015, pp. 90-92.
[7] Government Regulation No. 11 of 2017, On the
Management of Civil Servants.
[8] Government Regulation No. 100 of 2000, Concerning
the Appointment of Civil Servants in Structural Positions.
[9] Gutjahr, W.J., Katzensteiner, S., Reiter, P., Stummer, C.,
and Denk, M, “Multi-Objective Decision Analysis for Competence-Oriented Project”, European Journal of Operational Research, Vol. 205, 670-679, 2010.
[10] Jelihovschi, E., Faria, J.C., and Allaman, I. B,
“ScottKnott: A Package for Perfoming the Scott-Knott Clustering Algorithm in R”, TEMA (Sao Carlos), 15(1), p.3, 2014.
[11] Law No.5, State Civil Apparatus, 2005
[12] Mittas, N., Kakarontzas G., Bohlouli, M., Angelis, L., Stamelos, I., and Fathi, M, “ComProFITS: A Web-Based Platform for Human Resource Competence Assessment”, IISA 2015 - 6th In Information Conference on Information, Intelligence, Systems and Applications. pp.1-6.
[13] Mittas, N., and Angelis, L, “Ranking and Clustering
Software Cost Estimation Models through a Multiple
Comparisons Algorithm”, IEEE Transactions on
Software Engineering, 39(4), pp.537-551, 2013
[14] Miranda, S., Orciuoli, F., Loia, V., and Sampson, D, “An
ontology-based model for competence management,” Data & Knowledge Engineering. Elsevier, 107(Oktober 2015), pp. 51–66.
[15] Regulation of the head of the State Personnel Agency
No. 7 of 2013, About the Manual of Standard Managerial Competency Standards.
[16] Regulation of the Head of the State Personnel Agency
No. 8 of 2013, Regarding Guidelines for the Compilation of Technical Competency Standards.
[17] Rinkevics, K.2011. An Analysis of Cummulative Voting
Results, School of Computing Blekinge Institute of Technology SE-371 79 Karlskrona, Sweden.
[18] Sasikumar, M, Ramani, S., Raman, S.M., Anjayenulu,
K.S.R., and Chandrasekar, R. 2007. A Practical Introduction to Rule Based. New Delhi: Narosa Publishing House.
[19] Turban, E., Aronson, J.E., dan Liang, J.P. 2007. Decision
Support System and Intelligent System, Asoke K. Ghosh, New Delhi.
[20] Tripathi P., Ranjan J., and Pandeya T, “Developing
Computational Intelligence method for Competence Assessment through Expert System”, An Institutional
Development Approach, 2010 IEE International
Conference on Computational Intelligence and