1
Plants face the flow in V-formation: a study of plant patch alignment in streams
1Authors: 2
Loreta Cornacchia1,7, a [email protected], [email protected] 3
Andrew Folkard2 [email protected] 4
Grieg Davies3 [email protected] 5
Robert C. Grabowski4 [email protected] 6
Johan van de Koppel1,7 [email protected] 7
Daphne van der Wal1,8 [email protected] 8
Geraldene Wharton5 [email protected] 9
Sara Puijalon6 [email protected] 10
Tjeerd J. Bouma1,7 [email protected] 11
12
Affiliations: 13
1 NIOZ Royal Netherlands Institute for Sea Research, Department of Estuarine and Delta 14
Systems, and Utrecht University, P.O. Box 140, 4400 AC Yerseke, the Netherlands. 15
2 Lancaster Environment Centre, Lancaster University, Lancaster, UK 16
3 Southern Water Services, Southern House, Worthing, UK 17
4 Cranfield Water Science Institute, Cranfield University, Cranfield, UK 18
5 School of Geography, Queen Mary University of London, London, UK 19
6 Univ Lyon, Université Claude Bernard Lyon 1, CNRS, ENTPE, UMR 5023 LEHNA, F-69622, 20
Villeurbanne, France 21
7 Groningen Institute for Evolutionary Life Sciences, University of Groningen, PO Box 11103, 22
9700 CC Groningen, The Netherlands 23
8 Faculty of Geo-Information Science and Earth Observation (ITC), University of Twente, P.O. 24
Box 217, 7500 AE Enschede, The Netherlands 25
a Present address: UMR 5023 LEHNA, Université Lyon 1, CNRS, ENTPE, Villeurbanne Cedex, 26 France 27 Corresponding author: 28 Loreta Cornacchia 29
NIOZ Royal Netherlands Institute for Sea Research 30
Korringaweg 7 31
4401 NT Yerseke 32
The Netherlands 33
email: [email protected] 34
Tel.: +31 (0)113 577 457 35
Fax: +31 (0)113 573 616 36
2 Running head: Plant patch alignment in streams 38
Keywords: submerged aquatic macrophytes; spatial patterning; eco-hydrodynamics; bio-physical
39
feedbacks
40
Abstract 41
Interactions between biological and physical processes, so-called bio-physical feedbacks, are 42
important for landscape evolution. While these feedbacks have been quantified for isolated patches 43
of vegetation in aquatic ecosystems, we still lack knowledge of how the location of one patch 44
affects the occurrence of others. To test for patterns in the spatial distribution of vegetation patches 45
in streams, we first measured the distance between Callitriche platycarpa patches using aerial 46
images. Then, we measured the effects of varying patch separation distance on flow velocity, 47
turbulence, and drag on plants in a field manipulation experiment. Lastly, we investigated whether 48
these patterns of patch alignment developed over time following locations of reduced 49
hydrodynamic forces, using two-year field observations of the temporal patch dynamics of 50
Ranunculus penicillatus in a lowland chalk stream. Our results suggest that vegetation patches in 51
streams organize themselves in V-like shapes to reduce drag forces, creating an optimal 52
configuration that decreases hydrodynamic forces and may therefore encourage patch growth. 53
Downstream patches are more frequently found at the rear and slightly overlapping the upstream 54
patch, in locations that are partially sheltered by the established upstream vegetation while ensuring 55
exposure to incoming flow (important for nutrient availability). Observations of macrophyte patch 56
dynamics over time indicated that neighbouring patches tend to grow in a slightly angled line, 57
producing a spatial pattern resembling the V-formation in migratory birds. These findings point to 58
the general role of bio-physical interactions in shaping how organisms align themselves spatially to 59
3
Introduction
61
Biogeomorphic landscapes, such as rivers, mangroves and salt marshes, are characterized by strong 62
interactions between biological and physical processes. These reciprocal interactions, also referred 63
to as bio-physical feedbacks, are fundamental for landscape formation, adjustment, and evolution 64
(Corenblit et al. 2007; Murray et al. 2008; Corenblit et al. 2015). By obstructing the flow, 65
vegetation stimulates channel formation in tidal marsh landscapes (Temmerman et al. 2007; 66
Kearney and Fagherazzi 2016). In fluvial environments, riparian and floodplain plants affect the 67
processes and morphology of alluvial rivers (Tal and Paola 2007; Gurnell 2014). Such 68
environments are characterized by the presence of ecosystem engineers (Jones et al. 1994; Gurnell 69
2014), organisms that are able to modify their habitat through their action or their own physical 70
structure or actions. To understand these biogeomorphic systems, many studies have focused on 71
interactions between vegetation, hydrodynamics, and sedimentation processes (Leonard and Luther 72
1995; Madsen et al. 2001; Bouma et al. 2007). These landscapes are often characterised by patchy 73
vegetation, at least during the establishment phase. However, despite many plants being the 74
keystone species in these environments, understanding of how flow modification at the patch scale 75
may affect the processes and mechanisms controlling vegetation establishment and the 76
hydrodynamics of these systems remains limited. 77
The interactions between flowing water and plants have been studied across different 78
ecosystems, over a variety of spatial scales and vegetation configurations. Such configurations 79
include homogeneous fields of vegetation (Kouwen and Unny 1973; Nepf and Vivoni 2000; Chen 80
et al. 2013) as well as isolated plant patches (Sand-Jensen and Vindbœk Madsen 1992; Bouma et al. 81
2009; Zong and Nepf 2012). The impact of a vegetation patch on hydrodynamics and sediment 82
4
al. 2008; Schoelynck et al. 2012), for instance changing from reduced flow velocities within the 84
vegetation to increased velocities around it. Many more studies have been carried out on individual 85
patches of submerged aquatic macrophytes (for example, Jensen and Mebus, 1996; Sand-86
Jensen, 1998; Sukhodolov and Sukhodolova, 2009), compared to studies with multiple macrophyte 87
stands (Cotton et al. 2006; Wharton et al. 2006; Marjoribanks et al. 2017). As patches in a 88
landscape rarely grow in isolation but rather in mosaics (Temmerman et al. 2007; Van der Wal et al. 89
2008), including a pseudo-braided pattern in rivers (Dawson 1989), one patch may affect other 90
patches by altering its local environment. The size of the gap between vegetation patches can be 91
influenced by current velocity (Fonseca and Bell 1998) and turbulence, and has implications for 92
physical and ecological processes (e.g. sedimentation, nutrient availability) (Folkard 2005; Folkard 93
2011). Recent attention has been focused on the larger-scale impact of multiple patches, and how 94
their size and/or alignment affects flow patterns (Folkard 2005; Vandenbruwaene et al. 2011; 95
Adhitya et al. 2014) and sediment deposition (Meire et al. 2014), and the implications for landscape 96
adjustments and evolution (Kondziolka and Nepf 2014; De Lima et al. 2015; Gurnell and 97
Grabowski 2016). However, knowledge is still lacking on how the location of one patch may affect 98
the occurrence of another patch, potentially leading to optimal spatial configurations due to 99
hydrodynamic force reduction. 100
Several studies have revealed the importance of facilitation, i.e. positive interactions 101
between species that promote establishment by mediation of physical stress (Bruno et al. 2003; 102
Callaway 2007). Thus, positive feedbacks created by one patch may extend beyond the patch itself 103
(Bruno and Kennedy 2000), leading to a facilitative effect on the establishment or growth of other 104
species. Such interactions between vegetation patches are likely to be relevant for plant 105
5
act to dislodge seedlings and fragments (Riis 2008; Balke et al. 2014). However, studies of 107
facilitation mostly focus on interactions between individuals of different species or interspecific 108
interactions (Bruno et al. 2003; Callaway 2007). Consequently, we know relatively little about 109
intraspecific facilitation mediated by existing vegetation patches of the same species and its effects 110
on distribution patterns in the landscape. It is important to address this gap as intraspecific 111
facilitation is likely to be a key process in flow-dominated systems, where currents and drag forces 112
may impose a stress that limits growth and seedling establishment (Schutten et al. 2005; Puijalon et 113
al. 2008; Balke et al. 2011). It is known that vegetation patches may increase flow velocity in some 114
adjacent areas, while reducing it directly downstream of the patch (Bouma et al. 2007; Chen et al. 115
2012; Schoelynck et al. 2012). As a consequence, optimal spatial configurations of vegetation 116
patches might be expected to emerge due to patterns of hydrodynamic force reduction, specifically 117
in terms of drag force reduction. 118
Plant-flow interactions have been studied intensively in vegetated streams because of their 119
ecological and geomorphological importance (Gurnell 2014; Bertoldi et al. 2015; Grabowski and 120
Gurnell 2016), and the presence of unidirectional flow makes them an ideal model system. In this 121
study, we investigated the spatial distribution of submerged aquatic vegetation patches and the 122
implications of this for in-stream landscape adjustments over a two-year timescale. There were 123
three components to the study. First, naturally occurring macrophyte patches were identified from 124
aerial images to determine the average patch separation distances. Then, a field manipulation 125
experiment was conducted to measure the effects of varying patch separation distance on flow 126
velocity, turbulence, and drag on the submerged plants. We considered drag reduction as a proxy 127
for the benefits derived by plants from their location in relation to other patches. Previous studies 128
6
on successful root development (in the order of days; Segretain et al. (1998); Barrat-130
Segretain et al. (1999)) and protection from scouring or dislodgement due to currents and drag. 131
Most of this primary colonization phase derives from drifting vegetative fragments, and rarely from 132
seeds (Sand-Jensen et al. 1999; Riis 2008). To test whether the most frequent patch distributions 133
corresponded to the locations with the lowest drag forces, we related patterns of drag reduction to 134
the observed probability of patch occurrence identified from aerial images. After colonization, 135
single shoots develop into patches on intra-annual time scales through clonal expansion (over the 136
course of months; Cotton et al. (2006); Wharton et al. (2006)). Therefore, finally we tested whether 137
such preferential patch distributions obtained from aerial images were supported by field 138
observations of temporal patch dynamics in a lowland chalk stream over a period of two years. 139
Materials and methods
140Measuring inter-patch distance from in-stream aerial images 141
To investigate the existence of preferential distributions of plant patches, we collected aerial images 142
of an artificial drainage channel with natural colonization by aquatic vegetation. The channel is 143
located along the Rhône River (France), near Serrières-de-Briord (45.8153 ° N, 5.4274 ° E). The 144
channel, selected for its uniform cross-sectional and planform geometry allowing a focus on plant 145
configuration, had an average channel width of 8.0 m, an average depth of 0.8 m, rarely exceeding 146
1.3 m, with relatively straight banks. Aerial images of the streambed were taken with a digital 147
camera mounted on a pole at a height of c. 2 m. We identified 22 pairs of neighbouring patches for 148
the dominant aquatic macrophyte Callitriche platycarpa. This species has long, flexible shoots that 149
7
only at the upstream edge (Haslam 1978). The pairs could clearly be distinguished as separate 151
patches through the presence of an unvegetated area between their rooting parts. In these streams, 152
neighbouring patches were defined as those within 1.5 m from each other, because the influence of 153
an upstream patch can be observed for a distance equal to its length (Sand-Jensen and Mebus 1996; 154
Schoelynck et al. 2012), and 1.5 m is representative of the average length of C. platycarpa patches 155
(Sand-Jensen 1998). We measured the absolute longitudinal inter-patch distance (distance between 156
their upstream edges in the streamwise direction, Ld in m) and transversal inter-patch distance 157
(distance between their leftmost edges in the spanwise direction, Td in m) between the pairs (Figure 158
1). To account for differences in absolute distances due to the variability in patch sizes, we 159
converted them into relative distances. To obtain relative longitudinal distances (L), we divided the 160
absolute distance Ld by the length of the upstream patch Lu. To obtain relative transversal distances 161
(T), we divided the absolute distance Td by the width of the upstream patch Tu (Figure 1). The 162
frequency distributions of relative longitudinal and transversal distances were first converted into 163
probability distributions. Then, the probability distributions in the two directions were multiplied by 164
each other to obtain the probability of naturally-observed occurrences of vegetation patches for 165
each combination of L and T distances. This point grid was imported into GIS software and 166
interpolated to obtain a two-dimensional probability map of naturally-observed patch occurrence 167
(%) at different distances from an existing patch, using kriging interpolation. 168
Quantifying the effects of inter-patch distance on flow velocity and drag using a field 169
manipulation experiment 170
Flow velocity measurements
8
To assess the effects of different patch configurations on flow reduction and acceleration, we 172
measured the changes in flow velocity with varying patch separation distance through a field 173
manipulation. Plants were detached from existing patches, transplanted on perforated metal plates 174
and fixed through cable ties at the roots, to recreate two C. platycarpa patches (1.2 m in length, 0.6 175
m in width) that could be moved and arranged at different distances in the river bed. The two 176
patches were arranged into 10 different configurations, representing a combination of longitudinal 177
and transversal distances (Figure 2). The patch located upstream (“patch U”) was kept fixed, while 178
the other one (“patch D”) was moved downstream and/or laterally to create the configurations. The 179
two patches were partially overlapping in one configuration (T = 0.5, L = 0.46), as the leading edge 180
of patch D started at the end of the rooted area of patch U. In this case, the overhanging canopy of 181
patch U was located in the upper water layer, while the leading edge of patch D was located close 182
to the bed, which still allowed water to flow in between the two patches. The patch characteristics 183
(width, length and density) were kept constant between the fixed and mobile patches. Patch density 184
was fixed by fitting the plants into the perforated metal plates, with an array of 9408 holes per m2. 185
The condition of the plant patches did not deteriorate during the course of the experiment, thus 186
maintaining a similar morphological function within the river. 187
Vertical profiles of flow velocity were measured with a 3D acoustic Doppler velocimeter 188
(ADV, Nortek) over 2 min at 10 Hz. Hydrodynamic profiles were measured at five vertical 189
locations of 5, 10, 20, 40 and 90% of the depth above the river bed. Around the pair of vegetation 190
patches, vertical profiles were located at distances of 0.2 m and 0.1 m respectively from the 191
upstream edges, and 0.2 m on both sides of each patch (at 0.35 m along their length), i.e. in the gap 192
between the patches. For each point measurement in the profile, mean values of the velocity 193
components u, v and w were calculated (corresponding to velocities in the x, y and z directions; m s -194
9
incoming flow velocity, which was recorded at a fixed measurement point located 0.5 m upstream 196
of patch U. 197
Turbulent kinetic energy
198
To determine the effects of different patch configurations on turbulence, we measured the changes 199
in turbulent kinetic energy (TKE, m2 s-2) with different patch separation distances. TKE is a 200
measure of hydrodynamic turbulence that can negatively affect plants through direct effects on their 201
growth (Jaffe and Forbes 1993). Also, by governing processes of sediment trapping and 202
resuspension (Hendriks et al. 2008), it can potentially affect plant establishment by reducing 203
sediment stability. TKE was therefore calculated for the profile located at 0.1 m from the upstream 204
edge of patch D, to investigate its potential implications for establishment. We first calculated the 205
turbulent fluctuations 𝑢#(𝑡) = 𝑢(𝑡) − 𝑢 where 𝑢(𝑡) is the time series of flow measurements and 𝑢 206
is the time-averaged velocity (m s-1) in the streamwise direction at each vertical position. The 207
corresponding spanwise and vertical turbulent velocity components 𝑣# and 𝑤# were calculated in 208
the same way. For each point measurement in the profile, turbulent kinetic energy (per unit mass) 209
was then calculated as 𝑇𝐾𝐸 = /
0 1𝑢#0+ 𝑣#0+ 𝑤#03. 210
Drag force measurements
211
To investigate the benefits of different patch configurations in terms of drag reduction, we 212
measured the effects of varying patch separation distance on drag forces. Drag forces were 213
measured using a force transducer developed by the former WL Delft Hydraulics (now Deltares, 214
Delft, The Netherlands). The transducer consisted of a solid platform, carried by two steel 215
cantilever beams, with four temperature-corrected strain gauges mounted in pairs on opposite sides 216
10
force transducer was linearly correlated with forces up to 10 N (r2 = 0.99, p < 0.001). During the 218
measurements, a C. platycarpa plant was mounted on top of the transducer and placed into the river 219
bed at the upstream edge of patch D. For the measurements, we selected isolated plants of 55.1 ± 220
5.8 cm in height and with 4 to 9 ramifications. Plants were attached to the transducer by their stem, 221
and positioned in a natural growth position to closely represent the natural conditions. Voltage 222
readings were collected on a data logger at a frequency of 100 Hz and expressed as the mean value 223
for 1 min. As bending and leaning of the plant on the vegetation patch interferes with measuring the 224
actual drag on the individual, drag measurements were also performed by removing patch D and 225
repeating the measurement on the single plant. To allow comparisons between individuals, drag 226
was expressed as a function of total plant surface area. 227
Effects of patch interactions on seasonal in-stream landscape adjustments: evidence from 228
temporal field surveys 229
To test whether new vegetation occurred preferentially at certain distances and directions from 230
initial vegetation patches, we analysed field surveys of vegetation development from a study on a 231
chalk stream reach within the Frome-Piddle catchment (Dorset, UK) over two years (monthly from 232
July 2008 to July 2009, and bimonthly thereafter until July 2010; for further information on the 233
field surveys, please see Davies (2012)). The study reach was the Bere Stream (UK Grid Reference 234
385563, 93009), a relatively straight 30 m section with bankfull widths ranging between 7-9 m. The 235
dominant in-channel aquatic macrophyte was water crowfoot (Ranunculus penicillatus subsp. 236
pseudofluitans) which has highly similar patch establishment dynamics and structural traits to 237
Callitriche platycarpa (rooted at the upstream part of the patch and with very flexible stems that 238
11
establishment are determined by mechanical forces (e.g. drag, flow velocity). These forces increase 240
the risk of plant uprooting or dislodgement and relate to plant morphological characteristics (Bal et 241
al. 2011), rather than species characteristics such as growth rates. Thus, field observations of 242
Ranunculus could be compared with the findings of the field manipulation experiments of C.
243
platycarpa. 244
The data set from the Frome-Piddle catchment afforded a unique opportunity to assess the 245
occurrence of new vegetation and changes in vegetation cover and spatial distribution over time. 246
The field survey was a repeated measures design over time. During each survey, macrophyte 247
distribution was mapped along 30 transects that were located at 1-m distance intervals along the 30-248
m long study reach. Along each transect, measurement points were located at 0.5 m intervals to 249
record macrophyte presence and species. The sample size was 2150 measurement points, replicated 250
over 19 surveys, of which six surveys were used in this study.Reach survey data were analysed 251
using GIS software. The total station coordinates of the transect markers were used to georeference 252
a digitised version of the reach within a GIS. The output resulted in an array of points that were 253
spatially arranged along transect lines. Vegetation cover observed at points in the reach data set 254
were interpolated using an Inverse Distance Weighted (IDW) interpolation method. If the predicted 255
surface outputs from IDW differed from the substrate cover observed at any extra observation point 256
not used in the IDW, the substrate cover observed at that point prevailed above the IDW 257
interpolation. Separate vegetation patches were derived using the minimum bounding geometry 258
enclosing each of the polygon outputs from IDW. Although not measured in this study, seasonal 259
changes in macrophyte cover are generally associated with changes in vegetation biomass density 260
(g dry weight m-2). A previous study in the Bere Stream found that Ranunculus density was lowest 261
during winter (January, about 100 g DW m-2) and peaked during the summer months (May – July), 262
12
We tested the hypothesis that directions of growth of new patches compared to existing 264
patches during the survey period show preferential directions for plant growth, instead of being 265
uniformly distributed in all directions. Therefore, six replicate surveys over three different periods 266
were selected over the two years (December 2008 – July 2009, September 2009 – January 2010, 267
January 2010 – July 2010) because a net increase in Ranunculus cover was measured within each 268
of them, allowing the phase of new macrophyte patch colonization to be captured. The shortest 269
distance and direction (angle) between each new vegetation patch and the closest existing patch at 270
the beginning of each survey period were calculated using the ‘Near’ tool in ArcMap 10.4. 271
Statistical analyses 272
In the aerial photography, 22 replicate pairs of patches were considered. A chi-squared test was 273
used to test for significant differences in the frequency of observed longitudinal and transversal 274
distances between vegetation patches. In the field experiment, the statistical design was a fully 275
factorial design with transversal and longitudinal distances as the main factors, comprising ten 276
different configurations (treatments) each measured once. Regression analysis was used to test the 277
effects of varying longitudinal and transversal distances on depth-averaged and near-bed (5 and 278
10% of depth above the river bed) flow velocities in four different positions (between the patches, 279
at the upstream edge of patch D, next to patch U, next to patch D), and on turbulent kinetic energy 280
at the upstream edge of patch D. We tested whether relative flow velocities would increase linearly 281
with increasing inter-patch distances, or follow a quadratic relationship which might be expected if 282
relative flow velocities first increase until a maximum at intermediate distances, and then decrease 283
to 1 as they become equal to incoming flow velocity. In the latter case, patches become far enough 284
apart so that they cease to interact. Hence, we fitted both linear and quadratic models using single 285
13
Information Criterion to compare the adequacy of the candidate models, and selected the model 287
with the lowest AIC score (Akaike 1998). Regression analysis was used to test for the relationship 288
between flow velocities and drag forces on C. platycarpa in the field flume experiment. Ordinary 289
Least Square (OLS) regression was used for spatial regression between the experimental drag 290
measured around a vegetation patch, and the probability of naturally-observed patch occurrence. 291
The latter was first log-transformed (natural log of original value + 0.5) due to its skewed 292
distribution. A chi-squared test was used to test for significant differences in angle of growth 293
compared to a uniform distribution in all directions. A paired t-test was used to compare drag forces 294
measured on single plants to drag on plants located at the upstream edge of a vegetation patch. 295
Results
296Observed inter-patch distances between pairs of macrophytes 297
The analysis of aerial photographs from the Rhône River study reach revealed that naturally-298
occurring C. platycarpa stands display a non-random distribution relative to neighbouring patches 299
(Figure 1). We observed that the leading edge of the downstream patch was most frequently located 300
between one third and halfway along the length of the upstream patch (i.e., L = 0.3 – 0.5) (χ50 = 301
20.54, p = 0.008). This longitudinal separation distance was relatively constant, regardless of the 302
size and shape of the patches we analysed (width/length ratios ranged from 0.25 to 0.83). In the 303
transversal direction, the downstream patch was most frequently located at 80% of the width of the 304
upstream patch from the latter’s lateral edge (i.e. T = 0.8), hence partially overlapping with, and 305
14
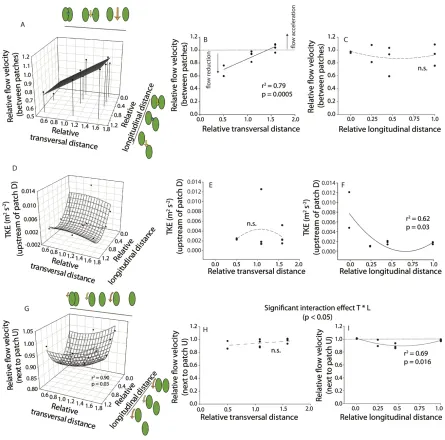
Effects of inter-patch distance on flow velocity and turbulence 307
Measurements of the hydrodynamic effects of different patch configurations in the Rhône River 308
study reach showed that depth-averaged flow velocity and turbulence patterns were strongly 309
affected by the distance between patches. In between the patches, flow velocity was strongly 310
reduced when the patches were partly overlapping (i.e. for T = 0.5 and L = 0.46), but it increased 311
when a clear separation developed between patches and flow was constricted. We found a 312
significant linear relationship between flow velocities in between the patches and the relative 313
transversal (T, spanwise) distance between the patches (F1, 8 = 31.45, r2 = 0.79, p < 0.001; Figure 3a 314
– c; Table 1). When the patches were close together, with no more than a 5 cm gap (T ≤ 1.08), flow 315
velocities between them were reduced and the pair tended to behave more like a single patch. 316
However, flow velocity accelerated when the gap between the patches, and therefore T, increased. 317
In particular, at T = 1.58, flow velocities between the two patches were higher than incoming 318
velocities due to flow constriction (Figure 3b). 319
We found that turbulence was minimized at intermediate distances along the length of an 320
upstream patch, while it increased both when the patches were next to each other and when one was 321
immediately downstream of the other. Turbulent kinetic energy upstream of the patch was 322
significantly related to relative longitudinal distance L through a quadratic relationship (F2, 7 = 323
5.719, r2 = 0.62, p = 0.03), the highest TKE occurred when patches were located next to each other 324
(for L = 0; Figure 3d – f). From L=0, TKE decreased with increased relative longitudinal distance 325
until a minimum at L = 0.66, after which it increased again for L > 0.66 as it entered the high TKE 326
region in the wake of the upstream patch. This minimum TKE at L = 0.66 seems to be the point at 327
which there was an optimal combination of sheltering from the oncoming flow by the upstream 328
15
upstream patch (which decreased with L). For the mean flow velocities upstream of patch D, results 330
of single and multiple regression showed no significant relationship with T and L distances (Table 331
1). 332
Areas of weakest flow deflection (i.e. reduced hydrodynamic forces) were found around the 333
upstream patch at intermediate longitudinal distances and, in particular, when the two patches were 334
partly overlapping. However, flow deflection increased both when the patches were next to each 335
other and when one was immediately downstream of the other. A significant non-linear (quadratic) 336
relationship was found between flow velocities next to patch U and both relative transversal (T) and 337
relative longitudinal (L) distances (F4, 5 = 7.931, r2 = 0.90, p = 0.03; Figure 3g – i; Table 1). As L 338
increased, flow velocity first decreased for intermediate distances (between 0.16 and 0.58), due to 339
weaker flow redirection around the patch. Then, it increased again to become equal to the incoming 340
flow velocity, following a quadratic relationship. As T increased, and therefore the gap between the 341
patches increased, the flow velocity increased until it was equal to the incoming flow velocity for T 342
≥ 1.5. However, flow velocities next to patch D showed no significant relationship with relative 343
transversal (T) and longitudinal (L) distances (Table 1). 344
Testing the relationship between patch distance and near-bed flow velocities revealed no 345
significant relationship between patch distances and velocities at 5% of the depth above the river 346
bed (Supporting Information, Table S1). A significant quadratic relationship between flow 347
velocities in between the patches and both relative transversal (T) and relative longitudinal (L) 348
distances was confirmed for flow measurements at 10% of the depth (Supporting Information, 349
Table S2). 350
16
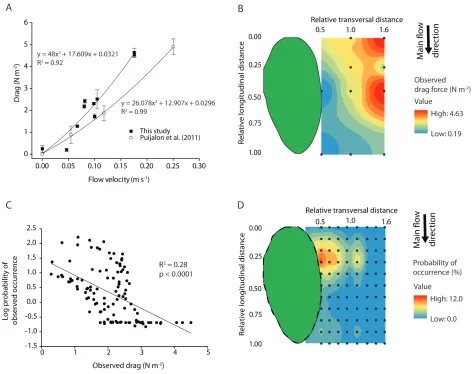
Existing vegetation patches appeared to create sheltered areas where drag was minimized, and new 352
patches were more likely to occur in these locations. Measurements of the drag force derived from 353
a plant’s particular location around an existing vegetation patch revealed a significant relationship 354
between flow velocity and drag force per unit surface area on C. platycarpa individuals (r2 = 0.92, 355
p = 0.0001; Figure 4a). As our field drag force measurements were in the same order of magnitude 356
as measurements performed on the same species in a laboratory flume (Puijalon et al. 2011), we 357
assert that the field set-up provided comparable and accurate measurements. Drag forces ranged 358
from 0.19 to 4.63 N m-2, due to the flow modification by the vegetation patch, with lowest drag 359
forces right along the lateral edge of the patch, at ≥ 0.55 m from the upstream edge. This distance 360
along the length of the patch corresponded to the end of the rooted area and the start of the floating 361
canopy, with the downstream patch forming an angle of 28° relative to the upstream patch. Plotting 362
the drag in an interpolated spatial grid around a patch shows that the most frequent locations of 363
neighbouring patches based on our field observations correspond to positions with intermediate to 364
low drag forces (Figure 4b and d). Furthermore, the probability of observed patch occurrence in a 365
certain position is inversely related to the observed drag force in that position (ordinary least 366
squares spatial regression, r2 = 0.28, p < 0.0001, Figure 4c). 367
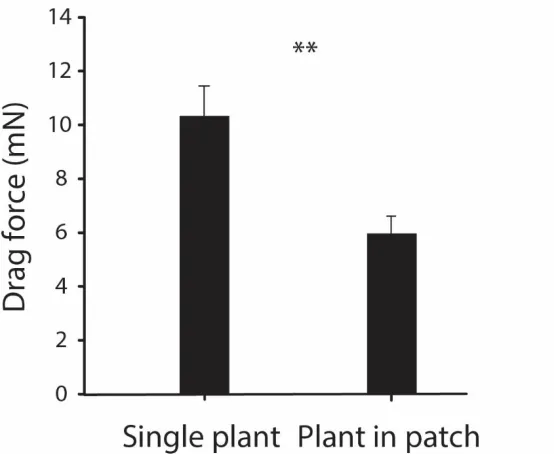
Comparison of average drag force measurements on single plants, representing the conditions 368
of initial establishment, compared to plants located at the upstream edge of a well-established patch 369
(n = 10 configurations) showed that C. platycarpa individuals experience significantly higher drag 370
when alone (Figure 5; paired t-test, t19 = - 2.28, p = 0.03). This observation shows that drag forces
371
on the upstream plants are mitigated by leaning onto other plants in a patch. 372
Effects of patch interactions on seasonal in-stream landscape adjustments: evidence from 373
17
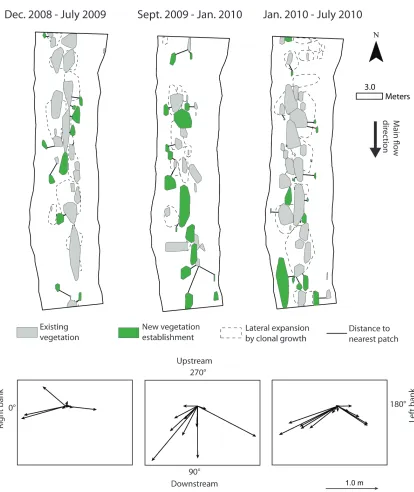
Field surveys over a two year period in the Frome-Piddle catchment (UK) showed that new 375
vegetation patches occurred at specific orientations from existing vegetation patches (χ70 = 9.20, p = 376
0.1 for Dec. 2008 – July 2009; χ70 = 12.80, p = 0.025 for Sept. 2009 – Jan. 2010; χ 7
0 = 10.88, p = 377
0.053 for Jan. 2010 – July 2010, and χ70 = 24.34, p < 0.001 for all survey periods together; Table 2). 378
Within each of the three time periods we analysed, the most common direction of growth was at 379
angles between 0 and 60° from existing patches (with a peak around 30°), in a downstream 380
direction towards the right bank with a second most common direction at angles between 120 and 381
180°, downstream towards the left bank (Figure 6; Table 2). The most common angles of growth 382
found through field surveys are consistent with the angle of 28° found through field measurements 383
and corresponding to a region where drag forces are the lowest (Figure 4). Overall, these 384
observations support the hypothesis that new patches occur in a slightly angled line with respect to 385
existing well-established patches, in locations with reduced hydrodynamic and drag forces (Figure 386
4). 387
The observed seasonal trends of in-stream vegetation growth and die-back were similar over 388
the two survey years in the Frome-Piddle catchment (Table 2; the corresponding changes in fine 389
sediment deposition within Ranunculus patches are reported in Davies, 2012). During both years, 390
Ranunculus reached its peak cover in the period May – July and began to decline shortly after (until 391
December), due to the seasonal dieback linked to increasing channel discharge and decreasing 392
daylengths and water temperatures. In September 2009, a particularly low Ranunculus cover was 393
observed (7%), likely related to the increase in autumn discharges. However, in-stream vegetation 394
started to recover from January onwards, when daylengths increased, with new Ranunculus patches 395
18
Discussion
397
While most studies of bio-geomorphic feedbacks have focused on isolated or already established 398
patches, our study examined the spatial configuration of patches and quantified where plant patches 399
occur in relation to one another. A key finding was that new vegetation patches in streams organize 400
themselves in V-like shapes during the establishment phase to reduce hydrodynamic and drag 401
forces. Field observations showed that patches are more likely to grow at the end of the rooted area 402
of the upstream patch, where its floating canopy starts (i.e., between one third and halfway down 403
the length of an upstream patch), and slightly off to its side (overlapping with part of their width). 404
Measurements in the field revealed that these locations correspond to areas where drag is reduced, 405
due to partial sheltering from high flow velocities and TKE by well-established vegetation patches. 406
Field manipulations supported this hypothesis, showing that mean flow velocity is reduced by 407
partially overlapping with upstream patches in the across-stream direction, and turbulence is 408
minimized when growing halfway down the length of an upstream patch in the main flow direction. 409
Flow deflection around the upstream patch is weakest when a partial V-shape is formed, suggesting 410
that additional secondary patch growth can occur on the other side of the V. These patterns of patch 411
alignment in formation resemble the formation adopted by migratory birds (Portugal et al. 2014), or 412
the drag-reducing queue formations in spiny lobsters (Bill and Herrnkind 1976). This provides 413
evidence of the role that bio-physical interactions have in shaping the way organisms position 414
themselves spatially in landscapes, in both air- and water flow, across a range of scales. 415
Facilitative interactions within the landscape of a self-organized species
416
The positive and negative feedbacks underlying the formation of self-organized patterns have been 417
identified for a wide range of ecosystems (Rietkerk et al. 2002; van de Koppel et al. 2005; Larsen et 418
19
velocities within patches is linked to a negative feedback limiting lateral growth (Bouma et al. 420
2009; Schoelynck et al. 2012). However, while positive feedbacks are generally observed at a small 421
scale within a patch (Rietkerk and Van de Koppel 2008), knowledge of the larger-scale facilitation 422
of seedling or fragment establishment by a self-organized species is limited. Our study provides a 423
first indication of establishment mechanisms operating at this larger, between-patch scale. We show 424
how an existing vegetation patch modifies flow velocities and resulting drag forces in its 425
surroundings thereby leading to positive or negative effects on the occurrence of other patches, 426
operating at a distance. Facilitative interactions within the same self-organized species, and over 427
larger scales, might therefore be an important but overlooked process determining the evolution of 428
spatial patterns over time. 429
The spacing of the vegetation patches resembles the organized spatial configurations 430
observed in other organisms. For instance, migratory birds maximize the upward motion of air from 431
the bird ahead and reduce drag due to air resistance (Lissaman and Shollenberger 1970; 432
Weimerskirch et al. 2001; Portugal et al. 2014), and fish schools adopt different spatial 433
configurations that can lead to reduced energy expenditure (Ashraf et al. 2017). Our temporal 434
observations showed preferential patch occurrence at 0 to 60° angles from existing patches, with a 435
peak around 30°. This angle is consistent with the 28° angle at which drag on the downstream patch 436
was minimized in the field manipulation. However, the regions of minimum drag force did not 437
strictly correspond to the most frequent location of patch occurrence. This discrepancy could be due 438
to the low number of drag measurement points in that location, or to processes occurring during 439
patch development (e.g. erosion of the upstream patch front and downstream displacement of 440
patches (Sand-Jensen and Vindbœk Madsen 1992), nutrient availability, etc.). The observed 441
20
availability. For submerged aquatic plants, the position immediately in the wake of another patch 443
could seem equally or even more beneficial in terms of drag reduction. However, the V position 444
might be a hydrodynamic optimum to maximize drag reduction while still ensuring exposure to 445
light and delivery of nutrients by water flow. Flume experiments on nitrogen uptake showed that 446
ammonium uptake rates for Callitriche increased when the patch was located at a leading edge, 447
where it was exposed to higher mean velocity (Cornacchia et al. 2018a). Instead, Callitriche had 448
very low ammonium uptake rates when it was immediately downstream of another patch and 449
exposed to low mean velocities. This finding suggests that partial, rather than complete, sheltering 450
by established vegetation can allow more nutrients to be delivered to the downstream patch. 451
Similarly, in mussel beds, aggregation at high densities provides the advantage of protection from 452
physical forces, but also increases competition for food (van de Koppel et al. 2005; De Paoli 2017). 453
Therefore, the balance between reducing stress and maintaining resource availability might be an 454
important factor influencing patch distributions in different self-organized systems. Further 455
measurements of hydrodynamics and nutrient uptake, and/or numerical modelling studies are 456
required to investigate the physical explanation for these patterns such as the V formation. 457
The consistency between the neighbouring patch distances observed for Callitriche
458
platycarpa and Ranunculus penicillatus suggest that such V-shaped settlement might be typical for 459
lotic aquatic environments. Thus, it might be a general process for submerged aquatic vegetation in 460
running waters, at least for species with similar morphologies and experiencing comparable drag 461
forces (Bal et al. 2011). However, vegetation distributions can be more complex than the 462
streamlined, V-shaped patterns described here. Moderate flow velocities and uni-directional flows 463
tend to create a streamlined patch distribution, whereas a near-homogeneous plant cover would 464
21
Moreover, a model accounting for interactions between neighbouring patches of emergent 466
vegetation found that wake interactions and resulting deposition patterns influence secondary patch 467
growth (De Lima et al. 2015), yielding complex distributions and not necessarily recognizable V-468
shapes. More complex patterns in vegetation growth have also been observed in a stream with a 469
rich abundance of aquatic plant species (Cameron et al. 2013). Plant traits could also influence the 470
occurrence of recognizable V-shaped patterns. For instance, a V pattern might not be expected for 471
species showing high resistance to hydrodynamic forces (Puijalon et al. 2011), high root anchorage 472
strength (Schutten et al. 2005; Gurnell et al. 2013; Liffen et al. 2013), or relying less on areas of 473
low velocity and fine sediment deposition for their establishment and growth. Our observations 474
were not able to provide evidence of this distribution pattern in other species, which were not as 475
abundant in our field sites. Further studies are necessary to test if a clear dominant species is needed 476
to achieve this configuration, and how the presence of other species might affect the patterns and 477
spacing between patches. 478
The patches in our experiment were constructed on an array of 9408 holes per m2. As a non-479
dimensional measure of canopy density (Nepf, 2012), Callitriche patches have a frontal area per 480
bed area ah = 0.200 ± 0.035 at the incoming flow velocity of 0.24 m s-1 (Cornacchia et al. 2018a). 481
This density value is similar to other studies. Bouma et al. (2007) created patches with ah = 0.64. In 482
Zong and Nepf (2011), ah ranged from 0.48 to 2.52. These values fall in the dense canopy regime 483
described in Nepf (2012), corresponding to ah > 0.1. Therefore, the hydrodynamic patterns 484
presented in this study can generally be expected in other ecosystems with flexible submerged 485
species under dense canopy conditions and presenting similar patch structure (i.e. overhanging 486
canopies). 487
Initial patterns control future pattern formation: implications for ecosystem resilience
22
Our results on the role of patchiness on vegetation distribution suggest that initial vegetation 489
patterns determine where future patches occur. This creates patterns at multiple spatial scales: a 490
patch-patch scale during initial establishment, which over time leads to a pseudo-braided pattern in 491
the organization of mature patches at the reach scale, with vegetated bands separated by 492
unvegetated channels. These patterns likely develop on two different time scales. On the scale of 493
generally 1 to 10 days, primary colonization by individual shoots relies on successful root 494
development (Barrat-Segretain et al. (1998); Barrat-Segretain et al. (1999)), which allows them to 495
withstand scouring or dislodgement due to currents and drag (as in our field manipulation). After 496
primary colonization, single shoots develop into patches through clonal growth over the course of 497
months, based on our monitoring data and literature studies (Cotton et al. 2006; Wharton et al. 498
2006). Therefore, the complex self-organized patterning of stream macrophytes likely results from 499
processes interacting at different spatial and temporal scales. 500
Pattern formation at multiple scales, both spatial and temporal, has also been found to 501
increase resilience in mussel beds which are another self-organized ecosystem (Liu et al. 2014). 502
Similar to macrophytes, mussel aggregation into clumps improves their growth and offers 503
protection against hydrodynamic forces (Van de Koppel et al. 2008). Thus, the presence of a few 504
initial patches can facilitate the establishment of new patches. It might promote faster recovery 505
following disturbance events such as floods by creating a self-reinforcing state that increases the 506
resilience of lotic ecosystems. The sheltering effect presumably strengthens as the number of 507
patches increases, eventually developing into near-full vegetation cover (cf. Van der Wal et al. 508
(2008) for Spartina tussocks growing into a fully vegetated salt marsh). In regularly disturbed 509
ecosystems, where the hydrologic regime and flow variability are among the primary factors 510
23
crucially important for vegetation recovery (Barrat-Segretain et al. 1998; Barrat-Segretain et al. 512
1999; Riis 2008).Our study suggests the general role of bio-physical interactions in shaping how 513
organisms align themselves to hydrodynamic flows in different landscapes and across multiple 514
spatial scales. 515
Acknowledgments
516This work was supported by the Research Executive Agency, through the 7th Framework 517
Programme of the European Union, Support for Training and Career Development of Researchers 518
(Marie Curie - FP7-PEOPLE-2012-ITN), which funded the Initial Training Network (ITN) 519
HYTECH ‘Hydrodynamic Transport in Ecologically Critical Heterogeneous Interfaces’, N.316546. 520
Data collection in the Frome-Piddle catchment, Dorset, was supported by the Natural Environment 521
Research Council (algorithm studentship awarded to Grieg Davies) and Queen Mary University of 522
London (through a College studentship awarded to Bob Grabowski). 523
References
524Adhitya, A., T. Bouma, A. Folkard, M. van Katwijk, D. Callaghan, H. de Iongh, and P. Herman. 525
2014. Comparison of the influence of patch-scale and meadow-scale characteristics on flow 526
within seagrass meadows: a flume study. Marine Ecology Progress Series 516: 49-59. 527
Akaike, H. 1998. Information theory and an extension of the maximum likelihood principle, p. 199-528
213. Selected Papers of Hirotugu Akaike. Springer. 529
Ashraf, I., H. Bradshaw, T.-T. Ha, J. Halloy, R. Godoy-Diana, and B. Thiria. 2017. Simple phalanx 530
pattern leads to energy saving in cohesive fish schooling. Proceedings of the National 531
24
Bal, K. D., T. J. Bouma, K. Buis, E. Struyf, S. Jonas, H. Backx, and P. Meire. 2011. Trade-off between 533
drag reduction and light interception of macrophytes: comparing five aquatic plants with 534
contrasting morphology. Functional Ecology 25: 1197-1205. 535
Balke, T., T. J. Bouma, E. M. Horstman, E. L. Webb, P. L. Erftemeijer, and P. M. Herman. 2011. 536
Windows of opportunity: thresholds to mangrove seedling establishment on tidal flats. 537
Marine Ecology Progress Series 440: 1-9. 538
Balke, T., P. M. Herman, and T. J. Bouma. 2014. Critical transitions in disturbance-driven 539
ecosystems: identifying Windows of Opportunity for recovery. Journal of Ecology 102: 700-540
708. 541
Barrat-Segretain, M.-H., G. Bornette, and A. Hering-Vilas-Bôas. 1998. Comparative abilities of 542
vegetative regeneration among aquatic plants growing in disturbed habitats. Aquatic Botany 543
60: 201-211. 544
Barrat-Segretain, M.-H., C. P. Henry, and G. Bornette. 1999. Regeneration and colonization of 545
aquatic plant fragments in relation to the disturbance frequency of their habitats. Archiv für 546
Hydrobiologie 145: 111-127. 547
Bertoldi, W., M. Welber, A. Gurnell, L. Mao, F. Comiti, and M. Tal. 2015. Physical modelling of the 548
combined effect of vegetation and wood on river morphology. Geomorphology 246: 178-549
187. 550
Bill, R. G., and W. F. Herrnkind. 1976. Drag reduction by formation movement in spiny lobsters. 551
Science 193: 1146-1148. 552
Bouma, T., M. De Vries, E. Low, G. Peralta, I. Tánczos, J. van de Koppel, and P. J. Herman. 2005. 553
Trade-offs related to ecosystem engineering: A case study on stiffness of emerging 554
25
Bouma, T., M. Friedrichs, B. Van Wesenbeeck, S. Temmerman, G. Graf, and P. Herman. 2009. 556
Density-dependent linkage of scale-dependent feedbacks: A flume study on the intertidal 557
macrophyte Spartina anglica. Oikos 118: 260-268. 558
Bouma, T., L. Van Duren, S. Temmerman, T. Claverie, A. Blanco-Garcia, T. Ysebaert, and P. Herman. 559
2007. Spatial flow and sedimentation patterns within patches of epibenthic structures: 560
Combining field, flume and modelling experiments. Continental Shelf Research 27: 1020-561
1045. 562
Bruno, J. F., and C. W. Kennedy. 2000. Patch-size dependent habitat modification and facilitation on 563
New England cobble beaches by Spartina alterniflora. Oecologia 122: 98-108. 564
Bruno, J. F., J. J. Stachowicz, and M. D. Bertness. 2003. Inclusion of facilitation into ecological 565
theory. Trends in Ecology & Evolution 18: 119-125. 566
Callaway, R. M. 2007. Direct Mechanisms for Facilitation, p. 15-116. Positive Interactions and 567
Interdependence in Plant Communities. Springer Netherlands. 568
Cameron, S. M., V. I. Nikora, I. Albayrak, O. Miler, M. Stewart, and F. Siniscalchi. 2013. Interactions 569
between aquatic plants and turbulent flow: a field study using stereoscopic PIV. Journal of 570
Fluid Mechanics 732: 345-372. 571
Chen, Z., C. Jiang, and H. Nepf. 2013. Flow adjustment at the leading edge of a submerged aquatic 572
canopy. Water Resources Research 49: 5537-5551. 573
Chen, Z., A. Ortiz, L. Zong, and H. Nepf. 2012. The wake structure behind a porous obstruction and 574
its implications for deposition near a finite patch of emergent vegetation. Water Resources 575
Research 48: W09517. 576
Corenblit, D., A. Baas, T. Balke, T. Bouma, F. Fromard, V. Garófano-Gómez, E. González, A. M. 577
26
geomorphic constraints similarly along water–terrestrial interfaces world-wide. Global 579
Ecology and Biogeography 24: 1363-1376. 580
Corenblit, D., E. Tabacchi, J. Steiger, and A. M. Gurnell. 2007. Reciprocal interactions and 581
adjustments between fluvial landforms and vegetation dynamics in river corridors: a review 582
of complementary approaches. Earth-Science Reviews 84: 56-86. 583
Cornacchia, L., S. Licci, H. Nepf, A. Folkard, D. van der Wal, J. van de Koppel, S. Puijalon, and T. 584
Bouma. 2018a. Turbulence-mediated facilitation of resource uptake in patchy stream 585
macrophytes. Limnology and Oceanography: doi:10.1002/lno.11070. 586
Cornacchia, L., J. Van De Koppel, D. Van Der Wal, G. Wharton, S. Puijalon, and T. J. Bouma. 2018b. 587
Landscapes of facilitation: how self-organized patchiness of aquatic macrophytes promotes 588
diversity in streams. Ecology 99: 832-847. 589
Cotton, J., G. Wharton, J. Bass, C. Heppell, and R. Wotton. 2006. The effects of seasonal changes to 590
in-stream vegetation cover on patterns of flow and accumulation of sediment. 591
Geomorphology 77: 320-334. 592
Davies, G. R. 2012. The transport and retention of fine sediments in seasonally vegetated lowland 593
streams. Queen Mary University of London. 594
Dawson, F. 1976. The annual production of the aquatic macrophyte Ranunculus penicillatus var. 595
calcareus (RW Butcher) C.D.K. Cook. Aquatic Botany 2: 51-73. 596
---. 1989. Ecology and management of water plants in lowland streams. In: Fifty-seventh annual 597
report for the year ended 31st March 1989. Ambleside, UK, Freshwater Biological 598
Association, pp. 43-60. (Annual Report, Freshwater Biological Association, Ambleside). 599
De Lima, P. H., J. G. Janzen, and H. M. Nepf. 2015. Flow patterns around two neighboring patches 600
of emergent vegetation and possible implications for deposition and vegetation growth. 601
27
De Paoli, H. 2017. Restoring mussel beds: A guide on how to survive on an intertidal mudflat. 603
University of Groningen. 604
Folkard, A. M. 2005. Hydrodynamics of model Posidonia oceanica patches in shallow water. 605
Limnology and Oceanography 50: 1592-1600. 606
---. 2011. Flow regimes in gaps within stands of flexible vegetation: laboratory flume simulations. 607
Environmental Fluid Mechanics 11: 289-306. 608
Fonseca, M. S., and S. S. Bell. 1998. Influence of physical setting on seagrass landscapes near 609
Beaufort, North Carolina, USA. Marine Ecology Progress Series: 109-121. 610
Grabowski, R. C., and A. Gurnell. 2016. Hydrogeomorphology—Ecology interactions in river 611
systems. River Research and Applications 32: 139-141. 612
Gurnell, A. 2014. Plants as river system engineers. Earth Surface Processes and Landforms 39: 4-25. 613
Gurnell, A., and R. Grabowski. 2016. Vegetation–hydrogeomorphology interactions in a low-energy, 614
human-impacted river. River Research and Applications 32: 202-215. 615
Gurnell, A. M., M. T. O’Hare, J. M. O’Hare, P. Scarlett, and T. M. Liffen. 2013. The 616
geomorphological context and impact of the linear emergent macrophyte, Sparganium 617
erectum L.: a statistical analysis of observations from British rivers. Earth Surface Processes 618
and Landforms 38: 1869-1880. 619
Haslam, S. M. 1978. River plants: the macrophyte vegetation of watercourses. Cambridge Univer. 620
Press. Cambridge. 621
Hendriks, I. E., T. Sintes, T. J. Bouma, and C. M. Duarte. 2008. Experimental assessment and 622
modeling evaluation of the effects of the seagrass Posidonia oceanica on flow and particle 623
trapping. Marine Ecology Progress Series. 624
Jaffe, M., and S. Forbes. 1993. Thigmomorphogenesis: the effect of mechanical perturbation on 625
28
Jones, C. G., J. H. Lawton, and M. Shachak. 1994. Organisms as ecosystem engineers, p. 130-147. 627
Ecosystem management. Springer. 628
Kearney, W. S., and S. Fagherazzi. 2016. Salt marsh vegetation promotes efficient tidal channel 629
networks. Nature Communications 7. 630
Kondziolka, J. M., and H. M. Nepf. 2014. Vegetation wakes and wake interaction shaping aquatic 631
landscape evolution. Limnology and Oceanography: Fluids and Environments 4: 106-119. 632
Kouwen, N., and T. E. Unny. 1973. Flexible roughness in open channels. Journal of the Hydraulics 633
Division 99. 634
Larsen, L. G., J. W. Harvey, and J. P. Crimaldi. 2007. A delicate balance: ecohydrological feedbacks 635
governing landscape morphology in a lotic peatland. Ecological monographs 77: 591-614. 636
Leonard, L. A., and M. E. Luther. 1995. Flow hydrodynamics in tidal marsh canopies. Limnology 637
and Oceanography 40: 1474-1484. 638
Liffen, T., A. Gurnell, and M. O’Hare. 2013. Profiling the below ground biomass of an emergent 639
macrophyte using an adapted ingrowth core method. Aquatic botany 110: 97-102. 640
Lissaman, P., and C. A. Shollenberger. 1970. Formation flight of birds. Science 168: 1003-1005. 641
Liu, Q.-X., P. M. Herman, W. M. Mooij, J. Huisman, M. Scheffer, H. Olff, and J. Van De Koppel. 642
2014. Pattern formation at multiple spatial scales drives the resilience of mussel bed 643
ecosystems. Nature Communications 5. 644
Madsen, J. D., P. A. Chambers, W. F. James, E. W. Koch, and D. F. Westlake. 2001. The interaction 645
between water movement, sediment dynamics and submersed macrophytes. Hydrobiologia 646
444: 71-84. 647
Marjoribanks, T. I., R. J. Hardy, S. N. Lane, and M. J. Tancock. 2017. Patch-scale representation of 648
29
Meire, D. W., J. M. Kondziolka, and H. M. Nepf. 2014. Interaction between neighboring vegetation 650
patches: Impact on flow and deposition. Water Resources Research 50: 3809-3825. 651
Murray, A., M. Knaapen, M. Tal, and M. Kirwan. 2008. Biomorphodynamics: Physical-biological 652
feedbacks that shape landscapes. Water Resources Research 44: W11301. 653
Nepf, H., and E. Vivoni. 2000. Flow structure in depth-limited, vegetated flow. Journal of 654
Geophysical Research: Oceans 105: 28547-28557. 655
Nepf, H. M. 2012. Flow and transport in regions with aquatic vegetation. Annual Review of Fluid 656
Mechanics 44: 123-142. 657
Portugal, S. J., T. Y. Hubel, J. Fritz, S. Heese, D. Trobe, B. Voelkl, S. Hailes, A. M. Wilson, and J. R. 658
Usherwood. 2014. Upwash exploitation and downwash avoidance by flap phasing in ibis 659
formation flight. Nature 505: 399-402. 660
Puijalon, S., T. J. Bouma, C. J. Douady, J. van Groenendael, N. P. Anten, E. Martel, and G. Bornette. 661
2011. Plant resistance to mechanical stress: evidence of an avoidance–tolerance trade-off. 662
New Phytologist 191: 1141-1149. 663
Puijalon, S., J. P. Léna, N. Rivière, J. Y. Champagne, J. C. Rostan, and G. Bornette. 2008. Phenotypic 664
plasticity in response to mechanical stress: hydrodynamic performance and fitness of four 665
aquatic plant species. New Phytologist 177: 907-917. 666
Rietkerk, M., M. C. Boerlijst, F. van Langevelde, R. HilleRisLambers, J. v. de Koppel, L. Kumar, H. 667
H. Prins, and A. M. de Roos. 2002. Self-organization of vegetation in arid ecosystems. The 668
American Naturalist 160: 524-530. 669
Rietkerk, M., and J. Van de Koppel. 2008. Regular pattern formation in real ecosystems. Trends in 670
ecology & evolution 23: 169-175. 671
Riis, T. 2008. Dispersal and colonisation of plants in lowland streams: success rates and bottlenecks. 672
30
Riis, T., and B. J. Biggs. 2003. Hydrologic and hydraulic control of macrophyte establishment and 674
performance in streams. Limnology and oceanography 48: 1488-1497. 675
Sand-Jensen, K. 1998. Influence of submerged macrophytes on sediment composition and near-bed 676
flow in lowland streams. Freshwater Biology 39: 663-679. 677
Sand-Jensen, K., and J. R. Mebus. 1996. Fine-scale patterns of water velocity within macrophyte 678
patches in streams. Oikos 76: 169-180. 679
Sand-Jensen, K., and T. Vindbœk Madsen. 1992. Patch dynamics of the stream macrophyte, 680
Callitriche cophocarpa. Freshwater Biology 27: 277-282. 681
Sand-Jensen, K., K. Andersen, and T. Andersen. 1999. Dynamic properties of recruitment, expansion 682
and mortality of macrophyte patches in streams. International Review of Hydrobiology 84: 683
497-508. 684
Schoelynck, J., T. De Groote, K. Bal, W. Vandenbruwaene, P. Meire, and S. Temmerman. 2012. Self-685
organised patchiness and scale-dependent bio-geomorphic feedbacks in aquatic river 686
vegetation. Ecography 35: 760-768. 687
Schutten, J., J. Dainty, and A. Davy. 2005. Root anchorage and its significance for submerged plants 688
in shallow lakes. Journal of Ecology 93: 556-571. 689
Tal, M., and C. Paola. 2007. Dynamic single-thread channels maintained by the interaction of flow 690
and vegetation. Geology 35: 347-350. 691
Temmerman, S., T. Bouma, J. Van de Koppel, D. Van der Wal, M. De Vries, and P. Herman. 2007. 692
Vegetation causes channel erosion in a tidal landscape. Geology 35: 631-634. 693
Van de Koppel, J., J. C. Gascoigne, G. Theraulaz, M. Rietkerk, W. M. Mooij, and P. M. Herman. 694
2008. Experimental evidence for spatial self-organization and its emergent effects in mussel 695
31
van de Koppel, J., M. Rietkerk, N. Dankers, and P. M. Herman. 2005. Scale-dependent feedback and 697
regular spatial patterns in young mussel beds. The American Naturalist 165: E66-E77. 698
Van der Wal, D., A. Wielemaker-Van den Dool, and P. M. Herman. 2008. Spatial patterns, rates and 699
mechanisms of saltmarsh cycles (Westerschelde, The Netherlands). Estuarine, Coastal and 700
Shelf Science 76: 357-368. 701
van Wesenbeeck, B. K., J. Van De Koppel, P. MJ Herman, and T. J Bouma. 2008. Does scale-702
dependent feedback explain spatial complexity in salt-marsh ecosystems? Oikos 117: 152-703
159. 704
Vandenbruwaene, W., S. Temmerman, T. Bouma, P. Klaassen, M. De Vries, D. Callaghan, P. Van 705
Steeg, F. Dekker, L. Van Duren, and E. Martini. 2011. Flow interaction with dynamic 706
vegetation patches: Implications for biogeomorphic evolution of a tidal landscape. Journal 707
of Geophysical Research: Earth Surface 116. 708
Weimerskirch, H., J. Martin, Y. Clerquin, P. Alexandre, and S. Jiraskova. 2001. Energy saving in 709
flight formation. Nature 413: 697-698. 710
Wharton, G., J. A. Cotton, R. S. Wotton, J. A. Bass, C. M. Heppell, M. Trimmer, I. A. Sanders, and 711
L. L. Warren. 2006. Macrophytes and suspension-feeding invertebrates modify flows and 712
fine sediments in the Frome and Piddle catchments, Dorset (UK). Journal of Hydrology 330: 713
171-184. 714
Zong, L., and H. Nepf. 2011. Spatial distribution of deposition within a patch of vegetation. Water 715
Resources Research 47: W03516. 716
---. 2012. Vortex development behind a finite porous obstruction in a channel. Journal of Fluid 717
33
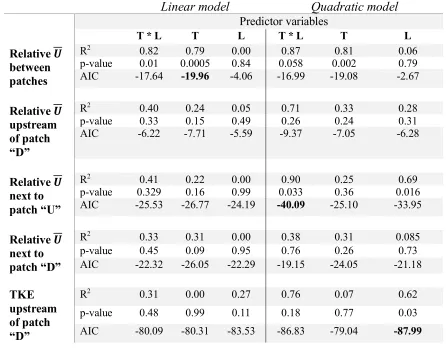
Table 1 Regression results of linear and quadratic models including single (T, L) or multiple (T and 720
L) predictor variables. Final selected models (in bold) are based on Akaike Information Criterion 721
(AIC) values. 722
Linear model Quadratic model
Predictor variables
T * L T L T * L T L
Relative 𝑼 between patches
R2 0.82 0.79 0.00 0.87 0.81 0.06
p-value 0.01 0.0005 0.84 0.058 0.002 0.79 AIC -17.64 -19.96 -4.06 -16.99 -19.08 -2.67
Relative 𝑼 upstream of patch “D”
R2 0.40 0.24 0.05 0.71 0.33 0.28
p-value 0.33 0.15 0.49 0.26 0.24 0.31
AIC -6.22 -7.71 -5.59 -9.37 -7.05 -6.28
Relative 𝑼 next to patch “U”
R2 0.41 0.22 0.00 0.90 0.25 0.69
p-value 0.329 0.16 0.99 0.033 0.36 0.016 AIC -25.53 -26.77 -24.19 -40.09 -25.10 -33.95
Relative 𝑼 next to patch “D”
R2 0.33 0.31 0.00 0.38 0.31 0.085
p-value 0.45 0.09 0.95 0.76 0.26 0.73
AIC -22.32 -26.05 -22.29 -19.15 -24.05 -21.18
TKE upstream of patch “D”
R2 0.31 0.00 0.27 0.76 0.07 0.62
p-value 0.48 0.99 0.11 0.18 0.77 0.03
AIC -80.09 -80.31 -83.53 -86.83 -79.04 -87.99
723
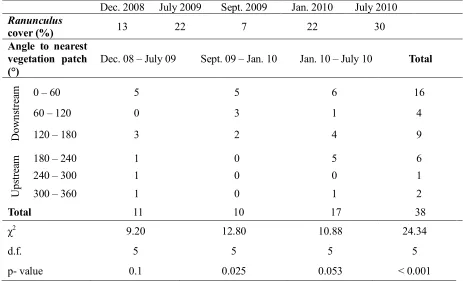
34
Table 2 Changes in Ranunculus in-stream vegetation cover (%) and direction of growth of newly 725
occurring vegetation patches with respect to the nearest existing vegetation patch (°), based on field 726
observations in the Frome-Piddle catchment (UK), performed over three different time periods 727
covering the annual growth cycle. Observations were of the dominant species Ranunculus
728
penicillatus subsp. pseudofluitans. 729
Dec. 2008 July 2009 Sept. 2009 Jan. 2010 July 2010
Ranunculus
cover (%) 13 22 7 22 30
Angle to nearest vegetation patch (°)
Dec. 08 – July 09 Sept. 09 – Jan. 10 Jan. 10 – July 10 Total
D
ow
ns
tr
ea
m 0 – 60 5 5 6 16
60 – 120 0 3 1 4
120 – 180 3 2 4 9
U
ps
tr
ea
m 180 – 240 1 0 5 6
240 – 300 1 0 0 1
300 – 360 1 0 1 2
Total 11 10 17 38
χ2 9.20 12.80 10.88 24.34
d.f. 5 5 5 5
p- value 0.1 0.025 0.053 < 0.001
35 Figures
731
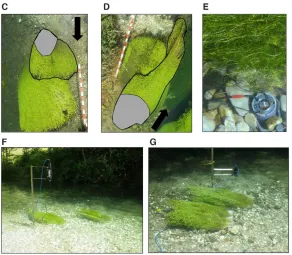
[image:35.612.119.411.413.668.2]732
Figure 1 Frequency distribution of A) observed relative longitudinal inter-patch distance (distance 733
36
distance (transversal gap between leftmost edges divided by upstream patch width) of neighbouring 735
patches of Callitriche platycarpa. The aerial pictures show macrophyte patch pairs (C, D) growing 736
in a staggered distribution, with overlapping canopies. The canopy of the upstream patch is outlined 737
in black. Grey areas indicate the extent of the rooted area. Arrows indicate main river flow 738
direction. E shows the force transducer employed in the field for drag measurements on 739
macrophytes. F and G illustrate the experimental setup in the field with the transplanted vegetation 740
37 742
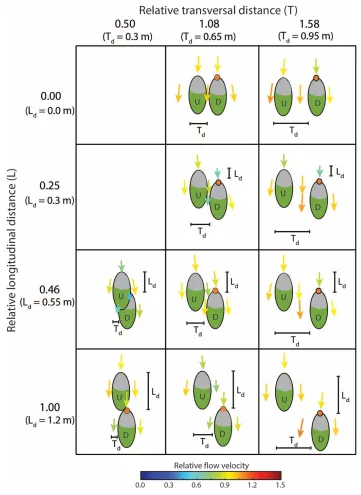
Figure 2 Overview of the ten patch configurations used in the field experiments, with indication of 743
inter-patch distance in the longitudinal and transversal directions. L and T are relative distances; Td 744
and Ld are absolute distances (in m). Patch “U” was kept fixed, while patch “D” was moved 745
downstream and/or laterally. Arrows indicate flow direction, and arrow size and colour indicate 746
velocity magnitude relative to a measurement point located 0.5 m upstream of patch U. Grey areas 747
38 749
Figure 3 Relative flow velocity measurements (flow velocity relative to incoming flow) in between 750
the patches (A, B, C) and on the side of patch U (G, H, I) for the ten configurations, showing the 751
effects of increasing relative longitudinal and transversal distances. (D, E, F) Relationship between 752
relative longitudinal and transversal distances and turbulent kinetic energy (TKE, m2 s-2) at the 753
upstream edge of patch D. Green ovals are illustrations of the two neighbouring patches and their 754
relative separation distances on the axes. Arrow size and colour indicate flow velocity magnitude, 755