The Effects of Age and Noise Exposure on Proxy Measures of Cochlear Synaptopathy
Garreth Prendergasta,*, Samuel Coutha,, Rebecca E. Millmana,b, Hannah Guesta, Karolina Kluka,b, Kevin J. Munroa,b, Christopher J. Placka,b,c.
a, Manchester Centre for Audiology and Deafness, University of Manchester, Manchester Academic Health Science Centre, M13 9PL, UK.
b, NIHR Manchester Biomedical Research Centre, Central Manchester University Hospitals NHS Foundation Trust, Manchester Academic Health Science Centre, Manchester, M13 9WL, UK.
c, Department of Psychology, Lancaster University, Lancaster, LA1 4YF, UK.
Abstract
Although there is strong histological evidence for age-related synaptopathy in humans, evidence for the existence of noise-induced cochlear synaptopathy in humans is
inconclusive. Here we sought to evaluate the relative contributions of age and noise exposure to cochlear synaptopathy using a series of electrophysiological and behavioral measures. We extended an existing cohort by including 33 adults in the age range 37-60, resulting in a total of 156 participants, with the additional older participants resulting in a weakening of the correlation between lifetime noise exposure and age. We used six
independent regression models (corrected for multiple comparisons), in which age, lifetime noise exposure and high-frequency audiometric thresholds were used to predict measures of synaptopathy, with a focus on differential measures. The models for auditory brainstem responses, envelope-following responses, interaural phase discrimination and the co-ordinate response measure of speech perception were not statistically significant.
Keywords
Cochlear synaptopathy Hidden hearing loss
Noise-induced hearing loss Speech-in-noise
Introduction
In a seminal study, Kujawa and Liberman (2009) described the phenomenon now known as cochlear synaptopathy. Mice were exposed to 100 dB SPL noise (8-16 kHz) for 2 hours and it was subsequently found that up to 50% of synapses between inner hair cells and auditory nerve fibers were destroyed. This loss of synapses left absolute thresholds unaffected, but was associated with a reduced wave I of the supra-threshold auditory brainstem response (ABR) by 60% at 32 kHz and ~30% at 12 kHz. Noise-induced
synaptopathy has since been demonstrated in several rodent species (Hickox et al., 2017), and in a primate (macaque) model, although the noise levels required were higher, and the synapse loss lower, in the macaque compared to the mouse model (Valero et al., 2017). Furman et al. (2013) provided evidence from single-unit recordings that the synapses with high-threshold, low- and medium-spontaneous-rate (SR) fibers were preferentially
damaged during the process of noise-induced cochlear synaptopathy. This led to the “low-SR hypothesis” which suggests that the loss of synapses affects suprathreshold coding with minimal changes in responses close to threshold. Despite strong initial evidence in support of this hypothesis in animal models, there now exist a number of empirical findings which do not concord with this account of synaptopathy. In particular, Bourien et al (2014) showed that low-SR fibers contribute little to the compound action potential (equivalent to ABR wave I) in the gerbil. Hickox et al. (2017) provide a thorough overview of the different animal models, the exposures used, evidence found in support of the low-SR hypothesis and those findings which are difficult to reconcile with this hypothesis.
groups of high and low noise exposure were imbalanced with regards to sex, and men tend to have smaller absolute amplitudes (Jerger and Hall, 1980) and more noise
exposure than women. On reanalysis, a significant correlation was only found for women (Stamper and Johnson 2015b). Bramhall et al. (2017) found that groups of highly noise-exposed veterans and non-veterans who use firearms have weaker ABR wave I
amplitudes than a group of non-firearm users and a group of low noise-exposed veterans. Liberman et al. (2016) reported no difference in wave I amplitude between groups of high- and low-noise-exposed listeners with clinically normal audiometric thresholds, but a large increase in the ratio of summating potential (SP) relative to the action potential (AP) in the high-risk group, driven largely by an increase in the SP. This ratio measure is proposed as a reliable measure of cochlear synaptopathy, although it remains unclear exactly how a loss of cochlear synapses would lead to an increase in the SP. In addition, the high-risk group had elevated audiometric thresholds at frequencies above 8 kHz, and it is unknown how the differences between the high-frequency hearing of the two groups might have affected the potentials. Liberman et al. (2016) also reported a deficit in speech-in-noise performance in the high-risk group at low sound levels (35 dB HL).
Grose et al. (2017) reported a reduction in another differential measure, the ABR wave I/V ratio, in listeners who attended loud music events, although the authors found no
behavioral effects related to this reduction. Valderrama et al. (2018) found a statistically significant reduction in ABR amplitude with increasing lifetime noise exposure in a group of listeners aged 29-55. These listeners had a mix of hearing profiles and the degree of audiometric loss was not controlled for in the analyses. Although these two studies report evidence consistent with noise-induced cochlear synaptopathy in humans, the effect sizes were small, and neither significant finding would survive correction for multiple
In contrast, a larger number of studies have found no evidence for a relation between noise exposure and electrophysiological responses (Spankovich et al., 2017; Grinn et al., 2017, Fullbright et al., 2017; Prendergast et al. 2017a; 2018; Guest et al., 2017; Smith et al., 2019), or between noise exposure and behavioral performance (Prendergast et al., 2017b; Fullbright et al., 2017; Grose et al., 2017; Yeend et al., 2017; Smith et al., 2019, Johannesen et al., 2019), in cohorts of young adults with clinically normal audiograms. These cohorts differ in their demographics and in how noise exposure is quantified. It seems clear that, even if noise-induced cochlear synaptopathy does occur in humans with normal audiometric function, it cannot be easily measured and quantified. It is likely that humans are much less sensitive to noise damage than rodents. Dobie and Humes (2017) outline a number of caveats required when transposing sound exposures in laboratory rodent experiments into real-world human exposures.
An excellent overview and discussion of the literature on human studies of noise-induced cochlear synaptopathy highlights the common areas and differences between the various studies (Le Prell, 2019). Many studies focussed on participants in their 20s and 30s, with a small number explicitly testing older listeners. In most of the analyses age was not
the analysis reported (Valderrama et al., 2018). Grinn et al. (2017) also entered age and noise exposure into the same regression model to establish whether changes in
audiometric function could be detected after recent noise exposure, although the age range was quite narrow (21-27 years). Johannesen et al. (2019) recently reported a study of ABR wave I growth and speech reception thresholds as proxy measures for
synaptopathy. They reported changes in wave I ABR growth consistent with age-related, but not noise-induced, synaptopathy. There was also no evidence that wave I ABR growth is related to speech-in-noise performance.
In our initial large-scale study on noise-induced cochlear synaptopathy in participants aged 18-35, age and noise exposure were highly correlated (r = 0.52; Prendergast et al., 2017a; 2017b). We observed some weak effects but, due to the nature of the cohort, were unable to establish if these changes were a result of noise exposure or of age. For the present paper, we extended the upper age limit of the originally reported dataset and included participants with any noise exposure profile. This allowed us to model both age and noise exposure and determine the extent to which they are able to account for the variance in the observed data. As we discussed when interpreting the findings of our initial study, it may be that a noise-induced loss of cochlear synapses is occurring in the young listeners, but the effects are too subtle to observe reliably. We speculated that a reduction in
cochlear synapses due to noise exposure may be easier to observe via proxy measures in older listeners as the noise exposure damage becomes convolved with age-related
synaptopathy (Prendergast et al., 2017a).
isolate the contributions of cochlear synaptopathy from between-subject variations in other aspects of auditory processing or anatomy (Plack et al., 2016). Age- and noise-induced cochlear synaptopathy is assumed to preferentially affect low-SR fibers, and therefore stimuli presented at a high sound level are most likely to be affected. Previously we
expected noise-induced synaptopathy to occur in the 3-6 kHz range as this corresponds to the region in which noise-notches occur in audiograms and so we used stimuli presented in low and high frequency regions to measure responses which were assumed to be less or more affected by the loss of synapses, respectively. However, as the age-related loss of synapses occurs uniformly across the cochlea length (Wu et al., 2018), for the analyses presented in this paper the differential measures were constructed across level. Therefore, each psychophysical task was performed at 40 and 80 dB SPL at 4 kHz. Each speech task was performed at these low and high sound levels (40 and 80 dB SPL). An envelope-following response (EFR) was measured at a single intensity (80 dB SPL) at 4 kHz. The ABR was normalized by scaling the wave I amplitude relative to the wave V amplitude in each listener. The main research question was: What are the relative contributions of age and noise exposure in predicting measures of cochlear synaptopathy?
Methods
Participants
years; std of 5.46 years) giving a final sample size of 156 (96 women). All participants had audiometric thresholds within the normal range up to 4 kHz (i.e. <25 dB HL) and at 8 kHz all participants had audiometric thresholds of <35 dB HL. The procedures were approved by the University of Manchester Research Ethics Committee and all participants gave informed consent (project number 14163).
Noise Exposure
Lifetime noise exposure was estimated using the same methodology as described in Prendergast et al. (2017a; 2017b). Guest et al. (2018a) provides an exhaustive overview of a very similar approach, how to implement it, and the strengths and weaknesses of this methodology. The structured interview sought to quantify the number of hours, days, weeks, months and years that a participant estimates placing themselves in an environment where the noise exposure exceeds 85 dBA. A formula was then used to compute the cumulative noise exposure over the lifetime. The raw noise immission units were log transformed to produce a normal distribution. Each logarithmic unit is equivalent to a factor of 10 in terms of lifetime exposure energy. A score of 0.5 represents relatively low noise exposure, and could be achieved by going to a nightclub for three hours, once per month for 6 years. A score of 1.98 could be achieved by someone in their mid-30’s who has attended a nightclub/gig for three hours twice a week, every week, for the last 20 years. For the older listeners their noise exposure scores may be made up of
Pure Tone Audiometry
Pure tone audiometry was performed for each ear separately at octave frequencies between 0.25 and 8 kHz in accordance with the British Society of Audiology (2011) recommended procedure. Thresholds were measured using VIASYS GSI-Arrow audiometers coupled to TDH-39P supra-aural headphones, with MX41 cushions. High-frequency audiometry was also performed using a Creative E-MU 0202 USB soundcard. Sounds were played over Sennheiser HDA 200 circum-aural headphones designed for high-frequency audiometry. The sound stimulus was a quarter-octave wide band of noise centered at 16 kHz.
Electrophysiological and Behavioral Measures
The specific and detailed implementations of the ABR and EFR are described in detail in Prendergast et al. (2017a) and the psychophysical and speech-in-noise tasks in
Prendergast et al. (2017b). A summary of the stimuli, measures and analyses is given here. For each task or recording, a single differential measure was used in the analysis in order to constrain the number of comparisons, with the exception of the EFR which used the response from a single condition rather than a differential measure . In all cases, the justification for the choice of each differential measure is reported. For all of the tasks used, and for the differential measures constructed, the underlying assumption is that the low-SR account of how cochlear synaptopathy affects the physiology of the auditory system is accurate, and therefore that coding of high-intensity stimuli is more
ABR
All electroencephalography (EEG) recordings were made in a single 2-h session and used an ActiveTwo system (Biosemi, Amsterdam). Active electrodes were placed at the high forehead (Fz), the seventh cervical vertebra (C7) and the left and right mastoids (M1, M2). For the additional cohort of 33 participants, gold-plated active electrodes were used.
Stimuli were 100-μs diotic clicks high-pass filtered at 1.5 kHz (using a fourth order
Butterworth filter) and presented binaurally in alternating polarity. Because of the low-pass characteristic of the ER3A inserts, the stimulus delivered to the ear had a restricted
bandwidth with a spectral plateau from about 1.5 to 4 kHz. Click levels were 100 dB peSPL (measured at the output of the inserts using an IEC711 2-cc coupler). Presentation rate was 11 clicks/s with 7480 presentations in total. Clicks were presented in 18-second blocks. The 198 clicks presented within a block were not jittered, but the timing of the blocks were jittered.
Differential voltage waveforms were created using Fz-M1 and Fz-M2 and these two
montages were then averaged to give the final ABR waveform. Peak-to-trough amplitudes were automatically extracted from the ABR waveform using custom software which is described fully in Prendergast et al (2017a). The differential measure used for the analyses presented here was the wave I/wave V amplitude ratio.
Envelope-Following Response
285 Hz) transposed to 4 kHz (Bernstein and Trahiotis, 2002) presented to each ear. For one acquisition, the left ear received a 255 Hz pure tone and a 240 Hz transposed tone, and the right ear received a 270 Hz pure tone and a 285 Hz transposed tone. For the other acquisition, the left ear received a 285 Hz pure tone and a 255 Hz transposed tone, and the right ear received a 240 Hz pure tone and a 270 Hz transposed tone. Stimuli were 220 ms in duration (including 10 ms ramps) and presented at 80 dB SPL. Each stimulus was presented 4000 times in alternating polarity (2000 repetitions for each polarity) with an inter-stimulus interval randomly selected within the range 85–95 ms.
The montage used for the analysis was Fz-C7. For each polarity, sweeps were maintained for further analysis if their RMS power was no greater than two standard deviations above the mean for the recording. Included sweeps were averaged in the time domain to produce an average for each polarity. These averages were summed to produce a waveform that contains the EFR for the high-frequency region and also subtracted to produce a
waveform which emphasizes the fine structure frequency-following response for the low frequency region. The fine structure frequency-following response was not included in the analyses presented in this paper. A 200-ms window was used for the analysis, which began 10 ms after stimulus onset. Once the EFR was extracted from the raw data, the four responses (two from each acquisition) were expressed as SNRs, the average of these converted into dB (20log10[SNR]) and this was used as the dependent variable for the EFR measure.
All stimuli were presented using a Creative E-MU 0202 USB soundcard and Sennheiser HD650 circum-aural headphones and digitized in the creation and presentation stages at a sampling frequency of 48 kHz. Interaural phase difference (IPD) and amplitude modulation detection (AMD) thresholds were measured using a two-down, one-up adaptive staircase. Thresholds were estimated using the average of the final 10 reversals for each run, and across three runs. Both tasks were performed at a low and high frequency region (255 Hz and 4 kHz, respectively) and a low and high sound intensity (40 and 80 dB SPL,
respectively). For the analyses presented in this paper, only the 4-kHz conditions were used and the differential measure constructed was 80 dB SPL – 40 dB SPL. The
differential measure is expressed in logarithmic units, with the sign denoting the direction of the difference (i.e., a positive value indicating worse performance in the high-intensity condition).
For the IPD task, an AAAA vs. ABAB paradigm was used. Tones were 300 ms in duration (including 50 ms raise-cosine ramps). The stimulus was a transposed tone, consisting of a 4 kHz tonal carrier modulated by a half-wave rectified, and low-pass filtered, 255-Hz pure tone. This processing allows the neural representation of the high-frequency stimulus envelope to mimic the neural representation of the low-frequency pure tone once it has undergone internal peripheral processing (which can be modelled as a rectification and subsequent low-pass filter; Bernstein and Trahiotis, 2002). The IPD for the standard
high-frequency condition, low-pass pink noise was added in order to mask combination tones. The cut-off frequency of the noise band was 2.5 kHz and the spectrum level at 1 kHz was 40 dB below the signal level.
For the AMD task, a three-alternative forced-choice paradigm was used. Stimuli were 200 ms in duration. The carrier was a 4-kHz pure tone that was sinusoidally amplitude
modulated at 25 Hz. The RMS energy was equated across intervals. The starting modulation depth was 50% and this was then geometrically varied according to a two-down one-up track with an initial step size factor of 1.56 and a final step size factor of 1.25. There was a 500-ms inter-stimulus interval between each of the three tones.
Speech Tasks
The co-ordinate response measure (CRM) was used (Bolia et al., 2000). The participant was presented with a number of speech utterances of the structure “Ready < call sign > go to < color > < number > now”, in which there were eight unique call signs, four different
identification. The summary metric used was the difference in SNR between thresholds for the 40 and 80 dB SPL conditions (80-40).
The digit triplet test (DTT; Smits et al., 2004) was also used, in which participants were required to identify three spoken digits (in the range 1 to 9) presented sequentially in a speech-shaped background noise (0-10 kHz bandwidth). The noise was fixed at each of two levels (40 and 80 dB SPL) while the sound level of the spoken digits was varied. A method of constant stimuli was used, with six repetitions at each of eight SNRs presented per block of trials. Three randomly interleaved blocks were presented for each sound intensity, resulting in 18 presentations for each SPL-SNR combination. The overall percent
correct responses were calculated for each condition. The SNRs used were −24 to −3 dB
in steps of 3 dB. Cumulative Gaussians were fit to the data and, for both presentation levels, the SNR corresponding to 25% correct identification was taken forward into the statistical analyses. This was because in Prendergast et al. (2017b) we reported
thresholds for 25%, 50% and 75% correct response criteria and though the relation with noise exposure was weak, it was strongest for the most challenging conditions. The summary metric used was the difference in SNR between the thresholds for 40 and 80 dB SPL (80-40).
Statistical Analyses
of noise exposure. We also included 16-kHz audiometric thresholds as these have been proposed to be an early marker of noise-induced synaptopathy and in a number of studies showing differences in ABR amplitudes as a function of exposure group, there are often audiometric differences in the high frequency region (e.g. Liberman et al., 2016; Grose et al., 2017). Our inclusion of this measure is based on the rationale that the responses, specifically the ABR amplitudes, may be affected by high-frequency audiometric hearing loss. Including this measure as a predictor in the regression analyses allowed us to control for these hearing thresholds when assessing the effect of age and noise exposure on performance.
The models were used to predict the dependent variables highlighted in the methods section (ABR: wave I/V ratio; EFR: 4 kHz SNR; IPD: 80–40 dB SPL presented at 4 kHz; AMD: 80–40 dB SPL presented at 4 kHz; CRM: 80-40 dB SPL; DTT: 80-40 dB SPL). All analyses were performed using the linear regression model in SPSS (IBM Corp, Version 23). The aim of the extension to the cohort was to provide additional data within which age and noise exposure were not as strongly related as in the original cohort. We would then be better able to disentangle the two parameters.
Results
Noise Exposure
Figure 1 shows estimated lifetime noise exposure scores for all 156 participants as a function of age. The two cohorts are identified by the dashed vertical line. Note that the y-axis is a logarithmic scale with respect to energy: the individuals with the highest
(std=0.53) whilst the average exposure for the older cohort is 1.52 (std=0.40). The Spearman correlation between noise exposure and age is 0.50 (p=4.16e-11) for the full cohort (N=156) and for the older group of 33 listeners alone is 0.24 (p=0.17).
Audiograms
Figure 2 shows audiometric and 16 kHz thresholds for the younger cohort of 123 listeners, and the older cohort consisting of 33 listeners, averaged between the ears. The median score (shown in red in each of the boxes) for the older, smaller, group of participants is greater than that of the younger cohort at each frequency tested. The boxes, denoting the central 50% of data points, are markedly displaced between the groups at 4 and 8 kHz. This displacement is more pronounced at 16 kHz, where many of the older participants were constrained by the maximum permitted output of 85 dB SPL.
Electrophysiology
Figure 3 shows the ABR wave I, V and I/V amplitudes in response to a 100 dB peSPL click for the full cohort of participants as a function of age, with the different symbols
representing the lower (filled circles), middle (open circles) and upper (plus signs) thirds of the noise exposure cohort. The least squares regression lines are plotted and the
participants have fewer synaptic connections than younger people (Viana et al., 2015; Wu et al., 2018), and in this cohort (as shown in Figure 1) the older listeners are likely to have had greater lifetime noise exposure than the younger listeners. Therefore, one would predict the size of these responses to be reduced in older listeners relative to the younger listeners. The fact that they are not indicates that these measures are not sensitive enough to pick up subtle changes in auditory coding. What can be seen clearly in Figures 3 and 4 is the large variability in response amplitude seen for participants aged 18-20. As this between-subject variability is so high, a large sample size would be needed in order to estimate the effect of age on these electrophysiological measures.
Psychophysics
Figure 5 shows the psychophysical thresholds for the full cohort of participants as a function of age, with the symbols differentiating the lower, middle and upper thirds of the noise exposure cohort. The least squares regression lines are plotted and the Spearman correlation coefficients are shown. For the AMD task, the older listeners tend to perform better than the younger listeners at both sound levels. For the IPD task, performance appears relatively stable with age for the low-level condition. As for the electrophysiological measures shown in Figures 3 and 4, the between-subject variability of the responses at a single age on the continuum appears to be as large as any variability in the response across different ages.
Speech in Noise
Figure 6 shows the CRM and DTT thresholds for the full cohort of participants as a function of age, with the symbols differentiating the lower, middle and upper thirds of the noise exposure cohort. The least squares regression lines are plotted and the Spearman correlation coefficients are shown. For the differential measure, a negative value indicates that listeners performed better in the 80 dB condition compared to the 40 dB condition. For the CRM task, the older listeners, on average, show higher thresholds than the younger listeners at both intensities, which result in the R2 for the differential measure being lower than that of both the individual conditions. For the DTT, performance across the continuum is largely equivalent at 40 dB SPL and older participants tend to show higher thresholds at 80 dB SPL.
Multiple Regression Models
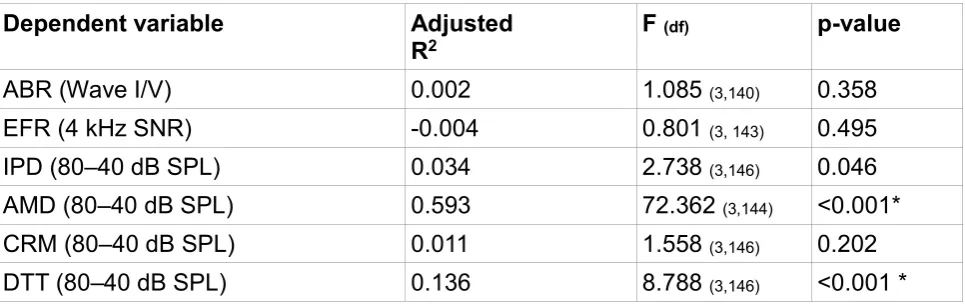
Table 1 shows the R2 and significance levels for the six regression models. The models for
the DTT and AMD tasks reach statistical significance. Further inspection of the DTT model indicates that both age and noise exposure are significant predictors of the differential measure (standardized beta coefficients of 0.441 and -0.288, respectively, and p-values of 0.0001 and 0.001, respectively). Surprisingly, the predictors of age and noise exposure have opposite effects on the differential measure. Increasing age is associated with an increase in the differential measure (consistent with increasing synaptopathy) and increasing noise exposure is associated with a decrease in the differential measure
with cochlear synaptopathy will perform less well in the high-intensity, 80-dB SPL, condition compared to the low-intensity, 40-dB SPL, condition. 16-kHz audiometric thresholds are not a significant predictor. One concern is that responses in the 40-dB condition are affected by audiometric threshold and that listeners with poorer hearing perform less well on the task. However, the Spearman correlation between the 40-dB DTT threshold and the between ear average of pure tone thresholds at 4 and 8 kHz was -0.152 (p=0.058). The negative correlation indicates that listeners with higher absolute thresholds perform slightly better on the task (yield a lower SNR value for 25% correct). A second concern was that, due to issues of co-linearity between the predictor variables, the
individual coefficients could be an inaccurate description of the underlying relations in the data. However, for the three regression predictors, the largest variance inflation factor was 2.03, which indicates multi-colinearity is not a concern, as harmful multi-collinearity is considered to be present only when this value reaches 10 (Marquardt, 1970).
The model including age, noise exposure and high-frequency audiometric thresholds is also a significant predictor of performance for the AMD differential measure. Further inspection of the model parameters indicates that only age is a significant predictor of performance (standardized beta coefficient of -.744, p<0.001), with older listeners performing better in the 80-dB condition compared to the 40-dB condition relative to the younger listeners. There is again the concern that audiometric threshold may account for the differences across the group and that, as audiometric threshold is likely to vary with age, even though these thresholds are all within clinically normal limits. The Spearman correlation coefficient between the AMD differential measure and 4 kHz audiometric threshold is -0.34 (p<0.001), indicating that as audiometric threshold gets worse,
performance on the amplitude modulation detection task improves. This issue is studied in more detail in the following section.
Exploratory Analyses
Two additional exploratory analyses were performed to understand better what factors may account for the significant regression model of the DTT differential measure. First, the variables of age and noise exposure were centered by demeaning and an interaction term was used in a model with age and noise exposure to examine whether any independent variance was explained by this term. The model is significant (adjusted R2 = 0.147; F(3,152) = 9.88; p < 0.05e-4), with age and noise exposure both still significant predictors for the DTT differential measure (beta = 0.395 and -0.296, p<0.03e-4 and p < 0.03e-2,
respectively). The interaction term is not a significant predictor of performance (beta =
0.035, p=0.646). The model is also significant for the AMD task (adjusted R2 = 0.209;
(standardized beta = -0.469, p<0.05e-4). Noise exposure and the interaction term are not significant predictors of performance.
Prendergast et al. (2017b) evaluated the relation between musical experience (number of years over which a musical instrument was played regularly) and behavioral performance. Additional regression models were tested, one with age and musical experience used as predictors and one with noise exposure and musical experience used as predictors. The model containing age and musical experience significantly predicts the DTT differential measure (F(2,153) = 8.398; p = 0.0003) but musical experience itself is not a significant predictor (standardized beta = -0.118; p= 0.127). The model with noise exposure and musical experience is not a significant predictor of the differential DTT measure (F(2,153) = 2.454; p = 0.089). The same is seen for the AMD models, with musical experience not modifying the outcome previously seen in which age is the only significant predictor of performance.
The Role of Audiometric Thresholds
Although the audiometric criteria for inclusion required participants to have clinically normal hearing up to 4 kHz, this still leaves 30 dB of variability. Many studies, including ones from our laboratory, equate the hearing of listeners in this way and often overlook the possibility that performance on tasks and electrophysiological measures are still dependent on
audiometric thresholds in the standard range. To test this, we re-ran the regression models reported in Table 1, but for each task replaced the 16-kHz hearing thresholds with the thresholds at a tone frequency within the normal range. For each measure, the
audiometric thresholds used were those which correlated most strongly with the
to have worse hearing in the standard audiometric range that the younger listeners (see Figure 2), and this could therefore mask any differences due to noise exposure or age.
By selecting the audiometric frequency which most strongly correlates with the dependent variable, we are ensuring that the model has the best chance possible of highlighting the role of audiometric thresholds. This is particularly important with respect to the initial DTT model as it is now as easy as possible for this second model to cast doubt on the veracity of the initial model which pointed to age and noise exposure as independent predictors. It is also important for the AMD model in order to establish whether this task does vary as a function of age independent of audiometric thresholds. As the audiometric threshold was chosen for the reason of its high correlation with the dependent variable, no inference should be made regarding any models in which only audiometric threshold is a significant predictor of performance; the crucial aspect is whether including audiometric threshold changes the predictive value of age or noise exposure relative to the initial model.
The thresholds entered for each model, and the correlation between audiometric threshold and the dependent variable are as follows: ABR and 1 kHz threshold, r = -0.29; EFR and 250 Hz threshold, r = -0.07; IPD and 4 kHz threshold r = 0.34; AMD and 4 kHz threshold, r = -0.34; CRM and 2 kHz threshold, r = 0.16; DTT and 500 Hz threshold, r = -0.22. If the same alpha is used as for the previous models (0.008) despite the fact that these are now additional tests, then the relation between audiometric threshold and the dependent variable is significant for the ABR, IPD and DTT measures.
Table 2 shows the adjusted R2 values for the regression models. If these are compared to
range is a better estimator of the data than a model including 16-kHz thresholds. Two of the six models are not statistically significant; EFR and CRM. For the two measures which were previously non-significant (ABR and IPD), age and noise exposure are not significant predictors of the differential measure and only the audiometric threshold significantly predicts performance: ABR, 1 kHz threshold standardized beta = -0.306, p<0.001; IPD, 4 kHz threshold standardized beta = 0.298, p=0.001.
The initial DTT model which included 16-kHz thresholds, shows that all three predictor variables significantly predict the differential measure of performance. For the new model, including 500-Hz thresholds instead, again all three parameters are significant predictors of performance: noise exposure standardized beta = -0.285, p < 0.001; Age standardized beta = 0.445, p<0.001; and 500-Hz thresholds standardized beta = -0.272, p < 0.001.
The initial AMD model which included 16-kHz thresholds is highly significant and the only statistically significant independent predictor is age. For the new model, including 4-kHz thresholds, again age is the only significant predictor of performance: standardized beta = -4.732, p<0.001.
Relations of Measures to ABR Wave I
ABR wave I amplitude is a proxy of the degree of cochlear synaptopathy present (Kujawa and Liberman, 2009; Sergeyenko, et al., 2013; Grose et al., 2017). Hence, it is informative to use this to test the hypothesis that synaptopathy is related to other measures of auditory function. A similar approach has been used by Johannesen et al. (2019) in order to
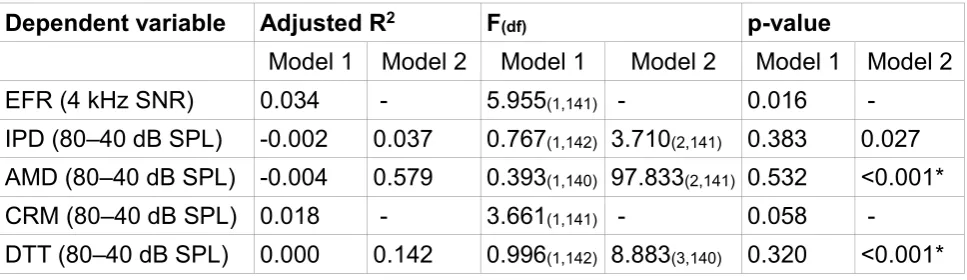
For this analysis, two regression models were run for each of five dependent variables. For the first model, ABR wave I amplitude was entered as a single predictor variable. For the second model, ABR wave I amplitude was entered, with age, noise exposure and high-frequency audiometry entered in a stepwise, iterative scheme. This exploratory analysis allows an investigation of whether the objective measure of auditory nerve function alone is able to predict auditory coding fidelity on a number of measures. Table 3 shows the results of these analyses. ABR wave I amplitude is not a significant predictor of
performance on any of the five measures tested. For the stepwise model which sequentially and iteratively introduced age, noise exposure and high-frequency
audiometric thresholds, these analyses yield no new information compared to the models in Table 1; the DTT is significant due to age and noise exposure interacting in different directions and performance on the AMD task is only predicted by age.
Discussion
No Evidence for Age- or Noise-induced Cochlear Synaptopathy
The research question posed was: What are the relative contributions of age and noise exposure in predicting measures of cochlear synaptopathy? To answer this question we extended the age range of the original cohort. The addition of 33 older listeners to the cohort reduced the correlation between age and noise exposure, providing us with greater capacity to dissociate the two parameters.
extended age range in the current study, we found no evidence that age or noise exposure predicts the differential response measures of the ABR, or the EFR amplitudes.
The only measures which result in a statistically significant regression model are the DTT and AMD. For the DTT, noise exposure is a significant predictor of performance, but the pattern of results is not consistent with the low-SR synaptopathy hypothesis. Noise-exposed participants performed relatively better in the 80 dB condition than in the 40 dB condition, whereas the low-SR hypothesis of noise-induced synaptic loss would predict performance to be impaired in the 80 dB condition due to the loss of high-threshold fiber terminals. Age also has a significant effect on the DTT measure, with older participants performing slightly better than younger listeners at 40 dB but worse in the 80 dB condition. For the AMD task, detection thresholds improved with increasing age. Neither of these models appear to be confounded by differences in audiometric threshold and neither do they support the simple hypothesis, suggested by the low-SR hypothesis of synaptic loss, that noise-induced and age-related synaptopathy will result in a reduction in performance for high-intensity sounds.
In summary, our findings are consistent with studies from our laboratory using distinct cohorts (Guest et al, 2017,2018b; Prendergast et al., 2017a,b), and those from other research groups (Spankovich et al., 2017; Grinn et al., 2017, Fullbright et al., 2017; Yeend et al., 2017; Smith et al., 2019), suggesting that there is little effect of recreational noise exposure on auditory function for individuals with clinically normal audiometric thresholds.
The model which significantly accounts for variance in the DTT differential measure
in a larger differential measure, with performance in the 80-dB condition relatively worse than that in the 40-dB condition, whereas noise exposure predicts the opposite relation, with increasing noise exposure predicting performance to be relatively better in the 80-dB condition. This is difficult to reconcile as, if a person still engages in exposure to loud recreational music as they age, then these two behaviors, according to the model presented in this paper, act in opposite directions on the differential measure of
performance. It should be noted that the effect of noise exposure on DTT performance was reported in Prendergast et al. (2017b) and as many of the participants are the same as in the current analysis, it is not particularly surprising that this relation persists. What is of interest is the fact that the model identifies noise exposure and age as independent
predictors of performance. Also, Prendergast et al. (2017a, b) reported weak but significant relations (uncorrected) for differential measures of IPD, AMD, CRM and EFR and noise exposure. However, for the analyses presented here, in which many participants are the same, these relations are not significant.
As the human auditory system ages, it is well established that loss of outer hair cell function leads to poorer hearing (Lee, 2013), and there is evidence for additional age-related neural deficits, particularly affecting temporal processing (e.g. Füllgrabe et al. 2015). Furthermore, aging has been shown to lead to a loss of cochlear synapses in animals (Sergeyenko et al., 2013; Parthasarathy and Kujawa, 2018) and in human
The data presented in this paper underline the difficulty inherent in dissociating the effects of aging from those due to noise exposure. Even if a reliable proxy measure for a loss of cochlear synapses were found it is difficult to see how this would translate into a more accurate assessment of the causes of a patient’s auditory disability. For instance, if a person performs worse than expected (for their age-relevant norms) on the DTT task at 80 dB, is this because they are in the tail of the distribution for age-related changes in
hearing, or because they have additional deficits due to noise exposure? For a second listener who is more noise exposed, the model would predict their performance to be better than the first person, but there is variability in the onset of age-related changes and there are individual differences in the susceptibility to damage from noise exposure
(Henderson et al., 1993).
One option to try to disentangle these two factors might be to model the effects of different hearing profiles, degrees and types of loss (i.e. outer hair cell, inner hair cell, synaptic connection and fiber group). Difficulties remain with such an approach, as they do not prevent age and noise exposure co-varying in the populations under examination, but they perhaps allow researchers to make predictions about the expected pattern of performance on various measures, given that the low-SR hypothesis now seems inadequate to explain how noise-induced cochlear synaptopathy might manifest itself in humans (Verhulst et al., 2016, 2018; Carney, 2018). Another effective approach would be to observe changes longitudinally, but such studies are time-consuming and cost-intensive to implement.
What Can the Digit Triplet Test Tell Us About Cochlear Synapses?
The Definition of Normal Hearing in Experimental Research
The exploratory analysis in which audiometric thresholds from the standard range were entered into the regression models adds a number of important discussion points to the work presented in this manuscript: 1) that the significant DTT and AMD models initially seen do not appear to be dependent on any difference in audiometric thresholds within the standard range; 2) That although a cohort can have clinically normal hearing, they should not necessarily be considered to have equivalent hearing, as their performance on a task may still be related to their audiometric thresholds (performance on the IPD task was predicted by 4 kHz audiometric thresholds). Both of these points have implications for how future studies of sub-clinical listening deficits should be analysed. It is important to
highlight that no great weight of inference can be assigned to the fact that the audiometric threshold was a significant predictor in some models where age and noise exposure were not; individual hearing thresholds were entered because they were highly correlated with the dependent variable. The aim of this analysis was to determine if, for some tasks, age and noise exposure were significant predictors of performance once audiometric
thresholds had been controlled for, and whether there was any evidence that the initial DTT model was being largely driven by hearing and not in fact noise exposure or age. The analysis does indicate that assuming listeners with a possible 30 dB dynamic range in their hearing thresholds are a homogeneous group could lead to erroneous results.
Future Directions for Synaptopathy Research in Humans
(Prendergast et al., 2017a, 2017b, 2018), listeners who report significant listening difficulties (Guest et al., 2018b), and listeners who report perceiving prolonged
spontaneous tinnitus (Guest et al., 2017). In all instances, the initial work in the mouse model of cochlear synaptopathy (the low-SR hypothesis) was our starting point and formed the core of our assumptions regarding its likely manifestation in humans. In none of our studies do we find any strong evidence that electrophysiological measures of the auditory system vary systematically with noise exposure, nor do we find any perceptual
consequences of increased levels of noise exposure. These findings are mirrored by the findings of the field more generally; even when there is evidence for the presence of noise induced cochlear synaptopathy, the perceptual consequences of this are not apparent (Le Prell, 2019; Bramhall et al., 2019)..
Subjective recall of a participant’s lifetime noise exposure is sub-optimal as the main predictive metric in an analysis. However, after building up extensive experience in
administering the NESI in our laboratory, we believe this is unlikely to be the main reason for our conclusions consistently showing a lack of relation between noise exposure and altered auditory performance. Guest et al. (2017) demonstrated that there is a statistically significant difference in NESI score for those with tinnitus compared to those without and Ferguson et al. (2019) validated the lack of bias when using retrospective recall of speech communication effort to estimate levels of noise encountered in the real world. More likely is that participants who expose themselves to sufficient noise levels to result in a
substantial noise-induced loss of cochlear synapses also sustain an audiometric threshold shift and thus are excluded from our research cohorts.
humans and therefore the methodological techniques that can best elucidate this
physiological change. The exploratory analyses presented here suggest that using wave I as a proxy measure for the degree of synaptopathy does not result in clearer relations than those observed using estimated lifetime noise exposure as a proxy for the degree of
synaptopathy. Furthermore, none of the measures vary as a function of age as predicted, which highlights the potential lack of sensitivity which exists for these measures. The between-subject variability of young listeners is high compared with the variance across the lifespan. It may be necessary to better understand the different sources of variability in the responses and only if the variability across participants in the same parts of the age and noise exposure continuums (i.e. within low- and high-noise exposure groups and young and old listeners) can be reduced, will it be possible to reliably examine differences across different ages and levels of noise exposure. Unless this cross-participant variability within the same age range can be reduced, it will be difficult to study either noise-induced or age-related cochlear synaptopathy non-invasively using these techniques. It may be that the DTT and AMD measures could be used in combination to provide an insight into the health of the neural pathway to compliment the snap-shot of auditory health obtained via an audiogram. But currently, it is difficult to know if these responses are able to tell us about synaptopathy and, if so, the extent to which this is noise-induced or age-related.
Human temporal bone studies are difficult to coordinate and time-consuming to perform, but through these we are slowly gaining a better understanding of the rate of synaptic loss across the lifespan. The evidence that humans lose neural connections as a function of age is much clearer than the evidence that we lose them due to noise exposure and so a challenge is to now focus on older listeners who do not have normal audiometric function. There are potentially significant gains to be made in healthcare by developing tests of auditory function that can compliment the audiogram in order to provide a complete picture of how different changes in the auditory system and different fiber groups can be
assessed, leading to a more individualized process of diagnosing the state of a listener’s auditory health. However, it is our view that the assumptions which have underpinned the early work on cochlear synaptopathy in humans, including the measures used, must be challenged.
Acknowledgments
References:
Bernstein, L.R., Trahiotis, C., 2002. Enhancing sensitivity to interaural delays at high frequencies by using “transposed stimuli”. J. Acoust. Soc. Am. 112, 1026-1036.
Bolia, R.S., Nelson, W.T., Ericson, M.A., Simpson, B.D., (2000). A speech corpus for multitalker communications research. J. Acoust. Soc. Am. 107, 1065-1066.
Bourien, J., Tang, Y., Batrel, C., Huet, A., Lenoir, M., Ladrech, S., Desmadryl, G., Nouvian, R., Puel, J.L., Wang, J., (2014). Contribution of auditory nerve fibers to compound action potential of the auditory nerve. J. Neurophysiol. 112, 1025-1039.
Bramhall, N.F., Konrad-Martin, D., McMillan, G.P., Griest, S.E., (2017). Auditory brainstem response altered in humans with noise exposure despite normal hair cell function. Ear Hear. 38, e1-e12.
Bramhall, N., Beach, E.F., Epp, B., Le Prell, C.G., Lopez-Poveda, E.A., Plack, C.J., Schaette, R., Verhulst, S., Canlon, B. (2019) The search for noise-induced cochlear synaptopathy in humans: Mission impossible? Hear Res. 377, 88-103.
British Society of Audiology, (2011). Pure-tone air-conduction and bone-conduction
threshold audiometry with and without masking. Recommended procedure (British Society of Audiology, Reading, UK), 32.
Ferguson, M.A., Tomlinson, K.B., Davis, A.C., Lutman, M.E., (2019). A simple method to estimate noise levels in the workplace based on self-reported speech communication effort in noise. Int. J. Audiol. 58, 450-453.
Füllgrabe, C., Moore, B.C.J., Stone, M.A. (2015). Age-group differences in speech
identification despite matched audiometrically normal hearing: contributions from auditory temporal processing and cognition. Front. Aging Neurosci. 6:347.
Fullbright, A.N.C., Le Prell, C.G., Griffiths, S.K., Lobarinas, E., (2017). Effects of
recreational noise on threshold and suprathreshold measures of auditory function. Semin. Hear. 38, 298-318.
Furman, A.C., Kujawa, S.G., Liberman, M.C., (2013). Noise-induced cochlear neuropathy is selective for fibers with low spontaneous rates. J. Neurophysiol. 110, 577-586.
Grinn, S.K., Wiseman, K.B., Baker, J.A., Le Prell, C.G., (2017). Hidden hearing loss? No effect of common recreational noise exposure on cochlear nerve response amplitude in humans. Font. Neurosci. 11: 465.
Grose, J.H., Buss, E., Hall III, J.W., (2017). Loud music exposure and cochlear synaptopathy in young adults: Isolated auditory brainstem response effects but no perceptual consequences. Tends in Hearing. 21, 1-18.
Guest, H., Dewey, R. S., Plack, C. J., Couth, S., Prendergast, G., Bakay, W., Hall, D. A. (2018a). The Noise Exposure Structured Interview (NESI): An Instrument for the
Comprehensive Estimation of Lifetime Noise Exposure. Trends in Hearing. https://doi.org/10.1177/2331216518803213
Guest H., Munro, K.J., Prendergast, G., Millman, R.E., Plack, C.J. (2018b) Impaired speech perception in noise with a normal audiogram: No evidence for cochlear synaptopathy and no relation to lifetime noise exposure. Hear. Res. 364, 142-151.
Henderson, D., Subramaniam, M., Boettcher, F.A. (1993). Individual susceptibility to noise-induced hearing loss: an old topic revisited. Ear Hear. 14, 152-68.
Hickox, A.E., Larsen, E., Heinz, M.G., Shinobu, L., Whitton, J.P., (2017). Translational issues in cochlear synaptopathy. Hear. Res. 349, 164-171.
Jerger, J., Hall, J., (1980). Effects of age and sex on auditory brainstem response. Arch. Otolaryngol. 106, 387-391.
Johannesen, P.T., Buzo, B.C., Lopez-Poveda, E.A., (2019). Evidence for age-related cochlear synaptopathy in humans unconnected to speech-in-noise intelligibility deficits. Hearing Res. In press.
Le Prell, C.G. (2019). Effects of noise exposure on auditory brainstem response and speech-in-noise tasks: a review of the literature. Int J Audiol. 18, 1-30.
Lee, K.Y. (2013). Pathophysiology of age-related hearing loss (peripheral and central). Korean J Audiol. 17, 45-9.
Liberman, M.C., Epstein, M.J., Cleveland, S.S., Wang, H., Maison, S.F., (2016). Toward a differential diagnosis of hidden hearing loss in humans. PLoS ONE, 19, e0162726.
Marquardt, D. W., (1970). Generalized inverses, ridge regression and biased linear estimation. Technometrics, 12, 591-692.
Plack, C.J., Léger, A., Prendergast, G., Kluk, K., Guest, H., Munro, K.J., (2016). Toward a diagnostic test for hidden hearing loss. Trends Hear. 20, 2331216516657466.
Prendergast, G., Guest, H., Munro, K.J., Kluk, K., Leger, A., Hall, D.A., Heinz, M.G., Plack, C.J., (2017a). Effects of noise exposure on young adults with normal audiograms I:
Electrophysiology. Hear. Res. 344, 68-81.
Prendergast, G., Millman, R.E., Guest, H., Munro, K.J., Kluk, K., Dewey, R.S., Hall, D.A., Heinz, M.G., Plack, C.J. (2017b). Effects of noise exposure on young adults with normal audiograms II: Behavioral measures. Hear Res. 356:74-86.
Rabinowitz, P.M. (2000). Noise-induced hearing loss. Am Fam Physician. 61, :2749-56. Sergeyenko, Y., Lall, K., Liberman, M.C., Kujawa, S.G. (2013). Age-related cochlear synaptopathy: an early-onset contributor to auditory functional decline. J Neurosci. 33, 13686-94.
Smith, S.B., Krizman, J., Liu, C., White-Schwoch, T., Nicol, T., Kraus, N. (2019). Investigating peripheral sources of speech-in-noise variability in listeners with normal audiograms. Hear Res. 371, 66-74.
Smits, C., Kapteyn, T.S., Houtgast, T., (2004). Development and validation of an automatic speech-in-noise screening test by telephone. Int. J. Audiol. 43, 15-28.
Spankovich, C., Griffiths, S.K., Lobarinas, E., Morgenstein, K.E., de la Calle, S., Ledon, V., Guerico, D., Le Prell, C.G., (2017). Temporary threshold shift after impulse-noise during video game play: laboratory data. Int. J. Audiol. S53-65.
Stamper, G.C., Johnson, T.A., (2015a). Auditory function in normal-hearing, noise-exposed human ears. Ear Hear. 36, 172-184.
Valderrama, J.T., Beach, E,F,, Yeend, I., Sharma, M., Van Dun, B., Dillon, H. (2018). Effects of lifetime noise exposure on the middle-age human auditory brainstem response, tinnitus and speech-in-noise intelligibility. Hear Res. 365, 36-48.
Valero, M.D., Burton, J.A., Hauser, S.N., Hackett, T.A., Ramachandran, R., Liberman, M.C. (2017). Noise-induced cochlear synaptopathy in rhesus monkeys (Macaca mulatta). Hear. Res. 353, 213-223.
Verhulst, S., Altoè, A., Vasilkov, V. (2018). Computational modeling of the human auditory periphery: Auditory-nerve responses, evoked potentials and hearing loss. Hear
Res. 360, 55-75.
Verhulst, S., Jagadeesh, A., Mauermann, M., Ernst, F. (2016). Individual Differences in Auditory Brainstem Response Wave Characteristics: Relations to Different Aspects of Peripheral Hearing Loss. Trends in Hearing. https://doi.org/10.1177/2331216516672186
Viana, L.M., O'Malley, J.T., Burgess, B.J., Jones, D.D., Oliveira, C.A., Santos, F.,
Merchant, S.N., Liberman, L.D., Liberman, M.C. (2015). Cochlear neuropathy in human presbycusis: Confocal analysis of hidden hearing loss in post-mortem tissue. Hear Res. 327, 78-88.
Wu, P.Z., Liberman, L.D., Bennett, K., de Gruttola, V., O'Malley, J.T., Liberman, M.C. (2018). Primary Neural Degeneration in the Human Cochlea: Evidence for Hidden Hearing Loss in the Aging Ear. Neuroscience. In press.
Table 1. The outcome of the six regression models are shown. Age, noise exposure and
high-frequency hearing thresholds were entered into the model. Note that adjusted R2 can
be negative in weak regression models. * denotes a statistically significant model (alpha = 0.008).
Dependent variable Adjusted
R2 F (df) p-value
ABR (Wave I/V) 0.002 1.085 (3,140) 0.358
EFR (4 kHz SNR) -0.004 0.801 (3, 143) 0.495
IPD (80–40 dB SPL) 0.034 2.738 (3,146) 0.046
AMD (80–40 dB SPL) 0.593 72.362 (3,144) <0.001*
CRM (80–40 dB SPL) 0.011 1.558 (3,146) 0.202
DTT (80–40 dB SPL) 0.136 8.788 (3,146) <0.001 *
Table 2. The outcome of the six regression models in which 16-kHz thresholds were
replaced by hearing thresholds at a frequency from the standard audiometric range (0.25-8 kHz) are shown. Age, noise exposure and hearing thresholds were entered into the model. Note that adjusted R2 can be negative in weak regression models. * denotes a statistically significant model (alpha = 0.008).
Dependent variable Audiometri
c threshold entered
Adjusted
R2 F p-value
ABR (Wave I/V) 1000 Hz 0.077 5.104 (3,146) 0.002 *
EFR (4 kHz SNR) 250 Hz -0.004 0.815 (3,148) 0.488
IPD (80–40 dB SPL) 4000 Hz 0.110 7.378 (3,152) <0.001 *
AMD (80–40 dB SPL) 4000 Hz 0.222 15.518 (3,150) <0.001*
CRM (80–40 dB SPL) 1000 Hz 0.027 2.405 (3,152) 0.070
[image:41.595.58.542.563.729.2]Table 3. The outcome of the analyses in which model 1 used the ABR wave I amplitude to predict the dependent variables and model 2 included wave I amplitude as a constant and added age, noise exposure and high-frequency hearing as determined by a stepwise
procedure. Note that adjusted R2 can be negative in weak regression models. * denotes a
statistically significant model (alpha = 0.008).
Dependent variable Adjusted R2 F(df) p-value
Model 1 Model 2 Model 1 Model 2 Model 1 Model 2
EFR (4 kHz SNR) 0.034 - 5.955(1,141) - 0.016 -
IPD (80–40 dB SPL) -0.002 0.037 0.767(1,142) 3.710(2,141) 0.383 0.027
AMD (80–40 dB SPL) -0.004 0.579 0.393(1,140) 97.833(2,141) 0.532 <0.001*
CRM (80–40 dB SPL) 0.018 - 3.661(1,141) - 0.058 -
Figure captions:
Figure 1. Noise exposure scores as a function of age for 156 participants. The least squares regression line is also shown in red. The lower, middle and upper thirds of the noise exposure cohort are plotted in different symbols. The age cut-off for the two cohorts is shown by the dashed vertical line.
Figure 2. Boxplots are shown in dB HL for the standard audiometric frequencies (0.25-8 kHz) and in dB SPL for 16 kHz. The line denotes the median and the box length the
interquartile range. Whiskers show the extent of the data with outliers (defined as +/- 1.5 x IQR) plotted as individual points. The open boxes denote thresholds from the younger cohort and the filled boxes the older listeners.
Figure 3. ABR responses, with wave I amplitude, wave V amplitude and the wave I/V ratio plotted as a function of age in the left, central and right panels, respectively. The different thirds of the noise exposure cohort are plotted in different symbols. Spearman correlation coefficients are reported.
Figure 4. The EFR response is plotted as a function of age, Solid (red) lines show the linear regression line and the different thirds of the noise exposure cohort are plotted in different symbols. The Spearman correlation coefficient is reported.
Figure 6. The upper row shows SNRs corresponding to the 25% correct-response criterion for the CRM task and the lower row shows SNRs corresponding to the 25%
correct-response criterion for the DTT task. For both rows, the 40 dB, 80 dB and the differential measures plotted as a function of age in the left, central and right panels, respectively. Solid (red) lines show linear regressions. Spearman correlation coefficients are reported.