Elsevier Editorial System(tm) for Materials and Design
Manuscript Draft
Manuscript Number: JMAD-D-18-00607R3
Title: ANN prediction of corrosion behaviour of uncoated and biopolymers coated cp-Titanium substrates.
Article Type: Research Paper
Keywords: cp-Ti, Chitosan, Gelatin, Sodium Alginate, Electrochemical Impedance Spectroscopy (EIS), Artificial Neural Network (ANN)
Corresponding Author: Dr. Suman Kumari, Ph.D
Corresponding Author's Institution: Ghent University.Belgium First Author: Suman Kumari
Order of Authors: Suman Kumari; Hanuma R Tiyyagura, Ph.D; Timothy Douglas; Elbeshary Mohammed; Annemie Adriaens; Regina fuchs-Godec; Krishna Mohan Matravadi; Andre Skirtach
Abstract: The present study focuses on biopolymer surface modification of cp-Titanium with Chitosan, Gelatin and Sodium Alginate. The biopolymers were spin coated onto cp-Titanium substrate and further subjected to Electrochemical Impedance Spectroscopic (EIS) characterisation.
Artificial Neural Network (ANN) was developed to predict the Open Cicuit Potential (OCP) values and Nyquist plot for bare and bioploymer coated cp-Titanium substrate. The experimental data obtained was utilised for ANN training. Two input paramters, i.e., substrate condition (coated or uncoated) and time period were considered to predict the OCP values. Back propogation Levenberg-Marquardt training algorithm was utilised in order to train ANN and to fit the model. For Nyquist plot, the network was trained to predict the imaginary impedance based on real impedance as a function of immersion periods using the Back Propagation Bayesian
algorithm. The biopolymer coated cp-Titanium substrate shows the enhanced corrosion resistance compared to uncoated substrtaes. The ANN model
exhibits excellent comparsion with the experimental results in both the cases indicating that the developed model is very accurate and
Suman Kumari
Department of Metallurgical and Material Enginnering, National Institute of Technology(NIT) Warangal, Warangal,
India.
Email: suman.shakya15@gmail.com
Warangal, India 30.6.2018
Dear Editor,
Please find attached a revised manuscript (third time) with the title: “ANN prediction of
corrosion behaviour of uncoated and biopolymers coated cp-Titanium substrates”.
First of all, we would like to thank you for your comments for the improvement of our
manuscript. Following these comments, we have corrected the comments, and uploaded a
manuscript with modified graphical abstract and highlights. The answers to the questions and
comments raised can be found in the response to decision letter. We hope that you will now
find our contribution suitable to be published as an article in Materials &Design.
With kind regards
Comments from the editors and reviewers:
Comments:
Editorial:
The graphical abstract and highlights should be revised according to recently published guidelines: http://www.sciencedirect.com/science/article/pii/S0264127515005031
In addition, more than 25% of the references should be from the last three years (2016-2018), in order to show the potential impact of this paper on the relevant fields for Materials & Design.
Highlights
The present study focuses on evaluation of corrosion behaviour of uncoated and biopolymer coated commercially pure (CP) Ti.
Three biopolymers, i.e., Chitosan, Gelatin B and Sodium Alginate were coated via. spin coating technique.
Open Circuit Potential (OCP) and Electrochemical Impedance spectroscopy (EIS) studies were carried out for corrosion evaluation.
Artificial Neural Network (ANN) modeling is carried out to predict OCP values and Nyquist plots.
Sodium Alginate coated Ti substrates shows the highest corrosion resistance among all three biopolymers.
1
ANN prediction of corrosion behaviour of uncoated and biopolymers coated
cp-Titanium substrates
Suman Kumaria*, Hanuma Reddy Tiyyagurab, Timothy E. L. Douglasc, Elbeshary A. A.
Mohammedd, Annemie Adriaensd, Regina fuchs-Godecb, M. K. Mohana and Andre Skiratchc,f
a
Dept. of Metallurgical and Materials Engineering, National Institute of Technology
Warangal, India
b
Faculty of Chemistry and Chemical Engineering, University of Maribor, Maribor, Slovenia
c
Dept. of Molecular Biotechnology, Ghent University, Belgium
d
Dept. of Analytical Chemistry, Ghent University, Belgium
f
Centre for Nano- and Biophotonics, Ghent University, Belgium
Corresponding author: *suman.shakya15@gmail.com *Manuscript
2
Abstract
The present study focuses on biopolymer surface modification of cp-Titanium with Chitosan,
Gelatin, and Sodium Alginate. The biopolymers were spin coated onto a cp-Titanium
substrate and further subjected to Electrochemical Impedance Spectroscopic (EIS)
characterization. Artificial Neural Network (ANN) was developed to predict the Open Circuit
Potential (OCP) values and Nyquist plot for bare and biopolymer coated cp-Titanium
substrate. The experimental data obtained was utilized for ANN training. Two input
parameters, i.e., substrate condition (coated or uncoated) and time period were considered to
predict the OCP values. Backpropagation Levenberg-Marquardt training algorithm was
utilized in order to train ANN and to fit the model. For Nyquist plot, the network was trained
to predict the imaginary impedance based on real impedance as a function of immersion
periods using the Back Propagation Bayesian algorithm. The biopolymer coated cp-Titanium
substrate shows the enhanced corrosion resistance compared to uncoated substrates. The
ANN model exhibits excellent comparison with the experimental results in both the cases
indicating that the developed model is very accurate and efficiently predicts the OCP values
and Nyquist plot.
Keywords: cp-Ti, Chitosan, Gelatin, Sodium Alginate, Electrochemical Impedance
3
1. Introduction
Metallic materials continue to dominate the biomedical industry, especially for hard tissue
replacement (orthopaedic, dental) and cardiac implants[1],[2],[3]. A broad range of metals are
known to mankind, but among them only a few are suitable for using inside the human body.
The main factors contributing towards the selection of a metal for the orthopaedic implants
are biocompatibility, should have adequate mechanical properties and must be corrosion
resistant[4]. Titanium and Titanium alloys have emerged as materials of choice for
biomedical implant applications [5],[6],[7],[8],[9],[10],[11]. CP-Ti (Commercially pure
Titanium) and Ti-6Al-4V (ELI) Titanium-6 Vanadium-4 Aluminum (Extra Low Interstitial)
are the two most common base implant materials[12],[13],[14],[15]. However, these alloys
have certain disadvantages such as poor osseointegration properties and low corrosive-wear
resistance[10],[16]. The surface coating of implant with organic polymer is an effective and
inexpensive strategy to improve the corrosion behaviour and biocompatibility of the substrate
surface[17]. Numerous biopolymers have been coated to evaluate the surface response of the
substrate. Corrosion is an important aspect for a biomaterial due to extreme corrosive nature
of the human body fluids[18]. The corrosion deterioration can reduce the lifespan of implant
leading to need to revision surgery[19]. The Ti and Ti alloys are characterized by
instantaneously formed stable oxide layer which is responsible for their exceptional corrosion
resistance[20]. But once the stable TiO2 is broken down or removed, it is unable to reform on
parts of surface. Thus, making Ti implants susceptible to corrosion. The studies have also
suggested that cp-Ti undergoes stress corrosion cracking (SCC) , severe form of corrosion, in
the presence of fluoride ions[21]. Many surface modification has been used to modify the
surface to enhance corrosion resistance of the implants. In this regard, surface coatings with
4
A considerable amount of research has been focussed towards functionalization of the
implant with Chitosan(CS)[22]. CS is a cationic polysaccharide and deacetylated derivative
of Chitin[23],[24], [25],[26].[27] CS is a nontoxic polymer which assists in wound healing
and promotes osteogenesis[28]. CS is used for biomedical applications in many forms, such
as scaffolds[29],[30],[31] and as hydrogels[32],[33],[34] Sodium Alginate (SA) is another
natural biodegradable polysaccharide[35],[36], exhibiting biocompatibility, bio-functionality,
non-toxicity and low cost[35]. SA, as a component of multilayer assembly, is being coated on
a number of substrates[37],[38],[39]. On the other hand, Gelatin (Gel) is a water-soluble,
biodegradable polypeptide, derived from collagen by partial synthesis [40]. Collagen is one
of the key structural protein found in the extracellular matrix of many connective tissues.
Over the years, Gel is utilized for many applications ranging from the food industry to
pharmaceuticals[41]. Gel coated Titanium substrate showed the enhanced cell
biocompatibility and cell adhesion and growth[42].
Artificial Neural Network (ANN) is a computational tool based on biological neural network
system[43]. ANN is a powerful mathematical tool to simulate a wide variety of complex
scientific and engineering problems ANN prediction is useful in many applications in
engineering and applied sciences like biomedical applications[44],food science [45],solar
cell systems [46],[47],energy systems[48],communication systems [49],nuclear materials[50].
Many attempts have been made in order to imply ANN in different fields for a number of
applications, like speech recognition[51],[52], prediction of coating thickness[53], prediction
of mechanical properties[54],[55], weather prediction[56], pharmaceutical research[57],
identification of cell behaviour[58], medical imaging[59], predicting corrosion
behaviour[60],[61],[62] etc.
5
of their corrosion behaviour. Evaluation and quantification of corrosion process are
time-consuming and in case of the implant materials, it is difficult to monitor the corrosion process
on a real-time basis. In this regard, ANN is a potential technique which can be used to predict
the corrosion rate in presence of corrosive human body fluids. Further, the implant failure can
be estimated based on corrosion behaviour.
The OCP (Open Circuit Potential) studies were carried out on uncoated and coated substrates.
EIS studies were also performed to obtain Nyquist plots to determine corrosion behaviour.
The input database was prepared based on experimental studies[63],[64]. Artificial Neural
Network (ANN) was trained to utilize the experimental database for predicting the corrosion
behaviour of coated and uncoated Ti substrate with Open Circuit Potential (OCP) values and
Nyquist plot.
2. Experimental Procedure
2.1. Materials and Methods
CP-Ti foil with thickness 0.125 mm was procured (Goodfellow UK). The samples with the
dimension 1 cm X 1 cm were cut and further polished with SiC paper (up to 1200 grade) to
remove the native oxide. The polished samples were cleaned ultrasonically in acetone
followed by ethanol for 15 mins respctively. CS (DA 75%-85%), Gel B and SA were
purchased from Sigma Aldrich. Analytical grade reagents were used without further
purification. Phosphate Buffered Saline (PBS) was prepared by dissolving PBS tablet in
Deionized water (dissolving one PBS tablet in 200 mL of DI water resulted in 0.01M PBS
6
2.2. Biopolymer coating
The polished and cleaned samples were subjected to spin coating. 1 wt% CS solution, 10
wt% Gel (Type B) and 3 wt% SA were prepared by dissolving in deionized water. The
samples were spin coated at 4000 rpm with 2500 rpm/s acceleration for a time period of 60
seconds.
2.3. Attenuated total reflection-Fourier Transform Infrared (ATR-FTIR) spectroscopy
analysis
ATR-FTIR spectroscopy analysis of the substrates were performed to identify the presence
of all three biopolymers onto the surface before and after incubation for 24 hours in PBS by
Perkin-Elmer IR spectrophotometer with a Golden Gate attenuated total reflection (ATR)
attachment with a diamond crystal. The spectra were accumulated within 16 scans at a
resolution of 4 cm-1 within a range of 4000 cm1 to 650 cm-1. The background air spectrum
was subtracted before each measurement.
2.4. Surface characterization
The surface morphology of the coated samples after incubation for 24 hours was examined
with Scanning electron microscope (FEI Quanta 200 3D).
2.5. Electrochemical characterization
Electrochemical experiments were performed with a conventional three-electrode
configuration (Solartron 1287 Electrochemical interface with a Gamry 600™
potentiostat/galvanostat) with substrate as working electrode, Platinum as counter electrode
and SCE (Saturated Calomel Electrode) as reference electrode. All experiments were carried
7
area to the electrolyte. The prepared PBS solution was used as electrolyte for all
measurements.
2.6. Artificial Neural Network (ANN) Modelling
2.6.1. OCP Prediction
To develop the ANN model, the experimental data was randomly divided into three parts,
training dataset (70%), testing dataset (15%) and validation dataset (15%). Back Propagation
Levenberg-Marquardt (BPLM) training algorithm, supervised learning technique, was
utilised in order to train the ANN and fit the model. The BPLM algorithm calculates the root
mean square error (RMSE) with theoretical values and network prediction. NN linear transfer
function was used for transforming neuron input value into the output values. The transfer
function for the hidden layers was sigmoidal. Two inputs, i.e., condition of the substrate (uncoated or coated) and different time period, were taken into consideration. Thus, the
architecture of ANN becomes 2-20-1. One hidden layer with 20 neurons was found to be
optimum. The NN presented for the given problem was created using MATLAB r2016a.
Parameters affecting the OCP values were considered as inputs, i.e., sample condition and
immersion time. The network was then trained to predict the OCP values. The input dataset
was normalised (unity based normalization) to obtain the values ranging from 0 to 1
(equation 10).
(10)
2.6.2. Nyquist plot prediction
The experimental database was divided randomly into training data set (80%) and testing
dataset (20%). Backpropagation Bayesian (BPB) algorithm updates the weight and bias
8
minimizes the initial combination of squared errors and weights and then determines the
correct combination so as to produce a network that generalizes well[65]. The real and
imaginary impedance values were the inputs for ANN. Based on these two inputs, the
imaginary impedance values for uncoated and biopolymer coated Ti are predicted. The ANN
architecture is 2-20-1, with optimum results showing for one hidden layer with 20 neurons.
The pseudo code for prediction of corrosion parameters for the Nyquist plot is shown in
Figure 1.
3. Results and Discussion
3.1. ATR-FTIR measurements
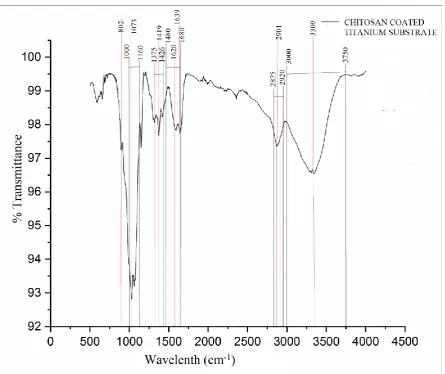
FTIR spectra of CS coated Ti are shown in Figure 2. The characteristic absorption peak at
wavelength 3309 cm-1 is vibration of O-H (3000 cm-1-3750 cm-1) and N-H (3000 cm-1-3750
cm-1) bands[66]. The peaks at 2901 and 1416 are the vibration of C-H bond in CH2 and CH3
and methylene and methyl group having characteristic peaks in the range (2875 cm-1 - 2920
cm-1) and (1375 cm-1 - 1426 cm-1) respectively. The peak at 1639 corresponds to the C=O
vibration (1680 cm-1-1480 cm-1). The FTIR peaks at 1073 and 802 is vibration of C-O-H
group (1000 cm-1- 1160 cm-1) and wagging of saccharide respectively[66].
Figure3 shows the FTIR absorption spectra for Gel coated Ti substrate. The absorption peak
at wavelength 3331 cm-1 corresponds to the presence of secondary amine group (3500 cm1 -
3310 cm-1) and the peak at 2916 cm-1 corresponds to the C-H stretching of alkanes (2962 cm-1
to 2853 cm-1). The peak at 1647 cm-1 is due to amide C=O stretching which has a
characteristic peak in the wavelength range of 1620 cm-1 to 1710 cm-1[67]. The N-H bending
peak (1650-1500 is shown at 1552 cm-1. N-H out of plane wagging presents at 608 cm-1[67].
9
cm-1 is due to overlapping of C-H and O-H peaks. The sharp peaks at 1405 and 1596 are
assigned to the presence of symmetric and asymmetric vibration of carboxylate ions (1460
cm-1- 1649 cm-1). The peaks at 1107 and 935 are due to vibration of C-O pyra-nosyl ring and
C-O contribution from C-C-H and C-O-H group respectively[68].
FIGURE 2.
FIGURE 3.
FIGURE 4.
3.2. Open circuit potential (OCP)
OCP indicates the thermodynamic tendency of material during the electrochemical oxidation
process. It is an important parameter in order to predict the corrosion behaviour of a material
in the absence of induced corrosion effect. The potential varies with time, which is attributed
to the changes taking place at the surface of the substrate and stabilizes after a certain period
of time. The stabilization nature of potential was observed to be same for all the samples. The
potential first shifted to active direction, i.e., becoming more negative, then stabilized
eventually.
OCP values of Ti and CS, Gel, and SA coated Ti substrates OCP measurements curves for
the Cp-Ti substrate for the different lengths of time, i.e., 1 hour, 3 hours, 6 hours, 12 hours
and 24 hours in PBS is shown in the Figure5. The OCP value after 1 hour is observed to be
-376.2 mV at zero time which decreases further to a value of -498.4 mV at a time period of
3.6k seconds. In electrolyte. the naturally developed oxide film may grow and dissolve
simultaneously[69]. The decrease in the OCP value is associated with the dissolution of the
oxide film present on the surface. OCP value after the 3 hours of immersion was -536.3 mV
at zero and -542.7 mV at 3.6k seconds respectively. The same trend is observed for the 6
10
achieve thermodynamic equilibrium with an increase in the immersion period. The OCP
values decrease further with an increase in immersion time. This decrease in the value is due
to increase in corrosion rate with increase in the immersion time period.
The OCP curves for the CS coated Ti are shown in the Figure5. The OCP value for the CS
coated Ti is -201.3 mV at zero time period and stabilizes at -258.2 mV for 1 hour immersion
time period, which is much lower than the OCP value for the bare Ti substrate (-375.2 mV).
This decrease in OCP value indicates the presence of CS layer on the surface. The increase in
the immersion time results in increased corrosion rate. The OCP curves for Gel coated Ti are
shown in Figure 5. The OCP values for Gel coated substrates were lower than for the Ti
substrate but were highest among all biopolymer coated Ti substrates which indicates the
least corrosion provided for Gel coated substrate. SA coated Ti substrates exhibit the lowest
OCP values, thus the better corrosion protection.
FIGURE 5.
3.3. Electrochemical Impedance Spectroscopy (EIS) Measurements
The EIS results are presented through the Nyquist plot after 24 hours of immersion in PBS
solution at ambient temperature. Nyquist plot reflects directly the corrosion resistance of a
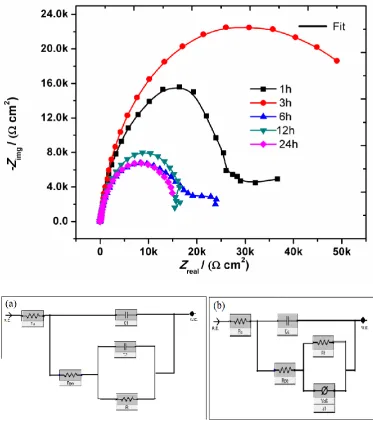
substrate as diameter of circle indicating the polarization resistance (RP)[70]. Figure6
presents the Nyquist plot for the uncoated Ti for a time period of 1 hr, 3 hrs, 6 hrs, 12 hrs and
24 hours. Nyquist plot for time period of 1 hour exhibits a inductive loop followed by
capacitive loops at higher immersion time period. The presence of inductive loop is attributed
to the surface relaxation of species in the oxide layer[71]. The capacitive arc corresponds to
the combined effect of double layer and metal dissolution and its diameter is related to charge
transfer resistance at metal/electrolyte interface[72]. The Nyquist plots show the depressed
11
process[73]. Critical behaviour was observed for immersion time period of 6 hours, 12 hours
and 24 hours, where the substrate resistance increases which may be due to presence of
thicker oxide layer. The data were fitted using two different circuit diagrams. Circuit diagram
shown in Figure 6(a) was used for fitting the impedance data corresponding to 1 hour
immersion in PBS solution. Figure 6(b) was utilised to fit the Nyquist plot for 3 hours, 6
hours 12 hours and 24 hours PBS incubation. The EIS fitted parameters are shown in the
Table 1.
FIGURE 6.
TABLE 1.
Figure7 shows the Nyquist plot for CS coated Ti substrates for immersion time period of 1
hour shows a semicircle followed by a straight line. The highest value for the semicircle
diameter is observed for the immersion time period of 3 hours showing the highest corrosion
resistance. Further increase in the immersion time shows the decreased corrosion resistance
value with little deviation for 6 hours, 12 hours and 24 hours. The circuit is shown in Figure
7(a) was used for fitting the date for 1 hour and 6 hours incubation in PBS solution with
double capacitive behaviour while Figure 7(b) circuit was used for fitting the data for 3 hours,
12 hours and 24 hours (single capacitive arc). The circuit shown in Figure 7 was used for
fitting the data.
FIGURE 7.
12
The Nyquist curve for the Gel coated Ti substrate is shown in Figure 8. The Nyquist curve for
the immersion period of 1 hour exhibits the highest arc with an inductive loop which is due to
the adsorbed intermediates on the surface[74]. The Nyquist data was utilized for fitting the
circuit which is shown in Figure 8 (a). The arc diameter decreases with time, i.e., for 3 hours,
6 hours and 12 hours which is due to increase in corrosion rate with increased immersion
time period. The sudden increase in diameter is observed for the time period of 24 hours may
be due to thickening of the oxide film. Data were fitted using the circuit shown in Figure
8(b), and fitting parameters shown in Table 3.
FIGURE 8.
TABLE 3.
The Nyquist curve for the SA coated Ti substrate (Figure 9) shows the largest diameter
among all the biopolymers which indicates better corrosion resistance. The diameter of the
arc first decreases with increased immersion time, i.e., for 1 hour and 3 hours, but then
increased with the highest value observed for 24 hours. For all the Nyquist curves, Warburg
impedance is seen which shows the resistance to mass transfer indicating the corrosion
process under diffusion controlled. The circuit shown in Figure 9 was used for fitting Nyquist
data for SA coated Ti substrate and fitting parameters shown in Table 4.
FIGURE 9.
TABLE 4
3.5. ATR-FTIR characterization after incubation in PBS
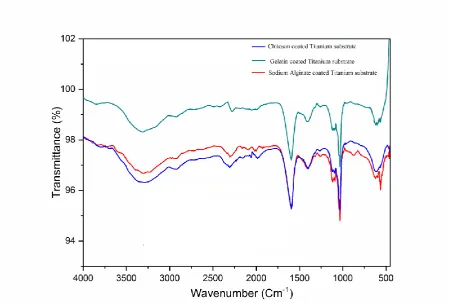
FTIR spectra after PBS incubation for 24 hours are shown in the Figure10 which shows the
13
840 cm-1 are due to the formation of apatite. The peaks at 1049 cm-1, 1049 cm-1, 1033 cm-1
confirms the presence of ionically bonded PO43- groups.
PBS incubation of biopolymer coated Titanium substrates significantly alters the FTIR
spectra showing the dominant presence of adsorbed carbonate (CO32-) related vibration as
directly adsorbed (2000-2300 cm-1 region) or arising from formed apatite (being approved by
bands at about 1547 cm-1, 1440 cm-1, and 840 cm-1), being ionically bonded to -PO43- groups
(bands at about 1049 cm-1, 1049 cm-1, 1033 cm-1)[75].
FIGURE 10.
3.6.SEM characterization after PBS incubation
Scanning Electron Microscope characterization was carried out for the coated substrate after
24 hours incubation in PBS solution. Figure 11 (a) and (b) shows the micrographs for
Chitosan coated substrate at different magnifications. SEM studies show the presence of
cracks and deposition (carbonate and phosphate groups confirmed by FTIR). SEM
micrographs of Gelatin coated Titanium substrate are shown in Figure 12. The surface shows
the formation of pits and cracks on the substrate surface. Sodium Alginate coated Titanium
substrate shows fewer pits compared to Gelatin coated substrate (Figure 13).
Figure 11
Figure 12
Figure 13
4. Artificial Neural Network prediction for OCP values and Nyquist plots
4.1. Artificial Neural Network Modelling for Prediction of OCP values
The input parameters and NN predicted OCP values are shown in Table 5. The use of NN
exhibits excellent accuracy in predicting the OCP values outputs. The input dataset consists
of substrate condition normalized values and Time period normalized values. While the
14
dataset. A network with three layers, two neurons for input layer, 10 neurons for hidden layer
and one neuron for output layer was designed. The input variables for establishing NN were
sample condition and the immersion time. The BPLM trained network was then used to
compare the predicted and measured values. Figure 14 represents the comparison between the
experimental and predicted OCP values. The R values for training dataset, validation dataset,
and test dataset are 0.99999, 1 and 0.99972 respectively, yielding an overall R-value of
0.99813. This clearly indicates the accuracy of ANN in predicting OCP values. The
developed model can be used to simulate and predict the OCP values.
FIGURE 14.
4.2. Artificial Neural Network for Prediction of Nyquist plots
The input dataset was randomly divided into training and testing dataset. Back Propagation
Bayesian algorithm was used for training and fitting the model. Figures 15, 16, 17 and 18
represents the Nyquist plot for base cp-Titanium, Chitosan coated Titanium, Gelatin coated
Titanium and Alginate coated Titanium at different immersion periods respectively. The
three-layer network with two neurons for input, twenty neurons for hidden layer and one
neuron for output was used. Immersion time period and real part of frequency were the input
dataset with the imaginary part of frequency as target dataset. During ANN training the
output of the network was measured against the target values. The regression coefficient of
R=0.98772 was achieved for bare Titanium substrate (Figure 15(f)). The regression
coefficient for Chitosan coated Ti substrate was 0.98821 as shown in Figure 16(f). The
Gelatin coated Titanium substrate shows a regression value of 0.94083 (Figure 17(f)). Figure
18(f) shows the regression value of Alginate coated Titanium substrate which is 0.99994. All
these regression values indicate the high precision for corrosion modeling and prediction of
15 FIGURE 15.
FIGURE 16.
FIGURE 17.
FIGURE 18
Conclusions
Commercially pure (CP) Titanium substrate was coated with Chitosan, Gelatin B, and
Sodium Alginate biopolymers via spin coating technique and corrosion behaviour of the
uncoated and coated substrate were studied. All coated cp-Ti substrates showed better
corrosion behaviour compared to the uncoated cp-Ti substrate. Sodium Alginate coated Ti
substrates shows the highest corrosion resistance among all three biopolymers followed by
Gelatin and Chitosan coated cp-Ti substrates. An artificial neural network was developed to
model and predict the OCP values for the bare and biopolymer coated Titanium substrates.
The values predicted by the present model are in good agreement with the obtained
experimental values. Similarly, ANN was also trained in order to predict the Nyquist plot.
Therefore, the present ANN model can be used to predict accurately the OCP values for the
16
References
[1] M. Niinomi, M. Nakai, J. Hieda, Development of new metallic alloys for biomedical
applications, Acta Biomater. 8 (2012) 3888–3903. doi:10.1016/j.actbio.2012.06.037.
[2] M. Niinomi, Recent metallic materials for biomedical applications, Metall. Mater.
Trans. A. 33 (2002) 477–486. doi:10.1007/s11661-002-0109-2.
[3] T.H. Reddy, S. Pal, K.C. Kumar, M.K. Mohan, V. Kokol, Finite element analysis for
mechanical response of magnesium foams with regular structure obtained by powder
metallurgy method, Procedia Eng. 149 (2016) 425–430.
doi:10.1016/j.proeng.2016.06.688.
[4] F.E.T. Heakal, O.S. Shehata, N.S. Tantawy, Integrity of metallic medical implants in
physiological solutions, Int. J. Electrochem. Sci. 9 (2014) 1986–2004.
[5] M. Balazic, J. Kopac, M.J. Jackson, W. Ahmed, Review : titanium and titanium alloy
applications in medicine, 2007. doi:10.1504/IJNBM.2007.016517.
[6] M. Geetha, A.K. Singh, R. Asokamani, A.K. Gogia, Ti based biomaterials, the
ultimate choice for orthopaedic implants - A review, Prog. Mater. Sci. 54 (2009) 397–
425. doi:10.1016/j.pmatsci.2008.06.004.
[7] I. Gotman, Characteristics of metals used in implants., J. Endourol. 11 (1997) 383–9.
doi:10.1089/end.1997.11.383.
[8] M. Niinomi, Mechanical biocompatibilities of titanium alloys for biomedical
applications, J. Mech. Behav. Biomed. Mater. 1 (2008) 30–42.
doi:10.1016/j.jmbbm.2007.07.001.
[9] P. Schmutz, N.-C. Quach-Vu, I. Gerber, Metallic medical implants: electrochemical
characterization of corrosion processes, Electrochem. Soc. Interface. 17 (2008) 35.
[10] X. Liu, P.K. Chu, C. Ding, Surface modification of titanium, titanium alloys, and
17 49–121. doi:10.1016/j.mser.2004.11.001.
[11] F. Guillemot, Recent advances in the design of titanium alloys for orthopedic
applications, Expert Rev. Med. Devices. 2 (2005) 741–748.
doi:10.1586/17434440.2.6.741.
[12] C. Veiga, J.P. Davim, PROPERTIES AND APPLICATIONS OF TITANIUM
ALLOYS : A BRIEF REVIEW, 32 (2012).
[13] P. Tengvall, I. Lundström, Physico-chemical considerations of titanium as a
biomaterial, Clin. Mater. 9 (1992) 115–134. doi:10.1016/0267-6605(92)90056-Y.
[14] M.A. Khan, R.L. Williams, D.F. Williams, In-vitro corrosion and wear of titanium
alloys in the biological environment, Biomaterials. 17 (1996) 2117–2126.
doi:10.1016/0142-9612(96)00029-4.
[15] S. Tamilselvi, R. Murugaraj, N. Rajendran, Electrochemical impedance spectroscopic
studies of titanium and its alloys in saline medium, Mater. Corros. 58 (2007) 113–120.
doi:10.1002/maco.200603979.
[16] Osseointegration of titanium , titanium alloy and zirconia dental implants : current
knowledge and open questions, 73 (2017) 22–40. doi:10.1111/prd.12179.
[17] J.D. Bumgardner, B.M. Chesnutt, Y. Yuan, Y. Yang, M. Appleford, S. Oh, R.
McLaughlin, S.H. Elder, J.L. Ong, The integration of chitosan-coated titanium in bone:
an in vivo study in rabbits., Implant Dent. 16 (2007) 66–79.
doi:10.1097/ID.0b013e3180312011.
[18] A. Balamurugan, S. Rajeswari, G. Balossier, A.H.S. Rebelo, J.M.F. Ferreira, Corrosion
aspects of metallic implants - An overview, Mater. Corros. 59 (2008) 855–869.
doi:10.1002/maco.200804173.
[19] H.R. Tiyyagura, B. Munirathinam, B.R. Sunil, L. Neelakantan, R. Willumeit-, M.K.
18 Alloys lloys, 5 (2017) 561–564.
[20] H. Reddy Tiyyagura, K. Chaitanya Kumar, Investigation on Electro-Chemical
Behaviour of H 2 SO 4 and HCl Solutions, 5 (2017) 496–499.
[21] M.H.O. Könönen, E.T. Lavonius, J.K. Kivilahti, SEM observations on stress corrosion
cracking of commercially pure titanium in a topical fluoride solution, Dent. Mater. 11
(1995) 269–272. doi:10.1016/0109-5641(95)80061-1.
[22] T.E.L. Douglas, S. Kumari, K. Dziadek, M. Dziadek, A. Abalymov, P. Cools, G.
Brackman, T. Coenye, R. Morent, M.K. Mohan, A.G. Skirtach, Titanium surface
functionalization with coatings of chitosan and polyphenol-rich plant extracts, Mater.
Lett. 196 (2017) 213–216. doi:https://doi.org/10.1016/j.matlet.2017.03.065.
[23] A. Di Martino, M. Sittinger, M. V. Risbud, Chitosan: A versatile biopolymer for
orthopaedic tissue-engineering, Biomaterials. 26 (2005) 5983–5990.
doi:10.1016/j.biomaterials.2005.03.016.
[24] M.I. Sabir, X. Xu, L. Li, A review on biodegradable polymeric materials for bone
tissue engineering applications, J. Mater. Sci. 44 (2009) 5713–5724.
doi:10.1007/s10853-009-3770-7.
[25] J.D. Bumgardner, R. Wiser, S.H. Elder, R. Jouett, Y. Yang, J.L. Ong, Contact angle,
protein adsorption and osteoblast precursor cell attachment to chitosan coatings
bonded to titanium., J. Biomater. Sci. Polym. Ed. 14 (2003) 1401–1409.
doi:10.1163/156856203322599734.
[26] Z. Wang, X. Zhang, J. Gu, H. Yang, J. Nie, G. Ma, Electrodeposition of
alginate/chitosan layer-by-layer composite coatings on titanium substrates, Carbohydr.
Polym. 103 (2014) 38–45. doi:10.1016/j.carbpol.2013.12.007.
[27] H. Reddy Tiyyagura, R. Rudolf, S. Gorgieva, R. Fuchs-Godec, V.R. Boyapati, K.M.
19
corrosion behaviour of porous magnesium monoliths, Prog. Org. Coatings. 99 (2016)
147–156. doi:10.1016/j.porgcoat.2016.05.019.
[28] P.R. Klokkevold, L. Vandemark, E.B. Kenney, G.W. Bernard, Osteogenesis enhanced
by chitosan (poly-N-acetyl glucosaminoglycan) in vitro., J. Periodontol. 67 (1996)
1170–5. doi:10.1902/jop.1996.67.11.1170.
[29] A.R. Costa-Pinto, R.L. Reis, N.M. Neves, Scaffolds Based Bone Tissue Engineering:
The Role of Chitosan, Tissue Eng. Part B Rev. 17 (2011) 331–347.
doi:10.1089/ten.teb.2010.0704.
[30] M. Rodríguez-vázquez, B. Vega-ruiz, R. Ramos-zúñiga, D.A. Saldaña-koppel, L.F.
Quiñones-olvera, Chitosan and Its Potential Use as a Scaffold for Tissue Engineering
in Regenerative Medicine, 2015 (2015).
[31] S. Levengood, M. Zhang, Chitosan-based scaffolds for bone tissue engineering, J.
Mater. Chem. B. 2 (2014) 3161–3184. doi:10.1039/C4TB00027G.
[32] N. Bhattarai, J. Gunn, M. Zhang, Chitosan-based hydrogels for controlled, localized
drug delivery, Adv. Drug Deliv. Rev. 62 (2010) 83–99.
doi:10.1016/j.addr.2009.07.019.
[33] Q. Li, D. Yang, G. Ma, Q. Xu, X. Chen, F. Lu, J. Nie, Synthesis and characterization
of chitosan-based hydrogels, Int. J. Biol. Macromol. 44 (2009) 121–127.
doi:10.1016/j.ijbiomac.2008.11.001.
[34] S. Van Vlierberghe, P. Dubruel, E. Schacht, Biopolymer-based hydrogels as scaffolds
for tissue engineering applications: A review, Biomacromolecules. 12 (2011) 1387–
1408. doi:10.1021/bm200083n.
[35] M. Szklarska, G. Dercz, W. Simka, K. Dudek, O. Starczewska, M. Łężniak, B.
Łosiewicz, Alginate Biopolymer Coatings Obtained by Electrophoretic Deposition on
20 doi:10.12693/APhysPolA.125.919.
[36] A. Manuscript, Alginate : properties and biomedical applications, 37 (2013) 106–126.
doi:10.1016/j.progpolymsci.2011.06.003.Alginate.
[37] M.G. Carneiro-da-Cunha, M.A. Cerqueira, B.W.S. Souza, S. Carvalho, M.A.C.
Quintas, J.A. Teixeira, A.A. Vicente, Physical and thermal properties of a
chitosan/alginate nanolayered PET film, Carbohydr. Polym. 82 (2010) 153–159.
doi:10.1016/j.carbpol.2010.04.043.
[38] H. Lv, Z. Chen, X. Yang, L. Cen, X. Zhang, P. Gao, Layer-by-layer self-assembly of
minocycline-loaded chitosan/alginate multilayer on titanium substrates to inhibit
biofilm formation, J. Dent. 42 (2014) 1464–1472. doi:10.1016/j.jdent.2014.06.003.
[39] D.L. Elbert, C.B. Herbert, J.A. Hubbell, Thin polymer layers formed by
polyelectrolyte multilayer techniques on biological surfaces, Langmuir. 15 (1999)
5355–5362. doi:10.1021/la9815749.
[40] H.R. Tiyyagura, R. Fuchs-Godec, S. Gorgieva, S. Arthanari, M.K. Mohan, V. Kokol,
Biomimetic gelatine coating for less-corrosive and surface bioactive Mg–9Al–1Zn
alloys, J. Mater. Res. (2018) 1–14. doi:DOI: 10.1557/jmr.2018.65.
[41] K.B. Djagny, Z. Wang, S. Xu, Gelatin: A Valuable Protein for Food and
Pharmaceutical Industries: Review, Crit. Rev. Food Sci. Nutr. 41 (2001) 481–492.
doi:10.1080/20014091091904.
[42] K. Cai, A. Rechtenbach, J. Hao, J. Bossert, K.D. Jandt, Polysaccharide-protein surface
modification of titanium via a layer-by-layer technique: Characterization and cell
behaviour aspects, Biomaterials. 26 (2005) 5960–5971.
doi:10.1016/j.biomaterials.2005.03.020.
[43] E.P. Kumar, E.P. Sharma, Artificial Neural Networks-A Study, 2 (2014) 143–148.
21
M.R. Alexander, P. Williams, D.A. Winkler, Prediction of Broad-Spectrum Pathogen
Attachment to Coating Materials for Biomedical Devices, ACS Appl. Mater.
Interfaces. 10 (2018) 139–149. doi:10.1021/acsami.7b14197.
[45] I. Gonzalez-Fernandez, M.A. Iglesias-Otero, M. Esteki, O.A. Moldes, J.C. Mejuto, J.
Simal-Gandara, A critical review on the use of artificial neural networks in olive oil
production, characterization and authentication, Crit. Rev. Food Sci. Nutr. (2018) 1–
14. doi:10.1080/10408398.2018.1433628.
[46] I. Loghmari, Y. Timoumi, A. Messadi, Performance comparison of two global solar
radiation models for spatial interpolation purposes, Renew. Sustain. Energy Rev. 82
(2018) 837–844. doi:https://doi.org/10.1016/j.rser.2017.09.092.
[47] H.K. Ghritlahre, R.K. Prasad, Application of ANN technique to predict the
performance of solar collector systems - A review, Renew. Sustain. Energy Rev. 84
(2018) 75–88. doi:https://doi.org/10.1016/j.rser.2018.01.001.
[48] Y. Liu, S. Yu, Y. Zhu, D. Wang, J. Liu, Modeling, planning, application and
management of energy systems for isolated areas: A review, Renew. Sustain. Energy
Rev. 82 (2018) 460–470. doi:https://doi.org/10.1016/j.rser.2017.09.063.
[49] Z. Sabir, M.A. Manzar, M.A.Z. Raja, M. Sheraz, A.M. Wazwaz, Neuro-heuristics for
nonlinear singular Thomas-Fermi systems, Appl. Soft Comput. 65 (2018) 152–169.
doi:https://doi.org/10.1016/j.asoc.2018.01.009.
[50] Y. Li, S. Hu, X. Sun, M. Stan, A review: Applications of the phase field method in
predicting microstructure and property evolution of irradiated nuclear materials, Npj
Comput. Mater. 3 (2017). doi:10.1038/s41524-017-0018-y.
[51] G. Hinton, L. Deng, D. Yu, G.E. Dahl, A. Mohamed, N. Jaitly, A. Senior, V.
Vanhoucke, P. Nguyen, T.N. Sainath, B. Kingsbury, Deep Neural Networks for
22 doi:10.1109/MSP.2012.2205597.
[52] L. Deng, G. Hinton, B. Kingsbury, New types of deep neural network learning for
speech recognition and related applications: an overview, 2013 IEEE Int. Conf.
Acoust. Speech Signal Process. (2013) 8599–8603.
doi:10.1109/ICASSP.2013.6639344.
[53] N. Lin, F. Xie, J. Zou, H. Wang, B. Tang, Application of artificial neural network in
predicting the thickness of chromizing coatings on P110 steel, J. Wuhan Univ.
Technol. Mater. Sci. Ed. 28 (2013) 196–201. doi:10.1007/s11595-013-0664-y.
[54] N. Haghdadi, A. Zarei-Hanzaki, A.R. Khalesian, H.R. Abedi, Artificial neural network
modeling to predict the hot deformation behavior of an A356 aluminum alloy, Mater.
Des. 49 (2013) 386–391. doi:10.1016/j.matdes.2012.12.082.
[55] S. Malinov, W. Sha, Application of artificial neural networks for modelling
correlations in titanium alloys, Mater. Sci. Eng. A. 365 (2004) 202–211.
doi:10.1016/j.msea.2003.09.029.
[56] A. Saxena, N. Verma, K.C. Tripathi, A Review Study of Weather Forecasting Using
Artificial Neural Network Approach, Int. J. Eng. Res. Technol. 2 (2013) 2029–2035.
[57] P.J. Lisboa, A.F.G. Taktak, The use of artificial neural networks in decision support in
cancer: A systematic review, Neural Networks. 19 (2006) 408–415.
doi:10.1016/j.neunet.2005.10.007.
[58] Z.-H. Zhou, Y. Jiang, Y.-B. Yang, S.-F. Chen, Lung cancer cell identification based on
artificial neural network ensembles, Artif. Intell. Med. 24 (2002) 25–36.
doi:10.1016/S0933-3657(01)00094-X.
[59] a S. Miller, B.H. Blott, T.K. Hames, Review of neural network applications in medical
imaging and signal processing, Med Biol Eng Comput. 30 (1992) 449–64 ST–Review
23
[60] M. Kamrunnahar, M. Urquidi-Macdonald, Prediction of corrosion behavior using
neural network as a data mining tool, Corros. Sci. 52 (2010) 669–677.
doi:10.1016/j.corsci.2009.10.024.
[61] D. Mareci, G.D. Suditu, R. Chelariu, L.C. Trincă, S. Curteanu, Prediction of corrosion
resistance of some dental metallic materials applying artificial neural networks, Mater.
Corros. (2016) n/a-n/a. doi:10.1002/maco.201608848.
[62] J. Shi, J. Wang, D.D. Macdonald, Prediction of primary water stress corrosion crack
growth rates in Alloy 600 using artificial neural networks, Corros. Sci. 92 (2015) 217–
227. doi:10.1016/j.corsci.2014.12.007.
[63] F. Mansfeld, Use of electrochemical impedance spectroscopy for the study of
corrosion protection by polymer coatings I ---I I, J. Appl. Electrochem. 25 (1995) 187–
202. doi:10.1007/BF00262955.
[64] J. Titz, G.H. Wagner, H. Spáhn, M. Ebert, K. Jüttner, W.J. Lorenz, Characterization of
Organic Coatings on Metal Substrates by Electrochemical Impedance Spectroscopy,
Corrosion. 46 (1990) 221–229. doi:10.5006/1.3585095.
[65] M. Correa, C. Bielza, M.D.J. Ramirez, J.R. Alique, A Bayesian network model for
surface roughness prediction in the machining process, Int. J. Syst. Sci. 39 (2008)
1181–1192. doi:10.1080/00207720802344683.
[66] G. Lawrie, I. Keen, B. Drew, A. Chandler-Temple, L. Rintoul, P. Fredericks, L.
Gr??ndahl, Interactions between alginate and chitosan biopolymers characterized using
FTIR and XPS, Biomacromolecules. 8 (2007) 2533–2541. doi:10.1021/bm070014y.
[67] J.B. Science, T. Nguyen, B. Lee, Fabrication and characterization of cross-linked
gelatin, 2010 (2010) 1117–1124. doi:10.4236/jbise.2010.312145.
[68] Z. a Nur Hanani, Y.H. Roos, J.P. Kerry, Fourier Transform Infrared ( FTIR )
24 Congr. Eng. Food. 5 (2011) 6–9.
[69] A.A. Ghoneim, A.S. Mogoda, K.A. Awad, F.E. Heakal, Electrochemical Studies of
Titanium and its Ti-6Al-4V Alloy in Phosphoric Acid Solutions, Int. J. Electrchem.
Sci. 7 (2012) 6539–6554.
[70] F. Song, C. Wu, H. Chen, Q. Liu, J. Liu, R. Chen, R. Li, J. Wang, Water-repellent and
corrosion-resistance properties of superhydrophobic and lubricant-infused super
slippery surfaces, RSC Adv. 7 (2017) 44239–44246. doi:10.1039/c7ra04816e.
[71] A. Yurt, S. Ulutas, H. Dal, Electrochemical and theoretical investigation on the
corrosion of aluminium in acidic solution containing some Schiff bases, Appl. Surf.
Sci. 253 (2006) 919–925. doi:10.1016/j.apsusc.2006.01.026.
[72] S. Benserradj, The Effect of surface treatments on the electrochemical behavior of
Titanium alloy in seawater by electrochemical impedance spectroscopy ( EIS ), 6
(2015) 1829–1833.
[73] Q. Qu, L. Wang, Y. Chen, L. Li, Y. He, Z. Ding, Corrosion behavior of titanium in
artificial saliva by lactic acid, Materials (Basel). 7 (2014) 5528–5542.
doi:10.3390/ma7085528.
[74] M. Keddam, C. Kuntz, H. Takenouti, D. Schustert, D. Zuili, Exfoliation corrosion of
aluminium alloys examined by electrode impedance, Electrochim. Acta. 42 (1997) 87–
97. doi:10.1016/0013-4686(96)00170-3.
[75] L. Berzina-Cimdina, N. Borodajenko, Research of Calcium Phosphates Using Fourier
Transform Infrared Spectroscopy, Infrared Spectrosc. – Mater. Sci. Eng. Technol.
26
27
28
29
30
Figure 5. Open Circuit Potential for all uncoated and biopolymer coated Titanium substrate at
31
[image:36.595.97.495.71.516.2]
Figure 6. Nyquist plot for uncoated Titanium substrate, (a) circuit used for fitting Nyquist
data for 1 hour of PBS immersion, (b) circuit used for fitting Nyquist data for 3 hours, 6
32
Figure 7. Nyquist plot for Chitosan coated Titanium substrate, (a) circuit used for fitting
Nyquist data for 1 hour and 6 hours immersion, (b) circuit used for fitting Nyquist data for 3
33
Figure 8. Nyquist plot for Gelatin coated Titanium substrate, (a) circuit used for fitting
Nyquist data for 1 hour immersion, (b) circuit used for fitting the data for 3 hours, 6 hours, 12
34
Figure 9. Nyquist plot for Sodium Alginate coated Titanium substrate (a) circuit used for
35
36 (a)
[image:41.595.114.483.70.666.2](b)
37 (a)
[image:42.595.116.482.67.661.2](b)
38 (a)
[image:43.595.113.482.70.664.2](b)
39
40
Figure 15. Nyquist plots obtained bare cp-Titanium (experimental and ANN predicted) for
immersion periods; (a) 1 hour; (b) 3 hours; (c) 6 hours; (d) 12 hours; (e) 24 hours; (f)
41
Figure 16. Nyquist plots obtained Chitosan coated cp-Titanium (experimental and ANN
predicted) the immersion periods; (a) 1 hour; (b) 3 hours; (c) 6 hours; (d) 12 hours; (e) 24
hours; (f) Regression values obtained for the network for Nyquist plot of Chitosan coated
42
Figure 17. Nyquist plots obtained Gelatin coated cp-Titanium (experimental and ANN
predicted) the immersion periods; (a) 1 hour; (b) 3 hours; (c) 6 hours; (d) 12 hours; (e) 24
hours; (f) Regression values obtained for the network for Nyquist plot of Gelatin coated
43
Figure 18. Nyquist plots obtained Alginate coated cp-Titanium (experimental and ANN
predicted) the immersion periods; (a) 1 hour; (b) 3 hours; (c) 6 hours; (d) 12 hours; (e) 24
hours; (f) Regression values obtained for the network for Nyquist plot of Alginate coated
44
Table 1.EIS fitting parameters of uncoated Ti substrates for Nyquist plot
Time period
Rpo (Ω) Rf (Ω)
Cc (F) (e-6) Ru (Ω) L Yo6 (e-6) a7 (e-3)
1 hour 537.6 70.41 --- 2.818 5.982e3 695.5 839.3
3 hours 3.795 550.8 181.1 2.876 --- 473.6 789.6
6 hours 9.648 550.8 221.2 1.791 --- 444.3 766.4
12 hours 21.20 556.0 252.0 972.2e-3 --- 408.1 741.1
[image:49.595.50.556.285.409.2]24 hours 505.1 80.83 712.8 998.2e-3 --- 645.5 897.6
Table 2. EIS fitting parameters of Chitosan coated Ti substrates for Nyquist plot
Time Period
Rpo (Ω) Cc (F) Rf
(Ω)
Ru (Ω) Yo6 a7 (e-3)
1 hour 5.097 71.28e-6 33.18e3 3.106 225.4e-6 831.5
3 hours 3.534 447.8e-9 57.23e3 11.57e-6 280.3e-6 876.0
6 hours 3.566 420.7e-9 19.72e3 24.10e-6 318.5e-6 856.4
12 hours 3.660 522.9e-9 18.13e3 18.43e-6 291.6e-6 868.2
24 hours 3.672 459.8e-9 17.01e3 39.97e-6 303.2e-6 860.7
Table 3. EIS fitting parameters of Gelatin coated substrates for Nyquist plot
Time Period
Rpo (Ω) Cc (F) Rf
(Ω) Ru (Ω) L Yo6 a7
1 hour 1.696e3 --- 397.0 4.338 11.69e3 559.1e-6 860.7e-3
3 hours 1.007e3 356.2e-6 160.7 4.611 --- 66.03e-3 853.7e-3
6 hours 3.408 102.7e-6 1.199e3 4.327 --- 486.0e-6 807.6e-3
12 hours 3.021 99.36e-6 1.127e3 4.051 --- 529.8e-6 792.0e-3
[image:49.595.68.545.475.649.2]45
Table 4. EIS fitting parameters of Sodium Alginate Ti substrates for Nyquist plot
Time Period
Ru (Ω)
Yo6 Alpha WD Rpo (Ω)
1 hour 5.255 195.4E-6 917.8E-3 15.35E-6 18.85E-3
3 hours 5.310 183.7E-6 923.9E-3 30.87E-6 9.743E-3
6 hours 5.328 169.2E-6 925.4E-3 19.70E-6 33.80E-3
12 hours 5.322 164.1.E-6 922.7E-3 11.546E-6 109.7E-3
24 hours 5.354 157.4E-6 933.0E-3 9.053E-6 27.24E-3
Table 5. Experimental and ANN predicted values for Open Circuit Potential for uncoated Ti
and Biopolymer coated Titanium
Substrate condition Substrate condition (Norm. value) Time period (Hours) Normalised value for time period
OCP values (Volts)
Normalised value for OCP Predicted OCP values Error Uncoate d Ti
1 0 1 0 -498.2 0.16179 0.16012 0.001664
1 0 3 0.08696 -544.2 0.07002 0.07087 -0.00084
1 0 6 0.21739 -579.3 0 0.01455 -0.01455
1 0 12 0.47826 -551.4 0.05566 0.05567 -1.06E-05
1 0 24 1 -557.3 0.04389 0.0451 -0.00121
Chitosan coated Titanium
2 0.3333 1 0 -258.2 0.64057 0.63479 0.005785
2 0.3333 3 0.08696 -271 0.61504 0.56007 0.054963
2 0.3333 6 0.21739 -322.1 0.5131 0.51361 -0.00051
2 0.3333 12 0.47826 -329 0.49933 0.4994 -6.84E-05
2 0.3333 24 1 -334.2 0.48896 0.48886 9.41E-05
Gelatin coated Titanium
3 0.6666 1 0 -415.9 0.32597 0.25842 0.067554
3 0.6666 3 0.08696 -493.4 0.17136 0.18553 -0.01417
3 0.6666 6 0.21739 -507.8 0.14264 0.1445 -0.00186
3 0.6666 12 0.47826 -511.5 0.13526 0.13541 -0.00015
3 0.6666 24 1 -513 0.13226 0.13245 -0.00018
Alginate coated Titanium
4 1 1 0 -78.03 1 1.02958 -0.02958
4 1 3 0.08696 -80.94 0.95973 0.95815 0.00158
4 1 6 0.21739 -115.6 0.92505 0.91156 0.013489
4 1 12 0.47826 -137.5 0.88136 0.88073 0.00063
[image:50.595.59.570.346.746.2]