Antioxidant and Pasting Properties of Oat β-Glucan
Hydrocolloids
George E. Inglett*, Diejun Chen
USDA, Agricultural Research Service, National Center for Agricultural Utilization Research, Functional Foods Research Unit 1815 N, Peoria, USA.
Email: *[email protected]
Received March 2nd, 2012; revised May 2nd, 2012; accepted May 11th, 2012
ABSTRACT
Four oat β-glucan enriched hydrocolloids (Nutrim10, C-Trim20, C-Trim30, C-Trim50), oat bran concentrate (OBC), and β-Glucan95 were investigated for antioxidant and pasting properties. C-Trim30 had the highest soluble phenolic content, followed by C-Trim20. The trend of antioxidant activity was similar with that of phenolic contents. The pheno-lic content of the extracts increased with increasing temperatures. The highest content of soluble phenopheno-lic compounds was found at temperatures up to 100˚C for most samples regardless of solvent. Water extracts had significantly higher phenolic contents than extracts from 50% ethanol at 100˚C for all samples with the exception of C-Trim30. However, the effect of temperature and solvent concentrations was not as apparent for antioxidant activity as that observed for phenolic content. In general, the differences in three different solvents were not as apparent. Significantly higher water holding capacities were found for C-Trim30 and C-Trim50 than the other samples while β-Glucan95 had substantially the highest paste viscosity followed by C-Trim50 and C-Trim30.
Keywords: Oat; β-Glucan; Hydrocolloids; Pasting Properties; Antioxidant Activity
1. Introduction
Oat bran has been widely reported to provide a vast range of human health benefits such as serum cholesterol lowering [1], reduced coronary heart disease [2], reduced symptoms of diabetes [3], reduced blood pressure [4], cancer prevention [5], and obesity [6]. A primary com-ponent of oat bran implicated for these health benefits is
β-glucan; however, oat phenolic and other antioxidant compounds also provide health benefits as demonstrated for barley [7].
Oat bran hydrocolloids were prepared from oat bran concentrate (OBC) that contains natural dietary fibers with about 12% as β-glucan. Processed OBC produced oat bran hydrocolloids contain about 15% - 50% β-glu- candepending on procedures used. Several oat bran hy-drocolloids with enriched β-glucan were developed and patented for healthy and nutritional food products by the United States Department of Agriculture in Peoria, IL [8]. Oat bran hydrocolloids, Nutrim and C-Trim, were pro-duced from OBC that was subjected to mechanical shear and steam jet-cooking procedures. OBC, Nutrim and C- Trim products containing 12 - 50 β-glucan have benefi-cial effects on coronary heart disease prevention by the reduction of serum cholesterol and postprandial serum
glucose levels [9].
The antioxidant capacity of oats is contributed by the presence of tocopherols, tocotrienols, phytic acid, fla-vonoids, and non-flavonoid phenolic compounds includ-ing avenanthramides [10]. Oat antioxidants were reported to inhibit low-density lipoprotein oxidation and promote scavenging of reactive oxygen [1]. Avenanthramides have been implicated in inhibiting artherosclerosis [11]. Lignin and β-glucan of oat together exhibited choles-terol-lowering effect contributed to binding with bile acids [12]. The highest phenolic contents and antioxidant activities were extracted from defatted and air-classified OBC using 50% ethanol at 150˚C with microwave-irra- diation [13]. The total phenolic content in cereal extracts was reported in the order: buckwheat < wheat bran < oat expressed as gallic acid equivalent [14]. Most whole grain phenolics are in the bound form, such as corn (85%), wheat (76%), and oats (75%), whereas bound ferulic acid was significantly higher than free and soluble conjugated ferulic acid in corn, wheat, oats, and rice [5].
binations involving ether, diethyl ether, petroleum ether, chloroform, dichloroethane and methanol [16]. The most effective solvent for extracting phenolic antioxidants from wheat bran was 50% acetone by comparison to 70% methanol or ethanol, and 100% ethanol [17]. An 80% methanol extraction of whole oats gave substantially higher total phenolic compounds and exhibited higher antioxidant capacity than water extracts [18] whereas 80% methanol or ethanol was found to be efficient for extracting phenolic compounds from barley [19,20].
Recently, food products containing oat β-glucan hy-drocolloids have gained considerable interest by con-sumers for their health benefits. Oat β-glucan hydrocol-loids have numerous potential functional food applica-tions as a source of β-glucan as well as a fat substitute for making reduced calorie food products. It was reported that a 5% dispersion of Nutrim10 had the same consis-tency as coconut cream in several Thai desserts [21]. In addition, fat in muffins and frozen desserts was replaced with Nutrim10, and the effect on their flavor and texture was evaluated [22]. A recent study showed that shorten-ing in cakes could be substituted up to 40% by Nutrim10 without loss of cake quality [23]. Also, rheological and physical evaluation of jet-cooked oat bran has been stud-ied in low calorie cookies with a successful replacement of 20% shortening by oat β-glucan hydrocolloids [24].
Although studies of oat bran hydrocolloids in food ap-plications and rheological properties were conducted, information on phenolic contents and antioxidant activi-ties of oat β-glucan hydrocolloids has been limited. Also, the relationship between β-glucan contents and phenolic contents along with antioxidant activities needed more clarification. More fundamental studies on oat β-glucan hydrocolloids were needed on paste viscosity since it has a great influence on final product quality. Therefore, this study was conducted to investigate the effectiveness of temperature and solvents on phenolic and other antioxi-dant compounds from OBC and oat β-glucan hydrocol-loids along with their water absorption and paste viscosi-ties. These results could be valuable for developing and processing new functional foods having desirable texture and health benefits.
2. Materials and Methods
2.1. Samples
Oat bran concentrate was supplied by Quaker Oat. Nu-trim10, C-Ttrim20, C-Trim30, C-Trim50 were obtained from VDF FutureCeuticals (Momence, IL). Beta-Glucan 95% is available from Megazyme International Ireland Ltd. (Wicklow, Ireland).
2.2. Processing Procedure
Oat bran concentrate: by sieving OBC (Lot 18608408);
Nutrim10: oat bran concentrate was jet cooked, solids were removed by sieve, and liquid was drum-dried (Lot 35503475N170);
C-Trim20: starch was removed from oat bran concen-trate before jet-cooking, solids were removed by sieve, and liquid was drum-dried (Lot 1240000);
C-Trim30: starch was removed from oat bran contrate before jet-cooking, solids were removed by cen-trifugation, and supernatant was drum-dried (Lot PP6- JC-SL-CL-DD-2);
C-Trim50: starch was removed from oat bran contrate before jet-cooking, solids were removed by cen-trifugation, and the solids precipitated from supernatant by ethanol prior to freeze-drying (Lot PP6-JC-SL2-CS1- DS-FD2).
The β-glucan contents from FIA and Enzyme methods and molecular weight at peak were list in Table 1 [25].
2.3. Sample Extraction
Sample (0.1 g) was suspended in solvent and then heated in a water bath at 23˚C, 50˚C and 100˚C for 15 min with 10 ml of water or 50% ethanol respectively, mixing by Vortex in every five min using a vortex machine. For the solvent study, the extraction method was modified based upon a previous method [26,27]. Samples (0.5 ± 0.01 g) were extracted with 10 ml of 70% acetone, 70% ethanol , 70% methanol (solvent: water, 70/30, v/v) in duplicate , respectively, for 2 h at room temperature in a water bath having a shaker.
2.4. Total Phenolic Content
Phenolic content was determined by the Folin-Ciocalteau colorimetric method as described previously with minor modifications [28,29]. To 100 L of extract, 7.9 mL of deionized water and 0.5 mL of Folin-Ciocalteau reagent (F9252, Sigma Aldrich, St Louis, MO) were added, mixed on a vortex mixer, and 1.5 mL of 1.85 M Na2CO3
[image:2.595.309.537.640.735.2]was added after 15 min. Absorbance of samples was measured at 765 nm after 2 h. Gallic acid was used as a standard, and the results were expressed as mg of gallic acid equivalents per gon dry base (d.b.). Each sample was analyzed in triplicate.
Table 1. Processing condition, β-glucan content, and mo-lecular weight at peak [25].
β-glucan content (%) Sample ID Nominal
FIA method Enzyme method MW at Peak OBC 15 12.4 12.0 1.5 × 10⁶
Nutrim10 10 16.0 15.5 3.0 × 10⁵
C-Trim20 20 25.4 27.7 2.6 × 10⁵
C-Ttrim30 30 35.0 36.0 2.7 × 10⁵
2.5. Antioxidant Activity
Antioxidant activity procedure was modified based on a previous method by reacting 0.5 mL of extract with 0.5 mL of 200 M 2,2-diphenyl-1-picryl-hydrazyl (DPPH) in a cuvette for 40 min in dark followed by converting the cuvettes after adding reagent and prior to reading the absorbance at 515 nm [30]. Results were expressed as µmol of 6-hydroxy-2,5,7,8-tetramethylchroman-2-carbo- xylic acid (Trolox) equivalents per g (d.b.). Each sample was analyzed in triplicate.
2.6. Water Holding Capacity
The water-holding capacity was determined according to a modified procedure from an earlier study [31]. Samples (2 g) were mixed with 25 ml of deionized water, mixed using a vortex to make a suspension, held for 2 h, and followed by centrifugation at 1590 g for 15 min. The supernatant was decanted and the residue weight meas-ured. Each treatment was replicated twice. Water-holding capacity was calculated by the following equation:
Water holding capacity %Sample weight after centrifugation dry sample weight dry sample weight
100
2.7. RVA Measurements
Pasting properties of oat β-glucan hydrocolloids were measured using a Rapid Visco Analyzer (RVA-4, Perten Scientific, Springfield, IL). Samples (2.24 g d.b.) were made up to a total weight of 28 g with deionized water in a RVA canister (8% solids, w/w). Suspensions were equilibrated at 50˚C for 1 min, heated to 95˚C at a rate of 6.0˚C/min, maintained at 95˚C for 5 min, and cooled to 50˚C at rate of 6.0˚C/min and held at 50˚C for 2 min. For all test measurements, a constant paddle rotating speed (160 rpm) was used throughout the entire analysis except for 920 rpm in the first 10 s to disperse sample. Each sample was analyzed in duplicate.
2.8. Statistical Analysis
Standard deviation is reported for all measurements in tables and error bars in figures.
Data were analyzed using SAS software using analysis of variance with Tukey’s multiple comparison adjust-ment to determine significant differences (p < 0.05) be-tween treatments [32].
3. Results and Discussion
3.1. Phenolic Contents and Antioxidant Activities
3.1.1. Differences between Samples
C-Trim30, followed by C-Trim20, appeared to have the
highest soluble phenolic content using the same extrac-tion condiextrac-tions for all samples tested (Table 2). OBC and Nutrim10 had relatively lower β-glucan content (12.0% & 15.5%) than C-Trim30 (36.0%) and C-Trim50 (46.0%, Table 1) by enzyme method. The total soluble phenolic contents in OBC (5.30 mg/g, 6.01 mg/g) and Nutrim10 (5.80 mg/g, 6.06 mg/g) at room temperature were lower than C-Trim30 and C-Trim20 but comparable with that of C-Trim50 (5.74 mg/g, 5.46 mg/g) as showed in Table 2. The results suggest that the phenolic compounds were probably not related to β-glucan contents.
A similar trend was observed for antioxidant activity as that of phenolic contents in this study. C-Trim30 had the highest antioxidant activity, followed by C-Trim20 and others. C-Trim50 and Nutrim10 had similar antioxi-dant activity, but comparatively lower antioxiantioxi-dant activ-ity than C-Trim30 and C-Trim20. Interestedly, OBC had a higher phenolic content than C-Trim50. Perhaps these results may be contributed by some components of OBC since some oat bran cell walls were excluded from C- Trim50 by centrifugation and alcohol precipitation dur-ing processdur-ing. Studies have reported that the phenolic compounds are primarily bound to cell walls for most ce- real grains [5]. In addition, OBC did not undergo hydro-thermal-shearing, so the antioxidant activities could be reduced by oxidation during processing of C-Trim50. Antioxidants could be lost during oil processing proce-dure [33]. Furthermore, severe hydrolysis in extraction may alter structures that no longer represent the real an-tioxidant activity. Also, the measurement of the true “to-tal antioxidant activity” is still a challenge because of the diverse polarity of antioxidants and the fact that most of them are covalently bound to an insoluble matrix [34]. Total phenolic content has been reported to be higher in oat hulls than groats [35] but total antioxidant capacity was higher in oat groats [36]. Perhaps these prior refer-ences may partly explain the low antioxidant activities in oat hydrocolloids since they are produced from processed oat bran.
3.1.2. Effect of Extraction Temperature
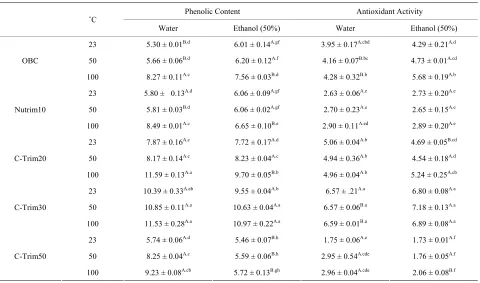
Table 2. Phenolic contents and antioxidant activities of oat β-glucan hydrocolloids at different temperatures.
Phenolic Content Antioxidant Activity ˚C
Water Ethanol (50%) Water Ethanol (50%)
23 5.30 ± 0.01B.d 6.01 ± 0.14A.gf 3.95 ± 0.17A.cbd 4.29 ± 0.21A.d
50 5.66 ± 0.06B.d 6.20 ± 0.12A.f 4.16 ± 0.07B.bc 4.73 ± 0.01A.cd
OBC
100 8.27 ± 0.11A.c 7.56 ± 0.03B.d 4.28 ± 0.32B.b 5.68 ± 0.19A.b
23 5.80 ± 0.13A.d 6.06 ± 0.09A.gf 2.63 ± 0.06A.e 2.73 ± 0.20A.e
50 5.81 ± 0.03B.d 6.06 ± 0.02A.gf 2.70 ± 0.23A.e 2.65 ± 0.15A.e
Nutrim10
100 8.49 ± 0.01A.c 6.65 ± 0.10B.e 2.90 ± 0.11A.ed 2.89 ± 0.20A.e
23 7.87 ± 0.16A.c 7.72 ± 0.17A.d 5.06 ± 0.04A.b 4.69 ± 0.05B.cd
50 8.17 ± 0.14A.c 8.23 ± 0.04A.c 4.94 ± 0.36A.b 4.54 ± 0.18A.d
C-Trim20
100 11.59 ± 0.13A.a 9.70 ± 0.05B.b 4.96 ± 0.04A.b 5.24 ± 0.25A.cb
23 10.39 ± 0.33A.ab 9.55 ± 0.04A.b 6.57 ± .21A.a 6.80 ± 0.08A.a
50 10.85 ± 0.11A.a 10.63 ± 0.04A.a 6.57 ± 0.06B.a 7.18 ± 0.13A.a
C-Trim30
100 11.53 ± 0.28A.a 10.97 ± 0.22A.a 6.59 ± 0.01B.a 6.89 ± 0.08A.a
23 5.74 ± 0.06A.d 5.46 ± 0.07B.h 1.75 ± 0.06A.e 1.73 ± 0.01A.f
50 8.25 ± 0.04A.c 5.59 ± 0.06B.h 2.95 ± 0.54A.cde 1.76 ± 0.05A.f
C-Trim50
100 9.23 ± 0.08A.cb 5.72 ± 0.13B.gh 2.96 ± 0.04A.cde 2.06 ± 0.08B.f
Samples (0.1 g) were extracted with 10 ml of corresponding solvents; Values of phenol contents are reported in mg gallic acid equivalents/g sample; values of antioxidant activities are reported in µmol Trolox equivalents/g sample; The different capital-letter superscripts within row for respect test, or different lower- letter superscripts within column indicate the significance (p < 0.05).
hanced - and β-tocopherol, - and β-tocotrienol, vanillin, ferulic and p-coumaric acid contents, but decreased ave-nanthramides [36]. The study of microwave irradiation on the stability of over 20 phenolic compounds found that all were stable at least for up to 20 min at 100˚C [38]. These studies indicated that phenolic compounds are fairly stable, and also suggested that high temperature may disrupt the cellular structure and liberate more phe-nolic compounds.
In contrast, the effect of temperature on antioxidant activity was not as apparent as that observed for phenolic content (Table 2). Although the slightly increasing trends for antioxidant activities were observed for both water and 50% ethanol; a significant increase was only found for the antioxidant activities of the 50% ethanol extracts when temperature increased from 50˚C to 100˚C for OBC (Table 2). An earlier study confirmed that rutin and quercetin, two of the most common polyphenolic antioxidants in buckwheat, were unstable in phosphate buffer at 97˚C in the presence of transition metal ions [39]. Moreover, high temperature may effectively solubi-lizes more phenolic compounds with no antioxidant ac-tivity, such as vitexin and isovitexin [40].
3.1.3. Effect of Ethanol Concentrations
Water and 50% ethanol were chosen for an optimum
extraction study. One hundred percent ethanol was not included in this study because 100% ethanol extracts revealed that it gave the lowest phenolic content com-pared to water and 50% ethanol at all temperatures of the heating method in a previous study [37]. Water tended to produce extracts with more total phenolic contents than 50% ethanol for C-Trim50 (Table 2) at all temperatures and comparable phenolic content with 50% ethanol for Nutrim10, C-Ttrim20, and C-Trim30. Water extracts had significantly higher phenolic content than extracts with 50% ethanol at 100˚C for all samples with the exception of C-Trim30 (Table 2). These studies were in agreement with a prior study that 50% ethanol extracted substan-tially more phenolic compounds than water and 100% ethanol when using microwave irradiated or heated with water bath at all temperatures [37].
With respect to antioxidant activity, however, no con-sistent advantage of 50% aqueous ethanol over water was observed (Table 2) as antioxidant activities in water ex-tracts were similar to that from 50% aqueous ethanol. These studies were in agreement with a previous study on extracts from distillers’ dried grain [41].
3.1.4. Effect of Solvent Types
[image:4.595.59.539.100.383.2]highest total phenolics of catechin equivalents and the highest scavenging activity by the DPPH method [42]. Also, methanol was reported to extract lower molecular weight phenolic compounds than using hexane or aque-ous acetone [43]. Another study on wheat suggested that 50% acetone would provide extracts with considerably higher antioxidant activity [17]. However, the differences in phenolic contents among the three solvent types were not very dramatic in this study. Using both 80% ethanol and 80% methanol extractions resulted in significantly higher soluble phenolic compounds than using 80% ace-tone for C-Trim30 (Table 3). Also, 80% ethanol ex-tracted significantly higher soluble phenolic compounds than 80% methanol for OBC and 80% acetone for C- Trim20. No significant differences were found in this study for Nutrim10, C-Trim50 and β-glucan95 regardless of solvent types. Significantly higher antioxidant activi-ties were found in the extracts using 80% ethanol and methanol compared to 80% acetone for the correspond-ing samples with the exclusion of C-Trim30 uscorrespond-ing 80% ethanol (Table 4). It implies that the antioxidants from oat β-glucan hydrocolloids probably are more stable in ethanol and methanol than acetone. No detectable anti-oxidant activities were found in β-Glucan95 for all three solvents used.
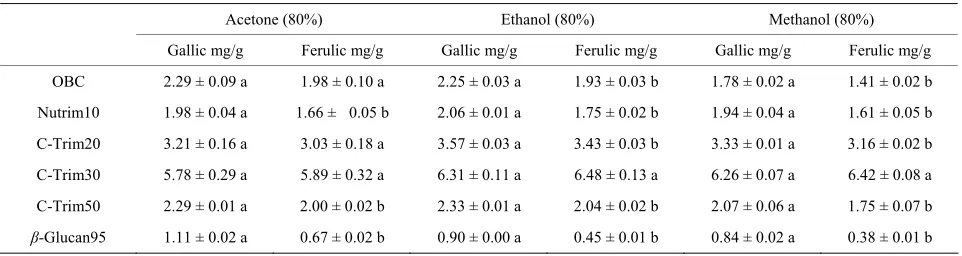
3.1.5. The Comparison of Gallic Acid and Ferulic Acid as Standards for Phenolic Analysis
Ferulic acid plays a significant role in the plant cell walls because it forms bonding between polysaccharides and proteins [44]. Ferulic acid is a well known antioxidant with potential for food and medical applications [45]. Gallic acid is commonly used for testing phenolic con-tent. This study was the first to report using ferulic acid as standard to determine phenolic content in corn bran. The statistical significant differences were found for most samples using 80% ethanol and 80% methanol be-tween the results using gallic acid or ferulic acid as stan-dard (Table 5). Overall, the results using gallic acid as standard were higher than the results using ferulic acid as standard. The results from this study provided an alterna-tive choice for using ferulic acid as standard to test phe-nolic content.
3.1.6. Effect of Sample and Solvent Ratio
[image:5.595.309.537.102.227.2]The effect of sample and solvent ratios on phenolic con-tents was also observed in this study. For example, phe-nolic content for C-Trim30 was 10.39 mg/g and 9.55 mg/g using water or ethanol, respectively (Table 2). In contrast, phenolic content for the same sample was 5.78, 6.31, 6.26 mg/g using 80% acetone, ethanol, methanol respectively. Different solvent types, such as water, 50% of ethanol, 80% of acetone, 80% of ethanol, and 80% of methanol made some differences. Sample and solvent
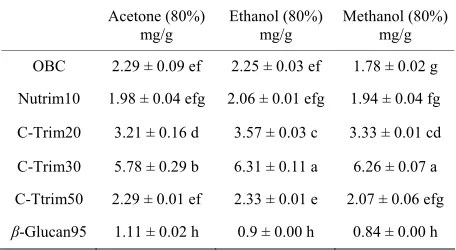
Table 3. Phenolic contents of oat β-glucan hydrocolloids.
Acetone (80%) mg/g
Ethanol (80%) mg/g
Methanol (80%) mg/g
OBC 2.29 ± 0.09 ef 2.25 ± 0.03 ef 1.78 ± 0.02 g
Nutrim10 1.98 ± 0.04 efg 2.06 ± 0.01 efg 1.94 ± 0.04 fg
C-Trim20 3.21 ± 0.16 d 3.57 ± 0.03 c 3.33 ± 0.01 cd
C-Trim30 5.78 ± 0.29 b 6.31 ± 0.11 a 6.26 ± 0.07 a
C-Ttrim50 2.29 ± 0.01 ef 2.33 ± 0.01 e 2.07 ± 0.06 efg
β-Glucan95 1.11 ± 0.02 h 0.9 ± 0.00 h 0.84 ± 0.00 h
[image:5.595.309.537.304.429.2]Samples (0.5 g) were extracted with 10 ml of corresponding solvents; Val-ues are reported in mg gallic acid equivalents/g sample; ValVal-ues with differ-ent letters indicate the significance (p < 0.05) for each comparison among all the treatments regardless solvent.
Table 4. Antioxidant activities of oat β-glucan hydrocol-loids.
Acetone (80%) µmol/g
Ethanol (80%) µmol/g
Methanol (80%) µmol/g
OBC 1.97 ± 0.00 b 2.08 ± 0.00 a 2.08 ± 0.00 a
Nutrim10 1.17 ± 0.01 j 1.38 ± 0.01 g 1.46 ± 0.01 f
C-Trim20 1.30 ± 0.00 h 1.54 ± 0.00 e 1.64 ± 0.02 d
C-Trim30 1.83 ± 0.00 c 1.86 ± 0.00 c 1.95 ± 0.01 b
C-Trim50 1.12 ± 0.01 k 1.24 ± 0.01 i 1.22 ± 0.02 i
β-Glucan95 - - -
Samples (0.5 g) were extracted with 10 ml of corresponding solvents; Val-ues were reported in µmol Trolox equivalents/g sample; ValVal-ues with differ-ent letters indicated the significance (p < 0.05) for each comparison among all the treatments regardless solvent; Values for β-Glucan95 were under detection limit.
ratio 1:20 was used for comparing the effect of solvent on phenolic contents according an earlier study [46]. Most likely, the lower phenolic values at the sample and solvent ratio of 1:20 (w/v) with 80% acetone, ethanol, and methanol could be caused by the low reactivity in the higher viscosity of the extraction slurry compared with ratio of 1:50. The result was in agreement with a previ-ous study where the total flavonoid content in buckwheat was gradually increased to 1:50 ratio [37].
3.2. Water-Holding Capacity
Water-holding capacities of oat β-glucan hydrocolloids are shown in Figure 1. Water-holding capacities of C- Trim30 and C-Trim50 were similar (1924% and 1951%) and both were significantly higher than other samples.
Table 5. Comparison of the phenolic contents of oat β-glucan hydrocolloids using gallic acid and ferulic acid.
Acetone (80%) Ethanol (80%) Methanol (80%)
Gallic mg/g Ferulic mg/g Gallic mg/g Ferulic mg/g Gallic mg/g Ferulic mg/g
OBC 2.29 ± 0.09 a 1.98 ± 0.10 a 2.25 ± 0.03 a 1.93 ± 0.03 b 1.78 ± 0.02 a 1.41 ± 0.02 b
Nutrim10 1.98 ± 0.04 a 1.66 ± 0.05 b 2.06 ± 0.01 a 1.75 ± 0.02 b 1.94 ± 0.04 a 1.61 ± 0.05 b
C-Trim20 3.21 ± 0.16 a 3.03 ± 0.18 a 3.57 ± 0.03 a 3.43 ± 0.03 b 3.33 ± 0.01 a 3.16 ± 0.02 b
C-Trim30 5.78 ± 0.29 a 5.89 ± 0.32 a 6.31 ± 0.11 a 6.48 ± 0.13 a 6.26 ± 0.07 a 6.42 ± 0.08 a
C-Trim50 2.29 ± 0.01 a 2.00 ± 0.02 b 2.33 ± 0.01 a 2.04 ± 0.02 b 2.07 ± 0.06 a 1.75 ± 0.07 b
β-Glucan95 1.11 ± 0.02 a 0.67 ± 0.02 b 0.90 ± 0.00 a 0.45 ± 0.01 b 0.84 ± 0.02 a 0.38 ± 0.01 b
[image:6.595.58.539.101.229.2]Samples (0.5 g) were extracted with 10 ml of corresponding; Values are reported in mg gallic acid equivalents/g sample; Values with different letters indicate the significance (p < 0.05) between treatments using same solvent in the respective row.
Figure 1. Water holding capacity of oat β-glucan hydrocol-loids. The means for each variable with different letters are significantly different (p 0.05).
of Nutrim10 was only 4% higher than OBC but the water holding capacity of Nutrim10 (880%) was almost three times of that from OBC (277%). Since Nutrim10, C- Trim20, C-Trim30, C-Trim50 were produced using jet- cooking technology (Table 1), thermal mechanical shear forces could have resulted in their molecular breakdown [24]. Studies of water holding capacity provide funda-mental information that helps explain RVA results.
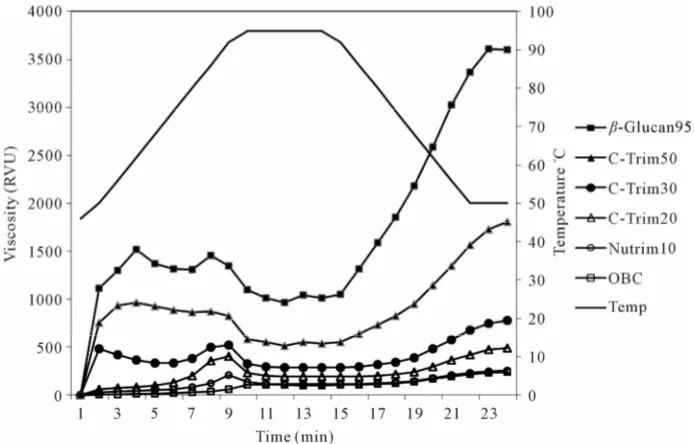
3.3. RVA Pasting Properties
The pasting curves of oat β-glucan hydrocolloids were obtained by RVA analysis. As shown in Figure 2, the pasting curves of five oat β-glucan hydrocolloids were all different. β-Glucan95, C-Trim50, and C-Trim30 peak viscosity occurred almost instantaneously as exhibited with a rapid initial viscosity. It suggested that oat hydro-colloids could be quickly gelatinized during heating which is characteristic of pregelatinized flour [47]. In addition, the higher β-glucan content of β-Glucan95 could be a major contributor to a high paste viscosity. A con-tinuous decline in the viscosity of β-Glucan95, C-Trim50 and C-Trim30 was observed during heating after the ini-tial peak, followed by an increase on cooling. It is known that the viscosity of completely gelatinized starch slurry
decreases during heating due to the slurry thinning [48].
β-Glucan95 had considerably higher final viscosity (Figure 2), suggesting that β-glucan resulted in entan-glement of molecules during cooling that formed a ma-trix with greater stability to heat and shear. A similar trend was observed for C-Trim50, as cooking resulted in a high final viscosity compared to other samples. Like-wise, OBC and Nutrim10 had lower paste viscosity than other samples probably due to the lower β-glucan content. No huge breakdowns (peak viscosity minus trough vis-cosity) were observed for oat β-glucan hydrocolloids, reflecting high stability under heat and shear. The steep and narrow peak viscosity curve was attributed to a com-plex formation between gelatinized starches and β-glucan in oats that was observed for jet-cooked oat bran concen-trate [49].
Textural improvement in properties of foods using oat
β-glucan hydrocolloids have been reported that theRVA data could provide useful information for food process-ing and product development. Initial paste viscosity sug-gested their suitability as ingredients for instant puddings and food formulations that require little heat during processing, such as, yogurt, smoothies and ice cream. For low paste viscosity of OBC and Nutrim10, they could be mixed with cereal flour, such as wheat flour, to make products such as breads and cookies for increasing their antioxidant activities.
4. Conclusion
[image:6.595.58.289.262.388.2]Figure 2. Rapid Visco-Analyser pasting curve of oat β-glucan hydrocolloids.
parent that oat β-glucan hydrocolloids and OBC could have great potential in providing nutritionally beneficial products based on their phenolic compounds and anti-oxidant capacity along with their unique water holding and paste viscosity. These oat β-glucan hydrocolloids, Nutrim10, C-Trim20 and C-Trim30, could provide ex-cellent food ingredients for improving nutrition and modifying texture of healthy food products.
REFERENCES
[1] C.-Y. Chen, P. E. Milbury, H.-K. Kwak, F. W. Collins, P. Samuel and J. B. Blumberg, “Avenanthramides and Phe-nolic Acids from Oats Are Bioavailable and Act Syner-gistically with Vitamin C to Enhance Hamster and Hu-man LDL Resistance to Oxidation,” Journal of Nutrition, Vol. 134, No. 6, 2004, pp. 1459-1466.
[2] A. Berg, D. König, P. Deibert, D. Grathwohl, A. Berg, M. W. Baumstark and I. W. Franz, “Effect of an Oat Bran Enriched Diet on the Atherogenic Lipid Profile in Patients with an Increased Coronary Heart Disease Risk,” Annals
of Nutrition and Metabolism, Vol. 47, No. 6, 2003, pp.
306-311. doi:10.1159/000072404
[3] N. Tapola, H. Karvonen, L. Niskanen, M. Mikola and E. Sarkkinen, “Glycemic Responses of Oat Bran Products in Type 2 Diabetic Patients,” Nutrition, Metabolism &
Car-diovascular Diseases, Vol. 15, No. 4, 2005, pp. 255-261.
doi:10.1016/j.numecd.2004.09.003
[4] J. He, R. H. Streiffer, P. Muntner, M. A. Krousel-Wood, and P. K. Whelton, “Effect of Dietary Fiber Intake on Blood Pressure: A Randomized, Double-Blind, Placebo- Controlled Trial,” Journal of Hypertension, Vol. 22, No. 1, 2004, pp. 73-80.
doi:10.1097/00004872-200401000-00015
[5] K. K. A. Adom and R. H. Liu, “Antioxidant Activity of
Grains,” Journal of Agriculture and Food Chemistry, Vol. 50, No. 21, 2002, pp. 6182-6187. doi:10.1021/jf0205099 [6] Z. Zduńczyk, M. Flis, H. Zieliński, M. Wróblewska, Z.
Antoszkiewicz and J. Juśkiewicz, “In Vitro Antioxidant Activities of Barley, Husked Oat, Naked Oat, Triticale, and Buckwheat Wastes and Their Influence on the Growth and Biomarkers of Antioxidant Status in Rats,”
Journal of Agricultural and Food Chemistry, Vol. 54,
2006, pp. 4168-4175. doi:10.1021/jf060224m
[7] T. Madhujith and F. Shahidi, “Antioxidative and Antipro-liferative Properties of Selected Barley (Hordeum vulgare
L.) Cultivars and Their Potential for Inhibition of Low-Density Lipoprotein (LDL) Cholesterol Oxidation,”
Journal of Agricutlural and Food Chemistry, Vol. 55,
2007, pp. 5018-5024. doi:10.1021/jf070072a
[8] G. E. Inglett, “Soluble Hydrocolloid Food Additives and Method of Making,” US Patent 6060519, 2000.
[9] C. F. Klopfenstein, “The Role of Cereal Beta-Glucans in Nutrition and Health,” Cereal Food Worlds, Vol. 33, 1988, pp. 865-869.
[10] D. M. Peterson, C. L. Emmons and A. H. Hibbs, “Pheno-lic Antioxidants and Antioxidant Activity in Pearling Fractions of Oat Groats,” Journal of Cereal Science, Vol. 33, No. 1, 2001, pp. 97-103. doi:10.1006/jcrs.2000.0347 [11] L. Liu, L. Zubik, F. W. Collins, M. Marko and M.
Mey-dani, “The Antiatherogenic Potential of Oat Phenolic Compounds,” Atherosclerosis, Vol. 175, No. 1, 2004, pp. 39-49. doi:10.1016/j.atherosclerosis.2004.01.044
[12] S. Sayar, J.-L. Jannink and P. J. White, “In Vitro Bile Acid Binding Activity within Flour Fractions from Oat Lines with Typical and High β-Glucan Amounts,”
Jour-nal of Agricultural and Food Chemistry, Vol. 54, 2006,
pp. 5142-5148. doi:10.1021/jf060384y
Anti-oxidant Capacity of Supercritical Carbon Dioxide-Treated and Air-Classified Oat Bran Concentrate Microwave-Ir- radiated in Water or Ethanol at Varying Temperatures,”
Food Chemistry, Vol. 108 , 2008, pp. 23-30.
doi:10.1016/j.foodchem.2007.08.060
[14] L. Brindzová, M. Mikulášová, M. Takácsová, S. Mošo- vská and A. Opattová, “Evaluation of the Mutagenicity and Antimutagenicity of Extracts from Oat, Buckwheat and Wheat Bran in the Salmonella/Microsome Assay,”
Journal of Food Composition and Analysis, Vol. 22, No.
1, 2009, pp. 87-90. doi:10.1016/j.jfca.2008.07.009 [15] R. H. Auerbach and D. A. Gray, “Oat Antioxidant
Ex-traction and Measurement—Towards a Commercial Process,” Journal of the Science of Food and Agriculture, Vol. 79, 1999, pp. 385-389.
doi:10.1002/(SICI)1097-0010(19990301)79:3<385::AID-JSFA260>3.0.CO;2-L
[16] K. J. Duve and P. J. White, “Extraction and Identification of Antioxidants in Oats,” Journal of the American Oil
Chemist’s Society, Vol. 68, No. 6, 1991, pp. 365-370.
doi:10.1007/BF02663751
[17] K. Zhou and L. Yu, “Effects of Extraction Solvent on Wheat Bran Antioxidant Activity Estimation,” Leben-
smittel-Wissenschaft und-Technologie, Vol. 37, 2004, pp.
717-721.
[18] H. Zieliński and H. Kozłowska, “Antioxidant Activity and Total Phenolics in Selected Cereal Grains and Their Different Morphological Fractions,” Journal of
Agricul-tural and Food Chemistry, Vol. 48, No. 6, 2000, pp.
2008-2016. doi:10.1021/jf990619o
[19] M. Bonoli, V. Verardo, E. Marconi and M. F. Caboni, “Antioxidant Phenols in Barley (Hordeum vulagare L.) Flour: Comparative Spectrophotometric Study among Extraction Methods of Free and Bound Phenolic Com-pounds,” Journal of Agricultural and Food Chemistry, Vol. 52, 2004, pp. 5195-5200. doi:10.1021/jf040075c [20] T. Madhujith, M. Izydorczyk and F. Shahidi,
“Antioxi-dant Properties of Pearled Barley Fractions,” Journal of
Agricultural and Food Chemistry, Vol. 54, 2006, pp.
3283-3289. doi:10.1021/jf0527504
[21] S. Maneepun, T. Boonpunt and G. E. Inglett, “Sensory and Nutritional Evaluation of Co-Processed Nutrim OB and Soy Flour in Thai Dishes,” 216th ACS National
Meeting, AGFD-099, Boston, 1998, p. 31.
[22] K. Warner and G. E. Inglett, “Flavor and Texture Char-acteristics of Foods Containing Nutrim Oat Bran Hydro-colloid,” 216th ACS National Meeting, AGFD-97, Boston, 1998, p. 31.
[23] S. Lee, G. E. Inglett and C. J. Carriere, “Effect of Nutrim Oat Bran and Flaxseed on Rheological Properties of Cakes,” Cereal Chemistry, Vol. 81, No. 5, 2004, pp. 637-642. doi:10.1094/CCHEM.2004.81.5.637
[24] S. Lee and G. E. Inglett, “Rheological and Physical Evaluation of Jet-Cooked Oat Bran in Low Calorie Cook-ies,” International Journal of Food Science and
Tech-nology,Vol. 41, No. 5, 2006, pp. 553-559.
doi:10.1111/j.1365-2621.2005.01105.x
[25] S. Kim, G. E. Inglett and S. X. Liu, “Content and
Mo-lecular Weight Distribution of Oat β-Glucan in Oatrim, Nutrim, and C-Trim Products,” Cereal Chemistry, Vol. 85, No. 5, 2008, pp. 701-705.
doi:10.1094/CCHEM-85-5-0701
[26] P. S. Thondre, L. Ryan and C. J. K. Henry, “Barley β-Glucan Extracts as Rich Sources of Polyphenols and Antioxidants,” Food Chemistry, Vol. 126, No. 1, 2011, pp. 72-77. doi:10.1016/j.foodchem.2010.10.074
[27] P. Sharma and H. S. Gujral, “Antioxidant and Polyphenol Oxidase Activity of Germinated Barley and Its Milling Fractions,” Food Chemistry, Vol. 120, 2010, pp. 673-678. doi:10.1016/j.foodchem.2009.10.059
[28] A. L. Waterhouse, “Determination of Total Phenolics,” In: R. E. Wrolstad, Ed., Current Protocols in Food
Analyti-cal Chemistry, John Wiley & Sons, New York, 2001, pp
I.1.1.1-I.1.1.8.
[29] L. Yu and K. Zhou, “Antioxidant Properties of Bran Ex-tracts from Platte Wheat Grown at Different Locations,”
Food Chemistry, Vol. 90, 2004, pp. 311-316.
doi:10.1016/j.foodchem.2004.04.007
[30] I. Şensoy, R. T. Rosen, C.-T. Ho and M. V. Karwe, “Ef-fect of Processing on Buckwheat Phenolics and Antioxi-dant Activity,” Food Chemistry,Vol. 99, No. 2, 2006, pp. 388-393. doi:10.1016/j.foodchem.2005.08.007
[31] B. I. O. Ade-Omowaye, K. A. Taiwo, N. M. Eshtiaghi, A. Angersbach and D. Knorr, “Comparative Evaluation of the Effects of Pulsed Electric Field and Freezing on Cell Membrane Permeabilisation and Mass Transfer during Dehydration of Red Bell Peppers,” Innovative Food
Sci-ence and Emerging Technologies,Vol. 4, 2003, pp. 177-
188. doi:10.1016/S1466-8564(03)00020-1
[32] SAS Institute Inc., “The SAS System for Windows,” Version 8e, Cary, 1999.
[33] A. Siger, M. Nogala-Kalucka and E. Lampart-Szczapa, “The Content and Antioxidant Activity of Phenolic Com-pounds in Cold-Pressed Plant Oils,” Journal of Food Lip-ids, Vol. 15, No. 2, 2008, pp. 137-149.
doi:10.1111/j.1745-4522.2007.00107.x
[34] V. Gökmen, A. Serpen and V. Fogliano, “Direct Meas-urement of the Total Antioxidant Activity of Foods: The ‘QUENCHER’ Approach,” Trends in Food Science and
Technology, Vol. 20, No. 6-7, 2009, pp. 278-288.
[35] Y. Xing and P. J. White, “Identification and Function of Antioxidants from Oat Groats and Hulls,” Journal of the
American Oil Chemist’s Society, Vol. 74, 1997, pp. 303-
307. doi:10.1007/s11746-997-0141-x
[36] S. Bryngelsson, L. H. Dimberg and A. Kamal-Eldin, “Ef-fects of Commercial Processing on Levels of Antioxi-dants in Oats (Avena sativa L.),” Journal of Agricultural
and Food Chemistry, Vol. 3, No. 50, 2002, pp. 1890-
1896. doi:10.1021/jf011222z
[37] G. E. Inglett, D. Chen, M. Berhow and S. Lee, “Antioxi-dant Activity of Commercial Buckwheat Flours and Their Free and Bound Phenolic Composition,”Food Chemistry, Vol. 125, 2010, pp. 923-929.
doi:10.1016/j.foodchem.2010.09.076
Micro-wave-Assisted Extraction,” Journal of Chromatography A, Vol. 1140, No. 1-2, 2007, pp. 29-34.
[39] D. P. Makris and J. T. Rossiter, “Heat-Induced, Metal- Catalyzed Oxidative Degradation of Quercetin and Rutin (Quercetin 3-O-Rhamnosylglucoside) in Aqueous Model Systems,” Journal of Agricultural and Food Chemistry, Vol. 48, No. 9, 2000, pp. 3830-3838.
doi:10.1021/jf0001280
[40] M. Watanabe, Y. Ohshita and T. Tsushida, “Antioxidant Compounds from Buckwheat (Fagopyrum esculentum
Möench) Hulls,” Journal of Agricultural and Food
Chemistry, Vol. 45, 1991, pp. 1039-1044.
doi:10.1021/jf9605557
[41] G. E. Inglett, D. J. Rose, D. G. Stevenson, D. Chen and A. Biswas, “Total Phenolics and Antioxidant Activity of Water and Ethanolic Extracts from Distillers Dried Grains with Soluble with or without Microwave Irradiation,”
Cereal Chemistry, Vol. 86, 2009, pp. 661-664.
doi:10.1094/CCHEM-86-6-0661
[42] T. Sun and C. T. Ho, “Antioxidant Activities of Buck-wheat Extracts,” Food Chemistry, Vol. 90, No. 4, 2005, pp. 743-749. doi:10.1016/j.foodchem.2004.04.035 [43] S. Guyot, N. Marnet, D. Laraba, P. Sanoner and J.-F.
Drilleau, “Reversed-Phase HPLC Following Thiolysis for Quantitative Estimation and Characterization of the Four Main Classes of Phenolic Compounds in Different Tissue Zones of a French Cider Apple Variety (Malus domestica
var. Kermerrien),” Journal of Agricultural and Food
Chemistry, Vol. 46, No. 5, 1998, pp. 1698-1705.
doi:10.1021/jf970832p
[44] P. Jankovska, J. Copikova, A. Sinitsya and M. Novotna, “The Effect of Ferulic Acid on the Structure of Plant Cell
Wall and Its Determination,” Czech Journal of Food Sci-ence, Vol. 18, 2000, pp. 182-183.
[45] H. D. Shin, S. McClendon, T. Le, F. Taylor and R. R. Chen, “A Complete Enzymatic Recovery of Ferulic Acid from Corn Residues with Extracellular Enzymes from Neosartorya Spinosa NRRL185,” Biotechnology and Bio-
engineering, Vol. 95, No. 6, 2006, pp. 1108-1115.
doi:10.1002/bit.21056
[46] H. Zhao, J. Dong, J. Lu, J. Chen, Y. Li, L. Shan, Y. Lin, W. Fan and G. Gu, “Effects of Extraction Solvent Mix-tures on Antioxidant Activity Evaluation and Their Ex-traction Capacity and Selectivity for Free Phenolic Com-pounds in Barley (Hordeum vulgare L.),” Journal of
Ag-ricultural and Food Chemistry, Vol. 54, No. 19, 2006, pp.
7277-7286. doi:10.1021/jf061087w
[47] H.-M. Lai and H.-H. Cheng, “Properties of Pregelatinized Rice Flour Made by Hot Air or Gum Puffing,”
Interna-tional Journal of Food Science and Technology, Vol. 39,
No. 2, 2004, pp. 201-212.
doi:10.1046/j.0950-5423.2003.00761.x
[48] M. Guha, S. Zakiuddin and S. Bhattacharya, “Effect of Barrel Temperature and Screw Speed on Rapid Vis-coanalyser Pasting Behavior of Rice Extrudate,”
Interna-tional Journal of Food Science & Technology, Vol. 33,
1998, pp. 259-266.
doi:10.1046/j.1365-2621.1998.00189.x
[49] D. G. Stevenson, F. J. Eller, M. Radosavljević, J. Jane and G. E. Inglett, “Characterisation of Oat Bran Products with and without Supercritical Carbon Dioxide Extrac-tion,” International Journal of Food Science & Technol-ogy, Vol. 42, No. 12, 2007, pp. 1489-1496.
![Table 1. Processing condition, β-glucan content, and mo-lecular weight at peak [25].](https://thumb-us.123doks.com/thumbv2/123dok_us/9284865.422798/2.595.309.537.640.735/table-processing-condition-glucan-content-lecular-weight-peak.webp)