Abstract—Twitter is a popular social networking service that
is used for communication and information sharing. Twitter messages or tweets may contain opinion and hence become a major source for social opinion analysis. This paper presents a development of a Twitter analysis tool that can collect, analyze and visualize a set of tweets in Thai. We filter tweets of interest using a keyword and discover topics that are mentioned in the tweets, using a topic modeling technique. Then sentiment analysis is used to classify polarity of the tweets toward the mentioned topics. Finally, the topics and the associated sentiment are visualized in a streamgraph. In this way, the tool can be useful in a context that needs a better view of public opinion on a particular keyword, or subject, during a period of time. We can observe on what topics people talk about that particular subject and how they feel toward them. In an evaluation, the tool shows good performance on both topic modeling and sentiment analysis.
Index Terms—Twitter, topic modeling, sentiment analysis,
visualization, streamgraph
I. INTRODUCTION
ocial networking is now a primary channel for communication and information sharing on the Internet. Data produced from Twitter, Instagram, Facebook, and other social networking services have become a major source for social opinion analysis. Among the social networking services, Twitter [1] allows users to communicate with their network of people to share messages, conversations, activities, interests, news, or events, in Twitter messages called Tweets. The content of each tweet is 140 characters-long and may address certain topics as well as contain sentiment, e.g., “นี่คือโทรศัพท์มือถือที่ดีที่สุดเท่าที่เคยมีมา” (This is the best mobile phone ever) expresses a positive opinion on the mobile phone topic, while “อาคารท าให้ผู้คนเสียชีวิตในเหตุการณ์ แผ่นดินไหว” (It’s the buildings which kill people in an earthquake) shows negative sentiment in the earthquake topic. Twitter hence has been used as a data source for social opinion analysis.
Since the volume of Twitter messages is large and new messages are tweeted constantly over time, it will be useful if
Manuscript received December 21, 2016; revised January 8, 2017. J. Lertsiwaporn is with the Department of Computer Engineering, Faculty of Engineering, Chulalongkorn University, Bangkok 10330, Thailand (e-mail: [email protected]).
T. Senivongse is with the Department of Computer Engineering, Faculty of Engineering, Chulalongkorn University, Bangkok 10330, Thailand (corresponding author phone: +66 2 2186996; fax: +66 2 2186955; e-mail: [email protected]).
the collection, analysis, and display of Twitter messages over time can be facilitated. Specifically, it might be interesting to learn what topics about a particular subject are mentioned by the public during a period of time and how they feel about them. To address this issue, this paper presents a development of a web application as a Twitter analysis tool to collect, analyze, and visualize a set of tweets in the Thai language. The main contribution of the tool is that it is a generic Twitter analysis tool that integrates a topic modeling technique with a sentiment analysis and gives a combined view of public opinion about a particular subject over a period of time. That is, a user can use the tool to filter tweets of interest using a keyword and identify topics that are mentioned in the tweets by a topic modeling technique called Latent Dirichlet Allocation (LDA) [2]. Then the Maximum Entropy classification [3] is used to analyze sentiment of the tweets toward the mentioned topics. Finally, the topics and the associated sentiment are visualized in a streamgraph that shows, over a time period, the topics of the keyword which people have mentioned in tweets, the volume of each topic, and the sentiment toward each topic. In this way, the tool can be useful in a context that needs a better view of public opinion over time with regard to a particular keyword or subject. For example, it might be interesting to see what topics of a certain subject are of interest to the public. Such information can be beneficial in several ways such as monitoring public view on social issues and supporting marketing strategies, buying decisions, or product improvements etc. We also discuss the performance and limitations of the tool.
This paper is organized as follows. Section II discusses related work. Section III presents the methodology. Section IV describes an experiment, results, and performance of the tool. Finally, the limitations of the tool are discussed in section V, and the paper concludes in section VI.
II. RELATED WORK
In this section, we focus only on Twitter-based research and present some examples of the work related to topic modeling, sentiment analysis, and visualization.
A. Topic Modeling for Twitter
On topic modeling, Zhao and Jiang [4] experiment on whether Twitter can be regarded as a faster news feed that contains similar contents as traditional news media. Based on LDA, they use their Twitter-LDA topic modeling technique to identify topics from Twitter messages and New York
Time-Based Visualization Tool for Topic
Modeling and Sentiment Analysis of Twitter
Messages
Jaraspong Lertsiwaporn and Twittie Senivongse
Times. Then they use text mining to compare similarity between topics from the two sources, with regard to categories and types of the topics. The finding is that both Twitter messages and NY Times articles cover topics of similar categories and types, but the distributions over different categories and types are different. The work by Hong and Davison [5] compare the basic LDA technique for topic modeling with the author-topic model that extends LDA to discover both topics and authors of topics on Twitter messages. These works inspire us in using a topic modeling technique to discover topics of a particular subject which are mentioned in tweets.
B. Sentiment Analysis for Twitter
On sentiment analysis, examples are the work by Shahheidari et al. [6] in which a corpus of positive and negative tweets, i.e., tweets with happy emoticon and sad emoticon respectively, are built. The corpus is used to train a Naïve Bayes model for classifying sentiment of tweets in five different domains, i.e., news, finance, job, movie, and sport. The result shows that their corpus can be used to classify new tweets in different domains. Another work by Kouloumpis [7] conducts sentiment analysis for Twitter based on classifiers built from a hashtagged dataset of the University of Edinburgh, an emoticon-based dataset, and a combination of both. It is concluded that features from an existing sentiment lexicon (e.g., polarity of words in tweets) are somewhat useful in conjunction with microblogging features such as emoticon, abbreviations, and slangs. Go et al. [8] classify Twitter messages using Naive Bayes, Maximum Entropy, and SVM classifiers. The training data are Twitter messages with emoticons and the performance is quite similar for the three classifiers.
On sentiment analysis of tweets in the Thai language, a social media analysis tool called S-Sense (or Social Sensing) [9] offers such functionality. S-Sense in fact supports not only sentiment analysis but also keyword and trend analysis of comments and opinion on social media like Twitter, Facebook, YouTube, and web boards. It is used in applications like POP [10] that analyzes sentiment of Thai people from their tweets in near real-time, and S-Sense Tourism [11] that analyzes sentiment toward tourist attractions in Thailand. Although these applications provide sentiment analysis, topic modeling is not supported.
From these researches, it is seen that Twitter has continually been the subject of opinion mining. We follow the methodology used generally by these researches to conduct sentiment analysis of tweets.
C. Visualization for Twitter
We are inspired the most by the following work. First, Belmonte [12] presents an application that collected tweets during a public address called the State of the Union Address, i.e., tweets with the hashtag “#SOTU”. Then the data set was mined for the topics that were discussed, and then the identified topics were visualized as a streamgraph. The graph hence showed the evolution of the topics discussed minute by minute on Twitter during the SOTU address. Another work is the tool called Sentiment Viz [13]. The tool can visualize recent tweets that contain the
user-specified keyword in various views. For example, on the sentiment view, the tool uses a sentiment dictionary to estimate sentiment of each tweet from sentiment of words contained in the tweet. On the topic view, the tool displays tweets in a cluster if they address a common topic, or as a singleton if they do not belong to any common topics. On the timeline view, the tool shows the number of tweets and sentiment of the tweets at each particular time over a period. Our tool adapts from these two researches. Like the Sentiment Viz tool [13], we allow the user to collect recent tweets that contain a certain keyword of interest but, unlike Sentiment Viz, we analyze tweets in Thai, use the LDA to discover topics that are mentioned in the tweets, use Maximum Entropy supervised learning for sentiment analysis, and combine all the topic view, sentiment view, and timeline view together as a streamgraph. Then, like [12], the user can see the evolution of the topics discussed under the specified keyword over a time period.
III. METHODOLOGY
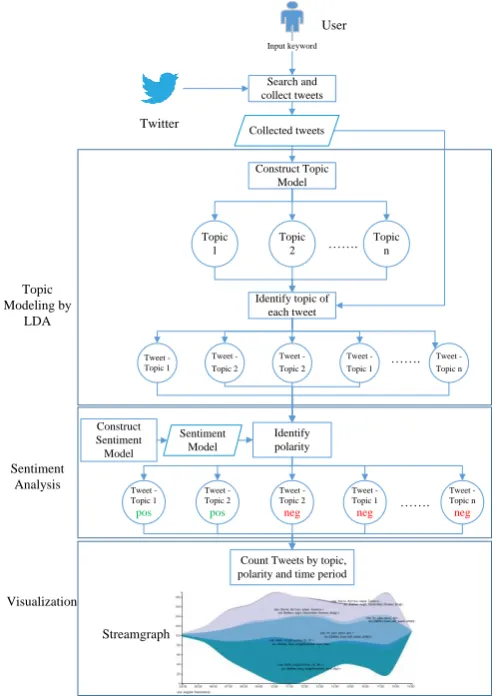
This section describes the methodology behind the tool. The overview of the tool in Fig. 1 depicts our Twitter analysis in three steps.
The first step is topic modeling. When a user inputs a keyword to specify a particular subject of interest, the tool will search and collect tweets that contain the keyword. Then the LDA topic modeling technique is used to identify topics that are mentioned in those collected tweets.
Topic Modeling by
LDA
Search and collect tweets
Input keyword
User
Topic 1
Topic 2
Topic n
.
Construct Topic Model
Identify topic of each tweet
Tweet - Topic 1
Tweet - Topic 2
Tweet - Topic 2
.
Tweet - Topic 1
Tweet - Topic n
Identify polarity
Sentiment Analysis
Construct Sentiment Model
Tweet - Topic 1
pos
Tweet - Topic 2
pos
Tweet - Topic 2
neg .
Tweet - Topic 1
neg
Tweet - Topic n
neg
Visualization
Count Tweets by topic, polarity and time period
Streamgraph
Collected tweets
[image:2.595.307.555.426.774.2]Sentiment Model
The second step is sentiment analysis. Given the tweets under the identified topics, the tool analyzes the positive or negative polarity of those tweets. In the final step, the tweets and their associated topics and polarity are visualized in a streamgraph. The detail of each step is as follows.
A. Search and Collect Tweets
In this step, we use a keyword as a search argument to query the Twitter Search API [14] to obtain tweets that contain the keyword. Twitter Search API allows access to Twitter data, such as user profile, follower data, recent tweets and more. To use the API, a Twitter application is required to authenticate using OAuth, so we have to build the application on the Twitter developer site. We use the search/tweet endpoint to collect recent tweets and send the following arguments to the endpoint: 1) q which is the keyword to query, 2) lang which is “th” since we target on tweets in Thai, and 3) count which is the number of tweets to query and we specify 100 as it is the maximum number that can be queried per request. Given this query limit, we hence have to repeat sending the request to gather more tweets.
Other limits set by the Search API are that at most 450 requests can be sent in a 15-minute window for each application authentication, and that the returned data will be the tweets within the past 7 days. The API returns data in the JSON format which comprise several properties, but we collect only the properties “text” and “created_at” for our work.
B. Topic Modeling by LDA
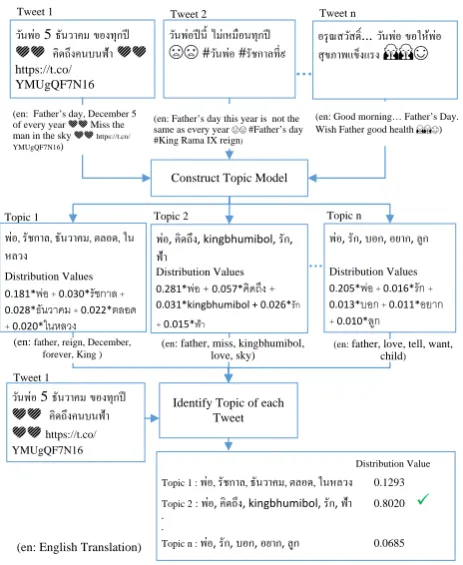
In this step, we identify the topics that are related to the keyword that is used to collect tweets in the previous step. We use the Latent Dirichlet Allocation (LDA) [2] technique that has become a standard tool in topic modeling. LDA is a probabilistic model for discovering abstract topics that occur in a collection of documents, i.e., tweets in our case. It uses a bag of words approach and treats each document, i.e., a tweet, as a vector of word counts. Each document is represented as a probability distribution over some topics, and each topic is represented as a probability distribution over a number of words. As shown in Fig. 2, each tweet could mention multiple topics and each topic could be formed by a number of words. Some words could be under multiple topics. Thus LDA will discover the topics by calculating the distribution value of topics in each tweet. In this paper, we use gensim [15] for LDA. It provides a free Python library that contains several methods to train a model and identify topics for input tweets. The following steps are taken.
1) Prepare a corpus for training the LDA model. We use the tweets collected in the previous step as a corpus, and aggregate all tweets into a collection of documents. The documents are segmented into words, and then stopwords, URLs, and words that appear once in the corpus are removed, so that the corpus contains only significant words for topic modeling. We use word segmentation from PyICU of Python available on PyPI [16] and Thai stopwords list from RANKS NL [17].
Tweet 1 Tweet n
Construct Topic Model
Topic 1 Topic 2
่อ, ร ช า , นวาคม, ต อ , ใน ห ว
Distribution Values 0.181* + 0.030* +
0.028* + 0.022*
+ 0.020*
่อ, คิ , kingbhumibol, ร ,
้า
Distribution Values 0.281* + 0.057* + 0.031*kingbhumibol + 0.026*
+ 0.015*
่อ, ร , อ , อยา , ู
Distribution Values 0.205* + 0.016* +
0.013* + 0.011*
+ 0.010*
Identify Topic of each Tweet
Distribution Value Topic 1 : ่อ, ร ช า , นวาคม, ต อ , ในห ว 0.1293
Topic 2 : ่อ, คิ , kingbhumibol, ร , ้า 0.8020 ü .
.
Topic n : ่อ, ร , อ , อยา , ู 0.0685 ว น ่อ 5 นวาคม อ ท ี
คิ คน น ้า
https://t.co/ YMUgQF7N16
ว น ่อ ีนี ม่เหม อนท ี #ว น ่อ #ร ช า ที่ Tweet 2
อร สว ส ิ ... ว น ่อ อให้ ่อ ส า ร
ว น ่อ 5 นวาคม อ ท ี
คิ คน น ้า
https://t.co/ YMUgQF7N16 Tweet 1
(en: Father’s day, December 5 of every year Miss the man in the sky https://t.co/ YMUgQF7N16)
(en: Good morning Father’s Day. Wish Father good health )
(en: father, reign, December, forever, King )
(en: father, miss, kingbhumibol, love, sky)
(en: father, love, tell, want, child)
Topic n
(en: English Translation)
[image:3.595.307.539.50.333.2](en: Father’s day this year is not the same as every year #Father’s day #King Rama IX reign)
Fig. 2. LDA process for tweets.
2) Contruct topic model by LDA using gensim. First, we use the class Dictionary in the namespace corpora to construct a dictionary from the remaining words from the previous step. With the capability of the method
doc2bow of Dictionary, we will obtain a collection of vectors of the documents. Each vector contains <word id, word counts> pairs for all the words that appear in the document. Second, we use the class LdaMulticore in the namespace models to train LDA. We choose the multicore approach in order to speed up the training process. At the end of this step, we obtain a model of topics that are mentioned in the tweets. Since each topic could be formed by multiple words, we represent a topic by a number of words, e.g., the five most contributing words, having the highest distribution values, for that topic (see Fig. 2).
3) Identify a topic of each tweet. We loop through the same collection of tweets to discover a topic of each tweet. We use the capability of the gensim model to do this step. Since a tweet could mention multiple topics, we assign a topic with the highest distribution value to the tweet (e.g., Topic 2 in Fig. 2 is assigned to Tweet 1). At the end of this step, we identify a topic of each tweet in the collection.
C. Sentiment Analysis
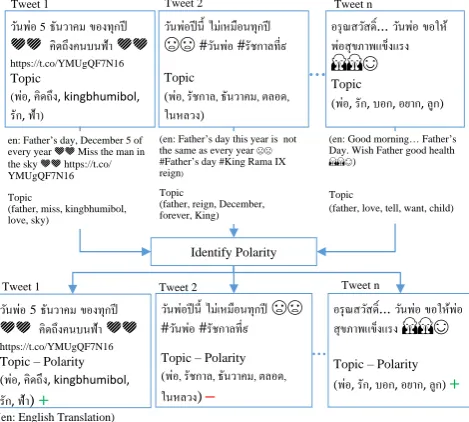
After a topic in each tweet is identified, sentiment analysis is conducted to classify polarity of each tweet. We gather tweets to build a corpus to train a sentiment model. Emoticons are used to label positive and negative tweets in the data set. We use the Natural Language Toolkit (NLTK) [18] that provides a Python library for Maximum Entropy classification.
classifier, and then use the method classify of the classifier to classify polarity of each tweet. In this paper, we are interested in positive and negative polarity. At the end of this step, we obtain a collection of tweets with their created time, topic, and polarity (see Fig. 3). The tweets will be used in the visualization in the next step.
D. Visualization
Visualization is a technique that transforms data to image. The classified tweets are visualized in a form of a streamgraph. The x-axis shows the range of the timestamps, i.e., the property created_at, of the collected tweets, and the y-axis shows the number of tweets in each topic. We use Data-Driven Documents (D3) [19] which is an open source JavaScript library for visualizing data on web browsers. One of its visualization tools is Area Chart which is used to create a streamgraph. Area Chart is, by nature, not a streamgraph but can be implemented to visualize a streamgraph. We determine the number of tweets that are posted at specific points in time and stack the data with the “wiggle” offset layout. Then D3 will display the area chart as a streamgraph.
The user interface of the tool is shown in Fig. 4. The user can input a keyword and the result is shown as a streamgraph depicting the number of tweets in different topics with positive or negative opinion that vary over a range of tweet time.
Tweet 1 Tweet n
ว น ่อ5 นวาคม อ ท ี คิ คน น ้า https://t.co/YMUgQF7N16
Topic
( ่อ, คิ , kingbhumibol,
ร , ้า)
ว น ่อ ีนี ม่เหม อนท ี #ว น ่อ #ร ช า ที่
Topic
( ่อ, ร ช า , นวาคม, ต อ ,
ในห ว )
Tweet 2
อร สว ส ิ ... ว น ่อ อให้ ่อส า ร
Topic
( ่อ, ร , อ , อยา , ู )
Identify Polarity
ว น ่อ5 นวาคม อ ท ี
คิ คน น ้า
https://t.co/YMUgQF7N16
Topic – Polarity ( ่อ, คิ , kingbhumibol,
ร , ้า) +
ว น ่อ ีนี ม่เหม อนท ี
#ว น ่อ #ร ช า ที่
Topic – Polarity ( ่อ, ร ช า , นวาคม, ต อ ,
ในห ว )–
อร สว ส ิ ... ว น ่อ อให้ ่อ ส า ร
Topic – Polarity ( ่อ, ร , อ , อยา , ู ) +
Tweet 1 Tweet 2 Tweet n
(en: Father’s day this year is not the same as every year
#Father’s day #King Rama IX reign)
Topic
(father, reign, December, forever, King) en: Father’s day, December 5 of
every year Miss the man in the sky https://t.co/ YMUgQF7N16
Topic
(father, miss, kingbhumibol, love, sky)
(en: Good morning Father’s Day. Wish Father good health
)
Topic
(father, love, tell, want, child)
[image:4.595.52.287.373.584.2](en: English Translation)
Fig. 3. Sentiment analysis for tweets.
Fig. 4. User interface of the tool and streamgraph visualization.
IV. EXPERIMENT,RESULTS, AND PERFORMANCE
This section describes an experiment and results, including the performance of the tool. Steps taken in the experiment are as follows.
A. Input Keyword
Using the tool, we used the keyword “วันพ่อ” (or Father’s Day) to analyze topics and sentiment of tweets on Father’s Day in Thailand on December 5, 2016. Please note that this day also marks the birthday of the late King Bhumibol Adulyadej of Thailand who was not only the King but also like the Father of the entire nation. Since his recent passing on October 13, 2016, the Thais have mourned and paid tribute to his life and great contribution to the well-being of the Thai people.
B. Search and Collect Tweets
On December 5, 2016, we queried the Twitter Search API using the following arguments: 1) q = “วันพ่อ”, 2) lang = “th”, and 3) count = 100 for the maximum number of tweets per request. We repeated the query five times and each time, added another argument max_id so that the queried returned the next 100 tweets with the ID less than (older than) or equal to the specified ID. The Search API returned a collection of tweets that contained the keyword “วันพ่อ”, and we filtered out retweeted messages. While avoiding reaching the Search API limit in the experimental setting, we repeated the query and finally obtained 1,245 unique tweets. Their tweet time was between 3:56:08 and 19:05:14. The “text” and “created_at” properties were collected from each tweet for the next step.
C. Identify Topic of Each Tweet
We used the collected tweets, available on our GitHub [20], as a corpus for training the LDA model to identify different topics mentioned in the tweets. Among those topics, the top three topics with the highest distribution values were selected as the model for assigning a topic to each tweet. Each topic was represented by five words with the highest distribution values. As shown previously in Fig. 2, the top three topics were 1) พ่อ, คิดถึง, kingbhumibol, รัก, ฟ้า (or father, miss, kingbhumibol, love, sky), 2) พ่อ, รัชกาล, ธันวาคม, ตลอด, ในหลวง (or father, reign, December, forever, King), and 3) พ่อ, รัก, บอก, อยาก, ลูก (or father, love, tell, want, child). The first topic revealed that Thai people expressed their love at the remembrance of the late King in heaven (literally, in the sky). The second topic showed that Thai people mentioned about their forever King and Father on this significant day in December. In addition, for the third topic, Thai people also expressed their love to their own father in the tweets on this day.
Once the top three topics were obtained, the tool then calculated the distribution value of every one of these topics for each tweet, and assigned the topic with the highest distribution value to the tweet.
[image:4.595.47.290.610.764.2]were talking about. It was found that 90% of the tweets had a topic assigned reasonably. For the rest, the keyword was not found in the messages, but in the URLs, and the message contents were neither related to the keyword.
D. Identify Polarity of Each Tweet
To analyze sentiment of each tweet, we gathered tweets with polarity by using the keywords “:)” (or smiley face) and “:(” (sad face). We collected 8,600 tweets for each polarity during August 9 and August 21, 2016 to build a bigram training data set. (It is available on our GitHub [20].) This data set was then used to construct a Maximum Entropy sentiment classifier. After that, each tweet that had been assigned a topic in the previous step was classified as having either a positive (+) or negative (-) opinion toward the assigned topic. For example, each tweet was classified as one of the following topic-polarity classes: (พ่อ, คิดถึง, kingbhumibol, รัก, ฟ้า) +, (พ่อ, คิดถึง, kingbhumibol, รัก, ฟ้า) ⁻, (พ่อ, รัชกาล, ธันวาคม, ตลอด, ในหลวง) +, (พ่อ, รัชกาล, ธันวาคม, ตลอด, ในหลวง) ⁻, (พ่อ, รัก, บอก, อยาก, ลูก) + or (พ่อ, รัก, บอก, อยาก, ลูก) ⁻.
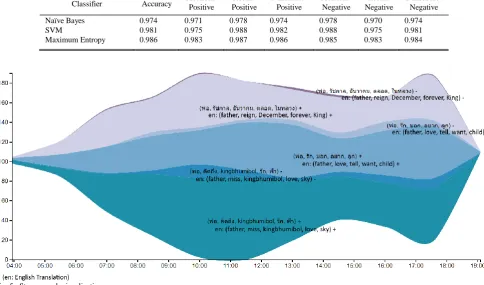
On performance of sentiment analysis, we compared the performance of the Maximum Entropy, Naïve Bayes, and Support Vector Machine (SVM) classifiers. Similarly to Maximum Entropy, we also used the Python library of the NLTK [18] to build the Naïve Bayes model. For SVM classification, we used the scikit-learn Python library [22] to build the SVM model with a linear kernel, as recommended for text classification [23]. We used 10-fold cross validation to validate the performance of the three classifiers and their good performance is shown in Table I. We selected the Maximum Entropy classifier for the implementation of the tool due to its highest accuracy and F-measure.
E. Count Tweet
In this step, we counted the number of tweets in each topic-polarity class at different points in time.
F. Visualize in a Streamgraph
In the last step, the data from the previous step were presented in a streamgraph in Fig. 5. Each area in the graph is labeled with topic-polarity, and its size at a specific time reflects the number of tweets at the time. We can see how the volume and polarity of the topics vary over a period of time. For example, on December 5, 2016, people tweeted more in the late morning during 10:00-12:00 and in the early evening during 17:00-18:00. In addition, over months, the Thais have begun to accept the loss of the King and they marked this significant day in a positive way, expressing love and respect to the late King and their own fathers, more than grieving for the passing.
V. DISCUSSION
There are some limitations in the current methodology of the tool. First, due to the limits posed by the Twitter Search API such that the collected tweets cannot be older than seven days and 450 queries can be made per 15 minutes, to obtain large volume of tweets or to obtain tweets over an extended period of time, the tweet collection step would take longer. However, this might be the case if the tool is used, for example, in a context in which public opinion should be analyzed for an extended period of time. In the experiment, we aimed to demonstrate the methodology of the tool, so the smaller number of tweets were collected and the tweets were visualized over a short period of time.
TABLEI
PERFORMANCE OF SENTIMENT CLASSIFIERS
Classifier Accuracy Precision-Positive Positive Recall- F-measure-Positive Precision-Negative Negative Recall- F-measure-Negative
Naïve Bayes 0.974 0.971 0.978 0.974 0.978 0.970 0.974
SVM 0.981 0.975 0.988 0.982 0.988 0.975 0.981
[image:5.595.52.537.492.777.2]Maximum Entropy 0.986 0.983 0.987 0.986 0.985 0.983 0.984
Despite the good performance in topic modeling, the small size and informal style of tweet messages sometimes do not yield significant topics. In addition, to obtain opinion in a certain context such as brand monitoring or customer feedback, it is better to conduct topic modeling and sentiment analysis on comments from specific sources of such a brand or organization, e.g., websites and fanpages, rather than relying on tweets. This Twitter analysis tool is better viewed as a tool to give supporting opinion or to analyze opinion toward more general subjects.
VI. CONCLUSION
In this paper, we describe the methodology and development of a generic Twitter analysis tool for the Thai language. The integration of the topic modeling technique and sentiment analysis allows users to view different topics that are mentioned in Twitter messages of interest, and learn about public opinion toward the topics and the volume of such opinion. The visualization in a streamgraph allows the users to view and compare opinion at an instant of time and how they vary over time. Despite the aforementioned limitations, the users can also use the tool to generate different streamgraphs to compare how the topics of a subject change over time and even compare opinion about different subjects.
To further enhance the tool, we can, in addition, use the Twitter Streaming API so that the analysis can also be carried out on the current tweet data. The labeling of the training data for sentiment analysis can be improved to consider sentiment lexicon, slangs, and hashtags as well.
REFERENCES
[1] Twitter, https://twitter.com/. Last accessed: Dec 22, 2016.
[2] D. M. Blei, A. Y. Ng, and M. I. Jordan, “Latent dirichlet allocation,”
J. Machine Learning Research, vol. 3, pp. 993-1022, 2003.
[3] A. Berger, S. Della, and V. Della, “A maximum entropy approach to natural language processing,” J. Computational Linguistics, vol. 22, issue 1, pp. 39-71, Mar. 1996.
[4] X. Zhao and J. Jiang, “An empirical comparison of topics in Twitter and traditional media,” Technical Paper Series, School of Information Systems, Singapore Management University, Jan. 2011.
[5] L. Hong and B. D. Davison, “Empirical study of topic modeling in Twitter,” in Proc. 1st Workshop Social Media Analytics (SOMA’10), 2010, pp. 80-88.
[6] S. Shahheidari, H. Dong, M. N. Ridzuan, and B. Daud, “Twitter sentiment mining: A multi domain analysis,” in Proc. 7th Int. Conf. Complex, Intelligent, and Software Intensive Systems (CISIS), 2013, pp. 144-149.
[7] E. Kouloumpis, T. Wilson, and J. Moore, “Twitter sentiment analysis: The good the bad and the OMG!,” in Proc. 5th Int. AAAI Conf. Weblogs and Social Media, 2011, pp. 538-541.
[8] A. Go, R. Bhayani, and L. Huang, “Twitter sentiment classification using distant supervision,” Technical Report, Stanford University, 2009.
[9] S-Sense: Social Sensing, http://www.ssense.in.th/. Last Accessed: Dec. 22, 2016.
[10] POP, http://pop.ssense.in.th/. Last Accessed: Dec. 22, 2016.
[11] S-Sense Tourism, http://ssense.in.th/tourism/. Last Accessed: Dec. 22, 2016.
[12] N. G. Belmonte, “Extracting and visualizing insights from real-time conversations around public presentations,” in Proc. 2014 IEEE Conf. Visual Analytics Science and Technology (VAST), 2014, pp. 225-226.
[13] Sentiment Viz, Tweet Sentiment Visualization, Available:
https://www.csc.ncsu.edu/faculty/healey/tweet_viz/tweet_app/. Last Accessed: Dec. 22, 2016.
[14] Twitter, The Search API, Available:
https://dev.twitter.com/rest/public/search. Last Accessed: Dec. 22, 2016.
[15] gensim, gensim Topic Modelling for Humans, Available:
https://radimrehurek.com/gensim/. Last Accessed: Dec. 22, 2016. [16] PyICU, https://pypi.python.org/pypi/PyICU/. Last Accessed: Dec. 22,
2016.
[17] RANKS NL Thai Stopwords, http://www.ranks.nl/stopwords/thai-stopwords/. Last Accessed: Dec. 22, 2016.
[18] NLTK 3.0 documentation, Natural Language Toolkit,
http://www.nltk.org/. Last Accessed: Dec. 22, 2016.
[19] D3, D3 Data-Driven-Document, https://d3js.org/. Last Accessed: Dec. 22, 2016.
[20] oop898 thai_tweet, https://github.com/oop898/thai_tweet. Last Accessed: Dec. 22, 2016.
[21] LDA Topic Modeling – Training and Testing,
http://stackoverflow.com/questions/11162402/lda-topic-modeling-training-and-testing. Last Accessed: Dec. 22, 2016.
[22] scikit-learn, scikit-lean Machine Leaning in Python, http://scikit-learn.org/stable/index.html. Last Accessed: Dec. 22, 2016.