Abstract: Performance loss ratio of multiple virtual machines on a single physical server is the key challenge in virtual environment. In this research, it is concern about the eight specific conditions as the performances of virtual machine, through quantities analysis approach during period of the execution in the Dedicated Online Education System. The factors that impact on the performance measurement of virtual machine can be divided into five key parameters such as CPU Usage, Idle time, Memory Utilization, Network Latency and I/O wait time. The virtual machine performances while reducing the number of virtual machines and increasing user level, has been given a positive improvement for the first four parameters and slightly negative for the last parameter. The results shown that less number of virtual machine can be accessed for more clients based on above parameters with better performance.
Keywords – Virtual Machine, Performance, Online Education System
I. INTRODUCTION
Web-based Education system is more effective than other OE systems, it still continue drawbacks such as Performance, Storage, implementation, maintenance, building space and security issues [1]. Many developers recommended virtualization based approaches as the best solution for above overhead. Virtualization technology provides benefits to such kind of OE system in performance isolation, online system maintenance, live migration, Customized OS and Virtual Machine (VM) which have emphasized the ease of system management and administration [2]. The performance overhead occurs commonly in the VM during the execution of application. Under this circumstance, developers consider vertical optimization or optimize the I/O or Hypervisor or Kernels are the solution to improve the above overhead. According to the previous knowledge summarized we decided that optimization of VM is a better solution for the performance overhead. There are many techniques available when creating the VM with the use of hypervisor or VMM, which can be implemented directly or separately on Physical Machine (PM) [2]. Hypervisor multiplexes across the VMs and ones situated between the PM and VMs [4]. Multiple VMs are also able to run on a unique PM, but the capacity of
Manuscript received November 03, 2015; revised November 03, 2015. This work was supported in part by the Huazhong University of Science and Technology – Virtual Machine Performance Approaches in the Online Education System.
Basheer Riskhan is with the Department of Computer Science, Huazhong University of Science and Technology, Wuhan, China. Phone: 0094714469676; Fax: 0094372224720; E-Mail: riskhan@ yahoo.com).
Raza Muhammad is with the Department of Computer Science, Huazhong University of Science and Technology, Wuhan, China [email protected]).
the physical resources should be enough to fulfill the need of all VMs working on it [5].
This study attempts to analyze the performance of VM using Dedicated OE System (DOES) model based on major eight conditions. CPU Usage, I/O wait time, idle time, Memory Utilization (MU) and Network Latency (NL) are the Variable measured during the execution of DOES model [4]. Our contribution to this paper; 1) Decrease the VMs or minimize the needed resource 2) Offer multi-users to access OE system in a single VM 3) Measure the matrix and report the overall detailed performance impact of each conditions. The VM optimization experiment result has indicated that our approach has improved performance efficiently and effectively.
II. RELATED WORK
This research is related to the VM Performance which was based on the VM and OE system. OE system has widely used in the form of client server technology and web base technology. But still continue some limitation due to processing memory, power constrains and different device platform. These overheads create issues to use the OE system properly and the performances of the devices not equally support to the OE system. To solve above mentioned overhead authors express, Cloud Computing is significant solution which provides the resources on demand [8].
Reference [7] addresses the application performance on VM and PM. Virtualization rescues many wastage cycles during the execution of applications. Apache JMeter was used as an experiment tool, experiment as followed by certain condition such as workload performance of PM which increases the CPU level in PM, workload performance of VM which increase the VCPU level in VM. Finally suggest that the benefits of virtualization application served by VM better than PM.
III. PLATFORMARCHITECTUREOVERVIEWOF
DOESSYSTEM
DOES model process among users, VM and PM. VM have given the permission to access the OE Application according to their resource limit. Beyond on VM limits, Hypervisor creates the VM and share the resources from PM. This experiment tests while users accessing the DOES model and measured the each variable matrix for the duration of 80 seconds.
A. Introduction of Operation Principal of DOES Model
Figure 1 describes the operation principle of DOES Model for multi user access in single VM. The Client request reaches to the VM after checking the personal identity. Then
Virtual Machine Performance Approaches in the
Online Education System
the VM has executed the OE application. “OE system database for VM” store in the VM and it retrieves from Database Server. According to the needs of client request, OE resources retrieved from “OE system database for VM”. If another request comes from Client, then the same procedure is continued in the VM.
Fig 1: Operation Principle of DOES Model
B. Virtual Machine Environment
The Figure 2(a) shows the multiple VM with Multiple OE access, figure2(b) shows the Dedicated OE system Model for Multi Users which is the reduce level of the VM in the virtual environment. DOES Model is a kind of stand-alone model which can execute when the request comes from user and it ensures increment of security system. Most of the process execute between the client and VM. Disturb was do not occur in the PM until the insufficient resources happen in VM, is the main benefit of this model. The Comparison of the VM Performance between Figure 2(a) and Figure 2(b) is the major experiment in this research. The whole process starts with the request of the client. The client, VM, PM has executed the sequential order of DOES model is as follows.
Fig 1: Architecture of OE system Virtual Environment
a) Request Command to VM: The client sends the request to the VM for asking the permission to access the OE application in the VM
b) Access to the Data: VM checks its performance, user limit and personal identity before accepting the request
c) Command execution: if the VM accepts the client’s request, then provides permission to execute the OE application
d) Request Command to PM: VM sends the request command asking for the physical resources. That happens,
when insufficiency resources occur in the VM during the user access the OE application in the VM
e) Sharing Recourse: if the request is accepted by the PM, the resources will be shared by PM according to the demand of the VM.
CPU usage describes the amount of the working processor and it can vary depending on the type of task which is performed by the processor. The amount of time the CPU cycle is waiting for I/O events such as disk read/write operation or networking is called I/O wait time. In other words, how much of time the CPU wastes while waiting for the completion of the I/O operation. MU is the usage percentage of memory out of total memory allocated to the VM, cache memory and buffer memory are also includes the reading. Network issues or fault memory or bad disks are the possible reason for high I/O wait time. The idle time refers to the unused percentage of the CPU. The 90% to 98% of idle time is a quite normal measurement during execution of the task. NL indicates several kinds of delay occur in the processing over a network. It can be varies from application to application. There is a chance to decrease the bandwidth as a result of High NL. Furthermore all these variables selected have great impact on the performance of the VM.
IV. EXPERIMENTALSETUP,METHODOLOGY
This section discusses about the techniques used for measuring the key metrics and major conditions. The data was collected by using Linux command and java code which is only based on virtual even delivered to it by the underlying hypervisor [3]. OrginPro8 software was used for purpose of analyses.
A. Virtual Machine Setup
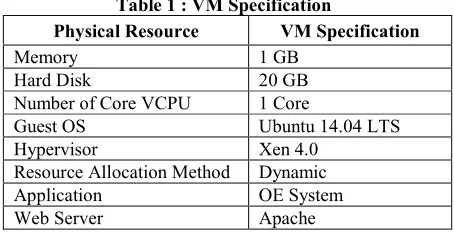
[image:2.612.71.299.439.610.2]The objective of this experimental task is to optimize the VMs. We used large multi-core PM with huge memory, high processor power, many core accelerate processor. The PM is sharing the resource to VM if needed. Ubuntu Sever is installed on the PM.
Table 1 : VM Specification
Physical Resource VM Specification
Memory 1 GB
Hard Disk 20 GB
Number of Core VCPU 1 Core
Guest OS Ubuntu 14.04 LTS
Hypervisor Xen 4.0
Resource Allocation Method Dynamic
Application OE System
Web Server Apache
[image:2.612.315.542.493.610.2]internal memory, aggregation of I/O request, executing the OE system and internal commands.
B. Evaluation Tools
SAR [] is called as System Activity Reporter which has a command-line library of Ubuntu. It provided the hardware performance counter in the processor. SAR -u <interval> <no. of times> is the command used for the experiment for finding the CPU usage, I/O wait time and Idle time shows on Figure 3.
Fig 2 : SAR Execute Command
“%user” is the percentage of time the CPU spends on user processor. “% system” is the percentage of time the CPU spends executing kernel tasks. Both are the attributes of the SAR command that data is able to add (CPU Usage = %user + %system) and given as CPU Usage [6]. I/O Wait and Idle are other attributes of the SAR command. According to the above SAR command, the system statistics is being collected every 2 seconds and this process occurs 40 times, that adds the total time to 80 seconds. Next is MU, which means memory usage measure includes buffer and cache while executing an OE system [9]. For that we use the Linux command with Perl scripting (FREE -m -c <no. of times> -s <interval> | perl -pe 'print localtime().""') to display the system time including their data.
At the same time the Java code is also executed to double check the MU value. “Runtime rt = Runtime. getRuntime(); long free = rt.freeMemory(); long total = rt.totalMemory(); long use = total - free; DateFormat df = new SimpleDateFormat("dd/MM/yy HH:mm:ss"); ” are the important statements which we used in java.
Fig 4: PING Test Execute Command
NL is measured from the client side. We used a Ping test is to measure the NL by determining the time it takes for data to be transferred from the client to VM and back. As the System time is the unique element, We used the special ping command (“# ping <IP address> | while read pong; do echo “$(date): $pong”;done” ) shows on Figure 4.
C. Measurement Configuration
This experiment was tested in eight conditioned approaches.
Condition No.1 (C1) consists of five virtual machines with OE application. Each client access each VM
Condition No.2 (C2) consists of four virtual machines with OE application. Each client access each VM
Condition No.3 (C3) consists of three virtual machines with OE application. Each client access each VM
Condition No.4 (C4) consists of two virtual machines with OE application. Each client access each VM
Condition No.5 (C5) consists of one virtual machine with OE application. Two client access in one VM
Condition No.6 (C6) consists of one virtual machine with OE application. Three client access in one VM
Condition No.7 (C7) consists of one virtual machine with OE application. Four client access in one VM
Condition No.8 (C8) consists of one virtual machine with OE application. Five client access in one VM
The main idea is to highlight the differences of the VM Performance impact between each condition and analysis the success of VM optimization. Each condition is tested in following steps. System time is the unique property for each measurement.
1) First 5 VMs and an Apache web server in the same PM are activated.
2) Client A, B, C, D and E requested 1st, 2nd, 3rd, 4th and 5th VM respectively for accessing the OE system as schedule by the C1.
3) VM provides the access permission, after checking the VM workload performance and their user limit by itself. At the same time our evaluation tools are executed in the VM and the client machine.
4) Report the evaluations matrix output after completing the 80 second execution.
5) Above experimental steps are applied for 4 VM with Client A, B, C and D respectively as schedule by C2. 6) The numbers of VM is decreased one by one and continues the experiment up to C4.
7) Increasing the numbers of client level in C5 to C8, the above experimental step are followed in 1 VM.
8) Report the evaluation output after completion of 80 seconds execution.
We understand some technical issues for the starting time of the clients and displaying the System time. Due to that, Perl scripting command is used for getting the system time.
V. EXPERIMENTAL RESULTS AND ANALYSIS
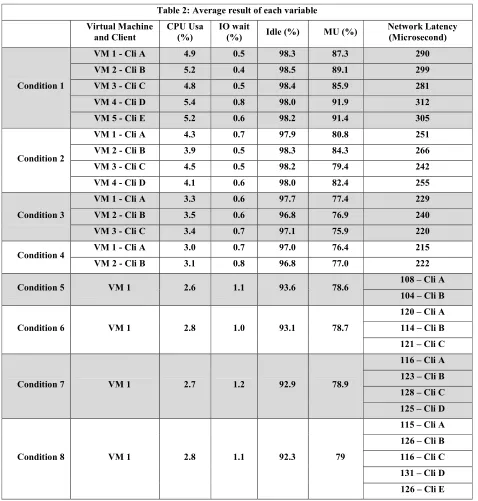
The scope of this section is to discuss individual performance of each variable in all the conditions, compare the pair conditions according to the number of VM and Number of users. Through that we can conclude the evaluation as whether the optimization had any effect to the VM performances or have any overhead occurred while the processing of VM. The table 2 describes the average results in each variable, in each condition. Except NL all the other variables are measured in percentage and NL are in micro seconds [3].
A. Performance comparisons between pair of conditions
understand the performance deviation between the condition. Each figure of pair group includes all the experimental variable result.
Figure 5, the first pair, is given the performance deviation between the C1 (5 VM access by 5 users) and C8 (1 VM access by 5 users). There is a major difference between the standard conditions and measurement variables, which provides the positive result to the task except I/O wait time. But Negative results of I/O wait time do not affect more to the VM performance as it does not exceed the harmful limit.
Figure 6, the second pair, is given the comparison between C2 (4 VM access by 4 users) and C7 (1 VM access by 4 users). The positive approaches except I/O wait are received from this pair like as first pair group. But the MU is relatively the same in both condition and it is shown that the
efficiency of utilization of resources can be increase with the decrement of the VM. This is another improvement of the task.
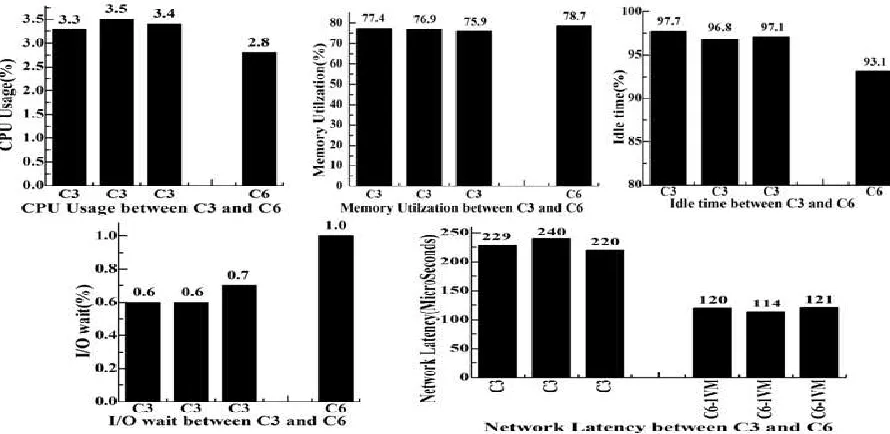
Figure 7, the Third pair, is given the comparison between C3 (3 VM access by 3 users) and C6 (1 VM access by 3 users).The test C6 is shown good performances to the variable of CPU Usage, Idle time and NL. Minute increment had noticed in MU and I/O wait from C3 to C6 which has also not been created any issues in the way of VM performance
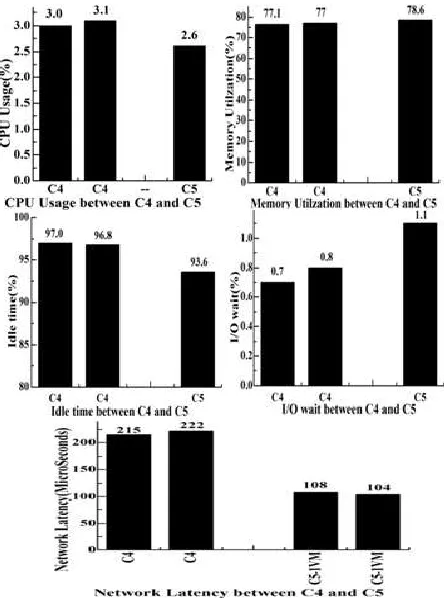
[image:4.612.68.546.44.545.2]Figure 8, the forth pair, is given the comparison between C4 (2 VM access by 2 users) and C5 (1 VM access by 2 users). This measurement analysis relatively displays the same result as in the third pair. This measurement analysis relatively displays the same result as in the third pair. Table 2: Average result of each variable
Virtual Machine and Client
CPU Usa (%)
IO wait
(%) Idle (%) MU (%)
Network Latency (Microsecond)
Condition 1
VM 1 - Cli A 4.9 0.5 98.3 87.3 290
VM 2 - Cli B 5.2 0.4 98.5 89.1 299
VM 3 - Cli C 4.8 0.5 98.4 85.9 281
VM 4 - Cli D 5.4 0.8 98.0 91.9 312
VM 5 - Cli E 5.2 0.6 98.2 91.4 305
Condition 2
VM 1 - Cli A 4.3 0.7 97.9 80.8 251
VM 2 - Cli B 3.9 0.5 98.3 84.3 266
VM 3 - Cli C 4.5 0.5 98.2 79.4 242
VM 4 - Cli D 4.1 0.6 98.0 82.4 255
Condition 3
VM 1 - Cli A 3.3 0.6 97.7 77.4 229
VM 2 - Cli B 3.5 0.6 96.8 76.9 240
VM 3 - Cli C 3.4 0.7 97.1 75.9 220
Condition 4 VM 1 - Cli A 3.0 0.7 97.0 76.4 215
VM 2 - Cli B 3.1 0.8 96.8 77.0 222
Condition 5 VM 1 2.6 1.1 93.6 78.6 108 – Cli A
104 – Cli B
Condition 6 VM 1 2.8 1.0 93.1 78.7
120 – Cli A
114 – Cli B
121 – Cli C
Condition 7 VM 1 2.7 1.2 92.9 78.9
116 – Cli A
123 – Cli B
128 – Cli C
125 – Cli D
Condition 8 VM 1 2.8 1.1 92.3 79
115 – Cli A
126 – Cli B
116 – Cli C
131 – Cli D
Fig 5: Virtual Machine Performance between Condition 1 and Condition 8
[image:5.612.72.517.509.726.2]Fig 6: Virtual Machine Performance between Condition 2 and Condition 7
Fig 8: Virtual Machine Performance between Condition 4 and Condition 5
The matrixes, graphical representation of each pair conditioned obviously clarify the differences in the performance of VM. I/O wait time is shown minute drawback which does not cause much impact on the VM performance. Further noticed the high CPU usage rates in the beginning of VM process are due to CPU intensive process and uses many resources. The above paired groups figure clearly compare the deviation between multi level VM and Single VM. As conclude, more resources and more time are utilized in Multi Level VM comparing to Single VM except I/O wait time. This was the possible response that provides the best feedback to our task.
B. Experiment Analysis
Comparison of each pairs we conclude, during the increment of number of VM that means using more resources, the matrixes increased except I/O wait. These results lead to lower performance of VM. Gradually decreased the measured matrixes observed while reducing the level of VM that leads to increase the Performance of VM. Yet in some occasions minute measurement overhead occurs in I/O wait time. This might be due to the use of Web server, OE application access by multi user and Network issues. If the process exhausts, the context switch can also be automatically blocked or delayed the process to lead more I/O wait time. But by decreasing the needed resources through decreasing the VM and by increasing the resource utilization rate by increasing the user level are more beneficial than such kind of above mentioned small overheads. Further CPU Usage, Idle time, MU and NL matrixes shown the best performance output in each pairs when reduced the VM and increase the user level.
VI.CONCLUSION AND FUTURE WORK
In conclusion, this paper presents the challenges of the VM significant performances degradation. Our main objective of this paper is to uplift the VM performance in the way of decreasing the number of VM or in the way of minimizes the needed resources. For archive that task we introduce the DOES model. Further research continues how many users can access the OE system in a single VM. As experimental setup this study used an FOSS, Xen hypervisor, OE system and dynamic recourse allocation method. VM resources and the processing time taken by processor are the main basic measurement aid in our research and its finds two innovative concepts through the output data of this study. 1. There is performance impacts occurred while we are using in the same VM configuration, same OE system and resources offered from PM in equal manner, but users level was vary. 2. We can observe the high CPU usage, high idle time, high MU, high NL and low I/O wait time in C1 compared with other conditions. This study proves that decreases the number of VM and increases the user level, gives the best performance of the rest of VM and the users which was our main task of this paper.
REFERENCES
[1] Naresh.Chiranji, CH.Deepthi, T.P.Shekhar, “A Novel Approach to Enhance Security for Online Exams”, ISSN : 2229-4333(Print) | ISSN : 0976-8491(Online), IJCST Vol. 2, Issue 3, September 2011
[2] Wei Huang, Matthew J. Koop, Qi Gao, Dhabaleswar K. Panda, “Virtual Machine Aware Communication Libraries for High Performance Computing”, 2007 ACM 978-1-59593-764-3/07/0011
[3] Anand Tikotekar, Hong Ong, Sadaf Alam, Geoffroy Vallée, Thomas Naughton, Christian Engelmann, Stephen L. Scott, “Performance Comparison of Two Virtual Machine Scenarios Using an HPC Application” [4] Indrani Paul, Sudhakar Yalamanchili , Lizy K. John,
“Performance Impact of Virtual Machine Placement in a Datacenter” 978-1-4673-4883-6/12 ©2012 IEEE [5] Amol Selokar, Prof.S.D.Zade, Prof.C.U.Chavan,
“Survey on Dynamic Resource Allocation Using Virtual Machines for Cloud Computing Environment” ,ISSN (Online) : 2278-1021 ISSN (Print) : 2319-5940 International Journal of Advanced Research in Computer and Communication Engineering Vol. 3, Issue 5, May 2014
[6] Sean Walberg. (2006, February 28). “Easy system monitoring with SAR [Online]”, Available: http://www.ibm.com/developerworks/aix/library/au- unix-perfmonsar.html
[7] Anala M R, Dr. Shobha G, “Comparative study of application performance on virtual machine and physical machine”, 2012 IEEE International Conference on Computational Intelligence and Computing Research [8] #linux. (2013, November 18). “The precise meaning of
I/O wait time in Linux [Online]”, Available: http://veithen.github.io/2013/11/18/iowait-linux.html [9] Surendra Anne. (2013, May 29). “Understanding free