Abstract—Using the Entropy equation (from the “Entropy Theory of Perception”, Norwich et al., 1975-present), Norwich and Wong modelled loudness L vs. intensity I using four unknowns (k, , n, and threshold intensity). Early on, they declare two equations for L, by first defining threshold loudness as loudness at threshold intensity, then by setting L = L – [threshold loudness]. Norwich and Wong then quantified the Weber fraction (using either of the “L” equations) by taking the differential with respect to intensity, then replacing differentials by deltas, and arranging. Subsequent re-defining of terms produced a Weber fraction equation resembling that of the late Professor Riesz. Dr. Riesz’s equation had three parameters, which Norwich and Wong (using their re-defined terms) substituted into their second L equation. They then assumed that their parameter k was constant, and then equated the theoretical loudnesses of a comparison tone and a reference tone, thereby generating equal-loudness contours – after also replacing one of Riesz’s parameters, identified with the n of the Entropy equation, by Stevens’ exponent, “x”. But the Norwich and Wong derivation hides serious problems. For example, for the respective intensity limits of either threshold intensity or zero, the first L equation approaches threshold loudness or zero, whereas the second L equation approaches zero or a negative loudness. Then there are the supposed relations between various parameters. To examine those relations, the present author inferred 37 values of each of x, k, and n, by the only method available: curvefitting of the Entropy equation and of Stevens’ Law to 37 loudness-growth plots. Evidently, k is not constant with tone frequency, but it varies with maximum loudness, in a relation not noted by Norwich and Wong. And n does not equal x. In sum, Norwich and Wong have not derived equal-loudness contours. Their mistakes exemplify what happens in mathematical biology under the wrong limits and the wrong assumptions.
Index Terms—assumptions, entropy, loudness, limits, Stevens’ Law
I. INTRODUCTION
N the literatures on psychophysics generally and on audition particularly, Kenneth Howard Norwich and Willy Wong make a truly remarkable claim: they claim to derive, from first principles, equations describing a phenomenon previously known only from experiments – namely,
equal-Manuscript received April 21, 2015; manuscript revised April 24, 2015. This work was supported by the author.
L. Nizami is an Independent Research Scholar in Palo Alto, CA, USA (phone: 650-690-0295; email: [email protected]). Work conceived at Department of Psychology, University of Toronto in Mississauga.
loudness contours [1-2]. Empirically, a loudness contour is obtained by matching the loudness of a tone at a given frequency, the “comparison” tone, to the loudness of a tone of constant intensity and constant frequency, the “reference" tone. Each time the intensity of the reference tone is changed, a new loudness contour is made, and each point on a given loudness contour represents a different frequency-intensity combination.
“Psychophysics” and “audition” were mentioned above because full comprehension of what Norwich and Wong did requires reading not just one paper, in psychophysics generally [1], but several other papers, including one in audition [2]. Indeed, the more recent [1] of those two papers provides a backward derivation of what appeared in the older one [2], as will be seen. The full details underlying the Norwich and Wong derivations [1-2] are remarkably diversely placed, and the present paper cites the required papers [3-6], thereby providing a synthesis that is not available in the literature. This synthesis proves revelatory. It shows what happens when wrong limits and wrong assumptions are employed in mathematical biology.
II. THE NORWICH AND WONG EQUATION FOR LOUDNESS
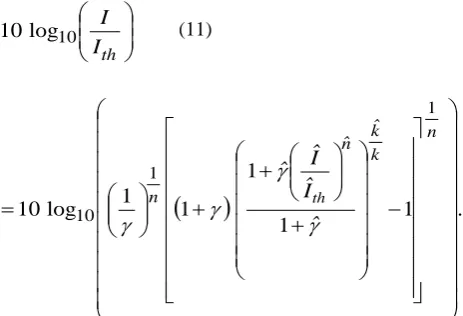
In the Entropy equation of Norwich and Wong [1], loudness is denoted L, and intensity, in units of power, is denoted I. Norwich and Wong ([1], Eq. (11)) write
. I
I ln
k L
n
th
+
= 1
γ
2
(1)
This is just Eq. (9) of [2], but with k there instead of k/2 (i.e., a mere change of notation, in which the ½ was presumably absorbed into “k”). The term k was earlier defined as “a proportionality constant” [3], its value “determined by the arbitrary scale units of the experimenter” ([4], p. 269). k was assumed to be independent of frequency and intensity. Ith was the “threshold intensity”. Norwich and Wong ([1], p. 931) then introduced Lth, “the loudness threshold” (but logically, the threshold loudness), where from Eq. (1)
Mathematical Biology
Under Wrong Limits and Wrong Assumptions:
Norwich and Wong (the Entropy Theory)
Fail to Derive Equal-Loudness Contours
Lance Nizami,
Member, IAENG
( )
+ = = n th th th th I I ln k L IL 1
γ
2
(
)
. lnk +
γ
= 1
2 (2)
Norwich and Wong ([1], Eq. (12)) then declared that
. otherwise , L L , L L
L th th
− > =
0
(3)
(This equation’s obvious flaws will be discussed soon.) Eqs. (1) and (2), and L= L – Lth in Eq. (3), give, for I > Ith,
(
γ
)
γ
− + + = 1 2 1 2 ln k I I ln k L n th . I I ln k n th + + =
γ
γ
1 1 2 (4)This is Eq. (13) of [1] (with the γ in the denominator of the present Eq. (4) misprinted in [1] as “y”). It is also Eq. (10) of [2] but with k there instead of k/2 (i.e., the ½ was presumably absorbed into k).
III. THE NORWICH AND WONG “WEBER FRACTION” Norwich and Wong [1] next differentiated Eq. (4), obtaining ([1], Eq. (14))
. I I I I n k I d L d n th n th n + = − −
γ
γ
1 2 1 (5)This result does not depend on whether Eq. (1) or Eq. (4) is used for loudness. Norwich and Wong [1] rearranged Eq. (5) to get an equation for dI/I. They then replaced dL by ΔL, that represented the difference limen in loudness, and
replaced dI by ΔI, that represented the change in intensity corresponding to ΔL ([1], p. 932). They thus obtained the Weber fraction, + ∆ = ∆ n th I I k n L I I
γ
1 12 (6)
([1], Eq. (15)).
The Weber fraction had been dealt with earlier, by Riesz [7], as follows. Riesz used two pure tones of nearby frequencies to produce a beating tone, whose maximum and minimum intensity as it waxed and waned could be related to
ΔI/I under some simplifying assumptions. Riesz noted, without references, an equation that “can be made to
represent ΔE/E [his notation for ΔI/I] as a function of
intensity at any frequency” by suitable choices of its three parameters ([7], p. 873). Each parameter was itself expressed as an empirical equation in frequency.
Norwich and Wong [1] transformed Eq. (6) into the empirical equation used by Riesz [7], as follows. After Fechner [8], ΔL was assumed constant with intensity. Two new positive quantities, S∞ and S0 – S∞, were then
introduced: , k n L
S∞= 2∆ (7a) . k n L S S
γ
∆ =− ∞ 2
0 (7b)
Therefore ([1], Eq. (22)), . S S S ∞ ∞ − = 0
γ
(7c)From all of these equations,
(
)
th nI I S S S I I − + = ∆ ∞
∞ 0 (8)
where ΔI/I > 0, which is Eq. (16) of [1] and Eq. (1) of [2]. Eq. (8) has the same general form as Eq. (2) of Riesz [7].
IV. THE NORWICH AND WONG DERIVATION OF EQUAL -LOUDNESS CONTOURS
From here on, Norwich and Wong [1] proceeded to derive equal-loudness contours. They obtained the theoretical intensity of the comparison tone, as a function of its frequency, by equating comparison-tone loudness to that of a constant-intensity 1-kHz reference tone. That is, representing the parameters of the reference tone by ^ (caret),
(
I,f)
L(
Iˆ,1kHz)
,L = (9)
which is Eq. (37) of [1]. From Eq. (4),
. ˆ Iˆ Iˆ ˆ ln kˆ I I ln k nˆ th n th + + = + +
γ
γ
γ
γ
1 1 2 1 1 2 (10)This is Eq. (12) of [2], but with k there instead of k/2 (the ½ was presumably absorbed into k), and with “prime” in place of “caret”, and with a script I in place of caret-I.
th I
I
10
log
10 (11)
(
)
.ˆ Iˆ
Iˆ ˆ
n k kˆ n ˆ
n th
−
+ + + =
1
1
10 1
1 1
1 1 log 10
γ
γ
γ
γ
The term within the largest brackets is Eq. (13) of [2], but with k there instead of k/2 (the ½ was presumably absorbed into k), and with “prime” in place of “caret”, and with a script I in place of caret-I.
Norwich and Wong [1] assigned values to the parameters of Eq. (11) [above] as follows. The frequency for the ^ parameters was taken to be 1 kHz; its absolute threshold
th
I
was taken from Wegel [9]. S0 and S∞ were evaluated from Riesz’s equations, thus yielding from Eq. (7c). k was assumed to be independent of frequency and intensity ([1], p. 931); thus k and k were assumed equal, and k k disappears from Eq. (11).
To repeat: each intensity of the 1-kHz reference tone results in a loudness contour, a plot of the {tone frequency, tone sensation level} points that give the loudness of the reference tone. Those loudness contours were presented in Fig. 5 of Norwich and Wong [1] and in Fig. 4 of Wong and Norwich [2]. They are bowl-shaped, rising up as frequency approaches its lowest and highest values. As Norwich and Wong noted elsewhere [5], Fletcher and Munson [10] had themselves produced equal-loudness contours using an SL scale. But those contours drop as frequency approaches its lowest and highest values, resulting in hill-shaped plots. Accordingly, the Riesz “n” was replaced in Norwich and Wong [1] by an equation for the Stevens exponent as a function of frequency. For the latter, Norwich and Wong ([1], p. 935) used “a function similar to the one suggested by Marks” [11]. Using that new equation for n, equal-loudness contours were recomputed, transpiring to be hill-shaped like those of Fletcher and Munson [10].
V. EXAMINING THE NORWICH AND WONG DERIVATIONS, (1): THE ENTROPY EQUATION FOR LOUDNESS, AT THE
“LOUDNESS THRESHOLD”
In the interest of fully appreciating what Norwich and Wong [1] achieved, we must critically scrutinize their derivation. According to Norwich and Wong [1], Eq. (4) above derives from Eq. (1) above; loudness supposedly obeys both Eq. (1) and Eq. (4). But this is impossible. First, Eq. (3) for L > Lth expresses a blatant inequality, not an equality. That is, the upper line of Eq. (3) would correctly
read L ≠ L Lth, rather than L = L Lth. The error is obvious; even a schoolchild can see it. Eq. (3) is mathematical nonsense.
Next, consider the lower limits of loudness. As I→Ith from I>Ith, L→Lth according to Eq. (1). But in these circumstances, according to Eq. (4), L→0. Thus, Norwich and Wong have created two simultaneous values, L=0 and L=Lth at the same intensity, Ith. Note also that as stimulus intensity diminishes such that I→0 from I>0, then according
to Eq. (1), L→0. But from Eq. (4), L→(–k/2)ln(1+γ), a negative loudness (k,γ>0). There is no such thing as a negative loudness.
VI. EXAMINING THE NORWICH AND WONG DERIVATIONS, (2): THE CONSTANCY OF THE FREE PARAMETER K
A critical assumption underlies the Norwich and Wong [1] derivation of loudness contours, an assumption mentioned in Section II: namely, that k is independent of intensity and frequency. But no test of that assumption has ever been presented by Norwich and/or his various co-authors. Therefore, the assumption was tested by the present author, as follows. k can only be obtained by fitting Eq. (1) or Eq. (4) to plots of empirical loudness vs. intensity. First, for simplicity, the term γ/ Ithn in Eq. (1) was replaced by a single symbol γ. Eq. (1) was then fitted, to 37 plots of loudness vs. intensity taken from the peer-reviewed literature. This constitutes more loudness-growth plots than in all of Norwich et al.’s collected Entropy work over its years of publication (1975-2014). Eq. (1) was transformed to logarithmic form in {ln I, ln L} coordinates, for fitting to logarithms of magnitude estimates, following the practice in the literature.
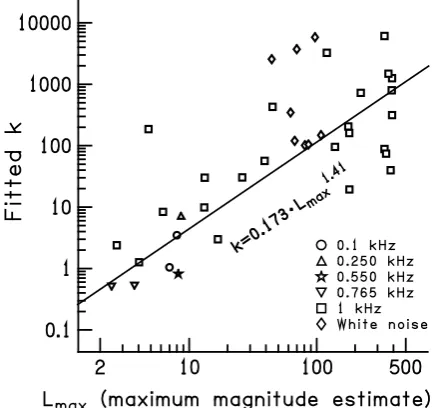
Fig. 1 shows the fitted values of the free parameter k, plotted vs. the respective tone frequency, as well as k for white noise. The sources of the loudness plots (magnitude estimates) are: [12], white noise (geometric means of magnitude estimates: series 1-3); [13], 1 kHz tone (Figs. 2, 3, 6, 7, 8, and 10); [14], 0.1 kHz tone (Fig. 2, crosses; Fig. 2, circles), 0.250 kHz tone (Fig. 3, geometric means of circles); [15], 1 kHz tone (subjects #8, 9, 10, 11, 12, 13); [16], 1 kHz tone (curves 1-7); [17], 0.550 kHz tone (subject AWS), 0.765 kHz tone (subjects EWB, RSM); [18], white noise (Fig. 2: binaural, magnitude production; binaural, magnitude estimation; monaural, magnitude production; monaural, magnitude estimation); [19], 1 kHz tone (Fig. 1, circles; Fig. 1, squares), white noise (Fig. 7, circles and crosses); [20], binaural 1 kHz tone (cross-modality-matching, high range day 2; low range day 2).
[image:3.595.48.280.52.210.2]Norwich and co-authors. Clearly, k is not constant with Lmax, and as such it cannot be considered constant generally, contrary to Norwich and Wong [1].
VII. EXAMINING THE NORWICH AND WONG DERIVATIONS, (3): THE RELATION OF THE ENTROPY EXPONENT TO THE
STEVENS EXPONENT
In order to produce equal-loudness contours having the observed empirical curvature, Norwich and Wong [1] replaced n, the exponent of Eq. (1) and of Eq. (4), obtained as an empirical equation from Riesz [7], with x, the exponent of Stevens’ power law. That is, Norwich and Wong assumed that n=x. But they provided no test of that assumption. In this regard, however, the curvefitting described above supplies values of n. Fitting each of the same loudness-growth curves with a power function L=aIx, in the same manner as described above for the Entropy equation, provides x. Therefore, we may altogether test the claim that n=x. Fig. 3 shows n vs. x; the line marked n=x indicates equality of those exponents.
Fig. 1. The fitted value of the free parameter k of Eq. (1) as a function of tone frequency or for white noise, for 37 loudness plots from the published literature (see text).
A straight line was fitted to the data points in the same manner as described above, yielding n = 0.123+1.215x. The reasons for the particular values of the multiplier in this relation, and of the added term, are unknown. It is certain, however, that n does not equal x, contrary to the assumption made by Norwich and Wong.
In the Entropy Theory, the maximum transmitted information during the perception of a stimulus, called It,max units of information, is expressed in terms of maximum loudness Lmax and minimum loudness Lmin as
. k
L L
It,max= max− min (12)
The k in the denominator is the selfsame k that appears in all of the equations above. In practice, Lmax>>Lmin, and hence Lmin can be ignored. The fitting of the Entropy
equation to the loudness-growth plot can be stopped when the fitted k is such that Eq. (12) yields It,max = 2.5 bits/stimulus, which is the average value found in the literature on absolute judgments (see [6]). Fig. 4 shows the relation of n to x in such a constrained fit. A line was fitted to the data points in the same manner described above, yielding n = 0.217+1.013x. Once again, the reasons for the particular values of the multiplier in this relation, and of the added term, are unknown. And, once again, it is certain that n does not equal x, contrary to the assumption made by Norwich and Wong.
Fig. 2. The fitted value of the free parameter k of Eq. (1) (values of Fig. 1) as a function of the corresponding maximum magnitude estimate from each empirical plot of loudness vs. intensity. The line k = 0.173∙Lmax1.41 is an actual fit to the data points (see text).
Altogether, regardless of whether the fit is constrained (Fig. 4) or unconstrained (Fig. 3), the parameter n (Entropy exponent) is not equal to the parameter x (Stevens exponent), contrary to Norwich and Wong [1].
VIII. EXAMINING THE NORWICH AND WONG DERIVATIONS, (4): THE FREQUENCY-DEPENDENCE OF THE ENTROPY
EXPONENT
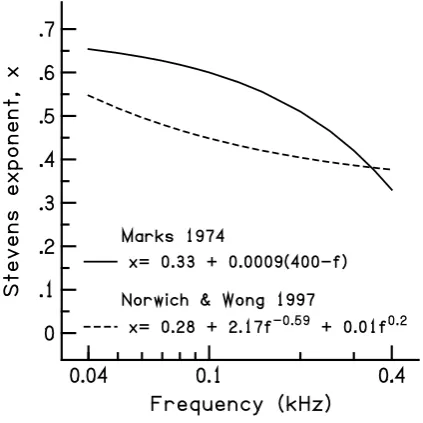
The equation of Marks [11] that describes the Stevens exponent as a function of frequency (in Hertz) is
(
f)
where f Hz,. .
x=033+00009
⋅
400− <400 (13) said to apply “over low frequencies (f) and not too high sound pressure levels” ([11], p. 74). The equation of Norwich and Wong ([1], Eq. (40)) that is “similar to the one suggested by Marks”, and upon which Norwich and Wong place no restrictions of sound pressure level or frequency, is. f . f
. .
x=028+217 −0.59+001 0.2 (14)
[image:4.595.318.535.213.417.2] [image:4.595.66.266.314.507.2]Without knowing the units of the constants in Eq. (13) and Eq. (14), we do not even know whether the x’s represented by the two equations have the same units! (And if they do, there is the question of what the units of the constants of Eq. (14), the equation of Norwich and Wong [1], would mean.) Fig. 5 shows the relations expressed in Eqs. (13) and (14). The curves themselves clearly differ; Eq. (14), the Norwich and Wong [1] equation, describes a “valley”, whereas Eq. (13), the Marks [11] equation, describes a “hill”. Indeed, the curves intersect only once, near the upper limit of Marks’ equation. The Norwich and Wong [1] equation actually looks more like Riesz’s equation for n ([7], Eq. (5)) than Marks’ equation for x.
Fig. 3. The fitted value of the free parameter n (the Entropy exponent) of Eq. (1), plotted vs. the fitted value of the Stevens exponent, here called x, for the magnitude estimates used in Fig. 1. The line n=x indicates putative equality of the Entropy and Stevens exponents. The line n = 0.123+1.215x is an actual fit to the data points (see text).
IX. CONCLUSIONS
Norwich and Wong [1] presented a backwards derivation of arguments made in Wong and Norwich [2]. It is no surprise, then, that what proves to be invalid in one paper proves to be invalid in the other. Multiple assumptions do not survive scrutiny. This is all the more shocking, given the slate of prominent senior professors (Lawrence Marks, Lawrence Ward, Lester Krueger) whom Norwich and Wong [1] credited for reviewing their paper. Even more remarkably, an experienced theorist, William Hellman, was credited for reviewing Wong and Norwich [2].
The present conclusions have heuristic value to mathematical modellers and their students, by revealing the embarrassing and needless errors that arise when using inappropriate limits, unjustified assumptions, and quantities having incompatible units. It seems fair and timely to also
note that Norwich and co-authors have made remarkable mistakes elsewhere in the Entropy Theory (see [21-26]). It seems that a culture of errors exists in this particular research group. Hence, caution seems appropriate even when reading papers authored independently by the co-authors.
Fig. 4. The fitted value of the free parameter n of Eq. (1), the Entropy exponent, vs. the fitted value of the Stevens exponent, here called x, for the magnitude estimates used in Fig. 1. The fit of Eq. (1) has been constrained to produce It,max= 2.5 bits/stimulus
[image:5.595.329.524.118.386.2](see text), such that the Entropy exponents may differ from those in Fig. 3. The line n=x indicates putative equality of the Entropy and Stevens exponents. The line n = 0.217+1.013x is an actual fit to the data points, as described in the text.
[image:5.595.71.269.220.491.2] [image:5.595.321.533.501.712.2]ACKNOWLEDGEMENT
Thanks to Dr. Claire S. Barnes PhD (VA Palo Alto Health Care System) for her insightful suggestions.
REFERENCES
[1] K.H. Norwich and W. Wong, “Unification of psychophysical phenomena: the complete form of Fechner’s law,” Percept. Psychophys., vol. 59, pp. 929-940, 1997.
[2] W. Wong and K.H. Norwich, “Obtaining equal loudness contours from Weber fractions,” J. Acoust. Soc. Am., vol. 97, pp. 3761-3767, 1995.
[3] K.H. Norwich, “The information content of a steady sensory stimulus,” in Proc. XII Int. Conf. Med. & Biol. Eng.: V Int. Conf. Med. Physics, Jerusalem, Israel, section 19.2, 1979.
[4] K.H. Norwich, “The psychophysics of taste from the entropy of the stimulus,” Percept. Psychophys., vol. 35, pp. 269-278, 1984. [5] K.H. Norwich and W. Wong, “A universal model of single-unit
sensory receptor action,” Math. Biosci., vol. 125, pp. 83-108, 1995. [6] K.H. Norwich, “The magical number seven: making a ‘bit’ of
‘sense’,” Percept. Psychophys., vol. 29, pp. 409-422, 1981.
[7] R.R. Riesz, “Differential intensity sensitivity of the ear for pure tones,” Phys. Rev. Series 2, vol. 31, pp. 867-875, 1928.
[8] G.T. Fechner, Element der Psychophysik. Leipzig, Germany: Breitkopf und Hartel, 1860. (Translated by H.E. Adler, Elements of Psychophysics. New York, USA: Holt, 1966.)
[9] R.L. Wegel, “Physical data and physiology of excitation of the auditory nerve,” Ann. Otol. Rhinol. Laryngol., vol. 41, pp. 740-779, 1932.
[10] H. Fletcher and W.A. Munson, “Loudness, its definition, measurement and calculation,” J. Acoust. Soc. Am., vol. 5, pp. 82-108, 1933.
[11] L.E. Marks, Sensory Processes: the New Psychophysics. New York, USA: Academic, 1974.
[12] H. Eisler, “Empirical test of a model relating magnitude and sensory scales,” Scand. J. Psychol., vol. 3, pp. 88-96, 1962.
[13] R.P. Hellman and J.J. Zwislocki, “Monaural loudness function at 1,000 cps and interaural summation,” J. Acoust. Soc. Am., vol. 35, pp. 856-865, 1963.
[14] R.P. Hellman and J.J. Zwislocki, “Loudness determination at low sound frequencies,” J. Acoust. Soc. Am., vol. 43, pp. 60-64, 1968. [15] R.D. Luce and S.S. Mo, “Magnitude estimation of heaviness and
loudness by individual subjects: a test of a probabilistic response theory,” Brit. J. Math. Stat. Psychol., vol. 18, part 2, pp. 159-174, 1965.
[16] W. McGill, “The slope of the loudness function: a puzzle”, in
Psychophysical Scaling: Theory and Applications, H. Gulliksen and S. Messick, Eds. New York, USA: Wiley, 1960, pp. 67-81.
[17] L.F. Richardson and J.S. Ross, “Loudness and telephone current,” J. Gen. Psychol., vol. 3, pp. 288-306, 1930.
[18] B. Scharf and D. Fishken, “Binaural summation of loudness: reconsidered,” J. Exp. Psychol., vol. 86, pp. 374-379, 1970.
[19] S.S. Stevens, “The direct estimation of sensory magnitudes – loudness,” Am. J. Psychol., vol. 69, pp. 1-25, 1956.
[20] L.M. Ward, “Remembrance of sounds past: memory and psychophysical scaling,” J. Exp. Psychol.: Hum. Percept. Perform., vol. 13, pp. 216-227, 1987.
[21] L. Nizami, “Fundamental flaws in the derivation of Stevens’ Law for taste within Norwich’s Entropy Theory of Perception,” in Current Themes In Engineering Science 2009: Selected Presentations at the World Congress on Engineering-2009 (AIP Conference Proceedings 1220): A.M. Korsunsky, Ed. Melville, NY, USA: American Institute of Physics, 2010, pp. 150-164.
[22] L. Nizami, “A warning to the human-factors engineer: false derivations of Riesz’s Weber fraction, Piéron’s Law, and others within Norwich et al.’s Entropy Theory of Perception,” in Advances in Computer Science and Engineering: M. Schmidt, Ed. Rijeka, Croatia: InTech, 2011, pp. 391-406.
[23] L. Nizami, “A computational test of the information-theory based Entropy Theory of Perception: does it actually generate the Stevens and Weber-Fechner Laws of sensation?,” Proc. World Cong. Eng. (Lecture Notes in Engineering and Computer Science), International Association of Engineers, London, England, 2009, pp. 1853-1858. [24] L. Nizami, “Norwich’s Entropy Theory: how not to go from abstract
to actual,” Kybernetes, vol. 40, pp. 1102-1118, 2011.
[25] L. Nizami, “Sensory systems as cybernetic systems that require awareness of alternatives to interact with the world: analysis of the brain-receptor loop in Norwich’s Entropy Theory of Perception”, in
Proc. 2009 IEEE Int. Conf. Syst. Man Cyber., IEEE, Piscataway, NJ, 2009, pp. 3477-3482.
[26] L. Nizami, “A lesson in the limitations of applying cybernetics to sensory systems: hidden drawbacks in Norwich’s model of transmitted Shannon information”, IIAS-Trans. Syst. Res. Cyber.