Multi Fingerprint Map
for Indoor Localisation
Pedro Mestre,
Member, IAENG,
Joao Cordeiro, and Carlos Serodio,
Member, IAENG
Abstract—Fingerprinting is one of the location estimation technique used in indoor applications. It maps information about wireless signals (e.g. the RSS value) into spatial coor-dinates. Because WiFi is an ubiquitous communication tech-nology, supported by smartphones, Fingerprinting-based lo-calisation algorithms that use WiFi signals are suitable for LBS applications. Although good results can be achieved using Fingerprinting, this is not an error free localisation technique. The end-user of the LBS application can interfere with these algorithms. If a user that was facing an Access Point rotates 180, the received RSS from that Access Point will decrease (and vice-versa). Although the user did not move, this RSS variation might be interpreted as ”the user moved”. A possible solution to cope with this problem is to acquire data at different directions, at each spatial point, during the off-line phase. Multiple Fingerprint Maps, that also include direction information, can therefore be built. The correct map (or combination of maps) can then be chosen during the on-line phase. Because most smartphones have a magnetic sensor, it is possible to know which direction the user is facing, therefore this information can be used to select the best Fingerprint Map to be used by the Location Estimation Algorithm. With this approach it was possible to improve up to 10.3% the location estimation precision, when compared with the use of an FM generated by averaging data collected in all directions.
Index Terms—Fingerprinting, Localisation, LEA, RSSI, Mag-netic Sensor
I. INTRODUCTION
I
N indoor environments, where GPS based localisation cannot be used, alternative techniques must be considered. One of such techniques is Fingerprinting, which is the most used method for indoor localisation [1].Fingerprinting comprises two distinct phases [2], [3], [4]: the off-line phase where information about wireless signals are acquired and stored in a database; the on-line phase where the location is estimated, by comparing data stored in the database and data collected at the moment. During the on-line phase it is used a Fingerprint Map (FM), generated using data collected during the off-line phase. The Location Estimation Algorithm (LEA) uses the FM information to map spatial and signal domains to estimate the mobile node coordinates.
Manuscript received March 8, 2015; revised March 15, 2015. This work is supported by national funds by FCT - Portuguese Foundation for Science and Technology, under the project PEst-OE/AGR/UI4033/2014.
P. Mestre is with Centre for the Research and Technology of Agro-Environmental and Biological Sciences, CITAB, University of Tr´as-os-Montes and Alto Douro, UTAD, Quinta de Prados, 5000-801 Vila Real, Portugal, www.utad.pt, and, Algoritmi Research Centre, Guimaraes, Portu-gal (phone: +351-259350363; email: [email protected])
J. Cordeiro is with University of Tr´as-os-Montes and Alto Douro, UTAD, Quinta de Prados, 5000-801 Vila Real, Portugal, www.utad.pt (email: [email protected])
C. Serodio is with Centre for the Research and Technology of Agro-Environmental and Biological Sciences, CITAB, University of Tr´as-os-Montes and Alto Douro, UTAD, Quinta de Prados, 5000-801 Vila Real, Portugal, www.utad.pt, and Algoritmi Research Centre, Guimaraes, Portugal (email: [email protected])
As long as it is possible to have access to the incom-ing wireless signal properties, such as the Received Signal Strength (RSS) value, any wireless technology can be used for Fingerprinting-based localisation. However, if the objec-tive is to develop Location Based Services (LBS) for use with smartphones, a wireless technology supported by such devices must be used. It also must be taken into account that better accuracy values are obtained for shorter range communications [5].
Because WiFi (IEEE802.11) is an ubiquitous technology, available on most smartphones, it is a good choice when creating localisation systems based on consumer electronics products. According to [1] Wireless Local Area Network (WLAN) based localisation systems are dominant indoors. Also such systems have the advantage of not requiring new or proprietary hardware.
Even though good results can be obtained using Finger-printing localisation based on WLAN, this is not an error free technique. Wireless signals are absorbed by obstacles, including the human body, so users may influence the RSS values. When holding a smartphone, the user will cause the fading of wireless signals irradiated by the Access Points (AP) that are located behind him/her.
As a consequence of this radiation absorption by the user, if an FM is built using data collected only in one direction, it will not be very useful in a real-life application, because during the on-line phase the user might be facing the opposite direction.
A simple (and commonly used) solution to cope with this problem is to acquire data (during the off-line phase) facing different directions (the user rotates 360 while acquires the FM data). The resulting FM can be calculated by averaging all the acquired values.
Another, and more efficient solution, would be to use the most suitable information collected during the off-line phase. Instead of creating a single FM, multiple maps can be generated (one per direction, e.g. North, South, East and West) and at the on-line phase the most suitable map (or set of maps) can be used by the Location Estimation Algorithm. Most of the recent smartphones have a magnetic sensor that can be used to estimate the user’s direction.
II. DIRECTIONALFINGERPRINTMAPS
A. User Interference
During the off-line phase, data must be collected at each spatial point that will be used in the FM. These data include the value of the power that the mobile node is receiving from the fixed references. When WiFi is used, these references are the network Access Points. The power received by the mobile node, from each AP, is given by Eq. 1:
Pr=Pt+Gt+Gr−P Ltot (1)
where Pr is the received power (in dBm), Gt and Gr
the gains of the transmitting and the receiving antennas (in dB or dBi) andP Ltot is the summation of all losses that
electromagnetic waves suffer while traveling between the transmitter and the receiver (indB).
In Eq. 1, the total path loss (P Ltot) is the result of the
free-space path loss and losses due to the presence of obstacles between the transmitter and the receiver. Free-space path loss can be expressed as a function of the distance between the two wireless nodes [6] (Eq. 2):
P L(d) =P L(d0) + 10N log
d
d0
+Xσ (2)
whereN represents the path loss exponent (which may vary according to the structure of the building [7]), d0 is an
arbitrary distance,Xσdenotes a Gaussian variable with zero
mean and standard deviationσ.
Losses due to the presence of obstacles are caused by obstacles found in buildings. Propagation models like COST and Motley-Keenan consider the attenuation due to walls and furniture [8]. However there are other obstacles inside a building that can attenuate wireless signals. The user that is holding the smartphone will also absorb electromagnetic waves. In the literature it can be found that the absorption by a single human body may cause an attenuation as much as 3.5dB to5.0dB [3], [9].
Let us consider that for indoor N = 3 [7] andd0 = 1m
[8], using Eq. 2, an excess attenuation5.0dBis the equivalent to the user moving 1.78m. This will obviously have a negative impact of the LEA performance and decrease the location estimation precision.
B. Multiple Fingerprint Maps
Because it is not feasible to force the user to face the direction at which the FM data was acquired, the proposed solution is to build multiple maps, and during the on-line phase, select the best map(s) to be used by the LEA. For this solution to be possible it is needed to know the user’s direction, both during the on-line and off-line phases of Fingerprinting-based localisation.
Nowadays, using a smartphone, it is relatively easy to know which direction the user (or the smartphone) is facing, e.g. using the magnetic sensor as a compass. If the azimuth value is also stored in the database when FM data is collected, then it will be possible to build multiple maps.
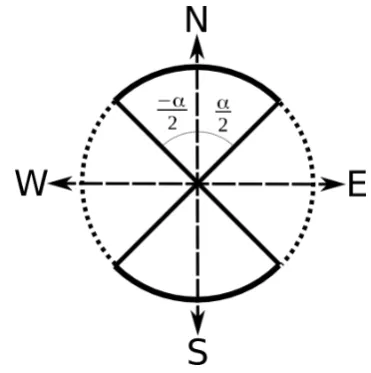
[image:2.595.331.517.50.237.2]It is not feasible to collect data in every direction because too much data would have to be collected, at each spatial point, to build multiple Fingerprint Maps. Also the azimuth value reported by the sensor has slight changes, even when
Fig. 1. Example using 4 slices.
the starphone is not moving. The trigonometric circle can be divided inton slices (nis a small value). Ifn= 1 then we have the ”traditional” FM based on the average of data collected in all directions. In Fig. 1 it is presented an example withn= 4.
As an example in Fig. 1 the four directions are North, South, East and West. It is not mandatory to use these di-rections. Any direction can be used, as long as the following conditions are met:
• Directions are fixed, and the same for all spatial points, otherwise it will not be possible to build a reliable set of maps;
• The trigonometric circle is divided evenly inn slices. Each slice has an amplitude (in ) given Eq. 3.
α= 360
n . (3)
To choose the best map(s) to use with the LEA, two approaches have been considered:
• Direct Map - Only one map is chosen, based on the azimuth value;
• Weighted Maps - The contribution of each map to the final location estimation is calculated as a function of the azimuth value.
One of the objectives of the authors is to maintain compati-bility with previously implemented location methods, i.e., the multi Fingerprint Maps can be used with any LEA, without the need to modify it.
1) Direct Maps: With Direct Maps, from the set of n maps that are built, only one FM is selected. This selection is based on the azimuth values reported by the magnetic sensor. The selected FM is fed to the LEA that estimates the
[image:2.595.303.553.682.767.2]Fig. 3. Working principle of the ”Weighted Maps” method.
user’s location (Fig 2). From the LEA point of view, there is only one FM.
Let us consider that data was collected facingndirections (d1, d2, ..., dn, with 0≤di ≤360), map i is selected if the
current azimuth value (β) meets the condition:
di−
α
2 < β≤di+
α
2 (4)
This is a simple solution, that requires the same com-putational power as the original LEA. There is only one additional step, which requires low computing power: select the most suitable FM based on the azimuth value.
2) Weighted Maps: Because the azimuth value might not be stable, in the above method if its value is too close to the boundary values (di−α2 or di+α2) the algorithm could be
constantly alternating between two maps.
In these conditions, the best choice could be using infor-mation of FMi and FMi−1 or FMi and FMi+1. This is the
working principle of Weighted Maps. Based on the current azimuth it is calculated the contribution that each map will have in the final estimation of the user’s location (Fig. 3). Then an weighted average of all coordinates estimated by the LEA (one per map) is calculated, to estimate the user’s coordinates.
In this work a linear weight function, Eq. 5, based on the angular distance of the azimuth value to the reference value is used.
wi= 1−| di−β|
θ , 0≤ |di−β| ≤θ
0, |di−β|> θ
(5)
were wi is the weight of mapi,β anddi are as above and
θ is a value chosen by the developer. The value used for θ, together with n, define the maximum number of maps that are considered in the location estimation. For example if n= 4andθ= 45, then 2 maps are used.
For each map (i) that meets the condition wi > 0, the
user’s location is estimated (without considering the weight). The final user’s coordinates is then calculated as in Eq. 6:
P(x, y) =
j−1
X
i=0
wi
w ×P(x, y)i (6)
where P(x, y) is the estimated user’s location, j is the number of maps that meets the condition wi > 0 and
P(x, y)i is the user’s location estimated using map i and
w the summation of all weights.
Because the location is estimated for each map, it is possible to use multiple maps with Location Estimation Algorithms that were not developed to use it. Each execution of the LEA is independent.
Compared with the previous solution, the computational time is increased (j times). However a possible alternative would be to generate a new FM, e.g. by doing an weighted average of the maps, for each execution of the LEA. If the maps have many points, the computational requirements would also be increased (for each point an FM had to be created) and the memory requirements would also increase (to storen+ 1 maps).
III. TESTINGSCENARIO ANDCONDITIONS
To assess the feasibility of the proposed methods, data was collected in a building at the Campus of the University of Trs-os-Montes and Alto Douro. These data were used to generate the Fingerprint Maps and to off-line test the ”Direct Map” and ”Weighed Maps” methods.
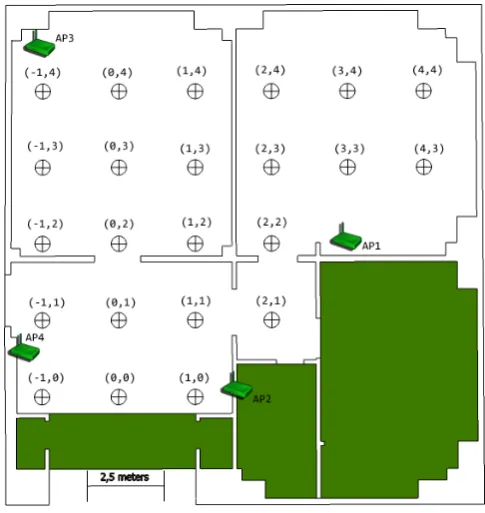
In Fig. 4 it is depicted the map of the area where data was collected. In the map are marked the spatial points where
[image:3.595.304.547.511.768.2]Fig. 5. Screen-shot of the Android application.
RSS samples were acquired and the location of the reference Access Points. At each spatial point of the map, data was collected facing four directions: North, South, East and West. At each direction 20 samples of the received power of all AP, the azimuth and the magnetic field values were recorded.
To collect data it was used an Android smartphone running an application developed by the authors for these tests (Fig 5). Because all the tests must be made using the same data, no data processing was made in real-time with this application. All data was stored in XML (eXtensible Markup Language) files and processed off-line.
To compare the performance of the proposed methods with other methods to generate the FM, in in the present work the following classic LEA were used:
• Nearest Neighbour (NN) – it is assumed that the current coordinates of the mobile node (in the spatial domain) are the coordinates of the nearest point (in the signals domain);
• k-Nearest Neighbour (kNN) – theknearest neighbours (in the signals domain) are selected, and then it is assumed that the mobile node coordinates (in the spatial domain) is the average of the spatial coordinates of those k points;
• Weighted k-Nearest Neighbour (WkNN) – similar to kNN, however an weighted average is used to estimate the user’s coordinates.
Results presented in section IV were obtained considering k= 3for kNN and WkNN, and, as in [5] the used weights (from the nearest to the furthest point) were 0.7, 0.2 and 0.1.
IV. NUMERICALRESULTS
In this section are presented the results obtained by the proposed methods, using data collected at the testing scenario. First are presented reference values, obtained in tests made for performance comparison. These reference tests also allow to demonstrate how the presence of the user can influence the location estimation accuracy. After, are presented the results that were obtained using the methods proposed in this paper.
Results obtained with the ”Direct Map” and ”Weighted Maps” are divided into two subsections. First are presented
the results that were obtained using four maps (N, S, E and W) and the user facing the same directions. After, are presented the results of two other tests where the same four maps were used, but the with user facing one of eight possible directions (N, NE, E, SE, S, SW, W and NW).
For all tests are shown the values for the Precision, Standard Deviation, Maximum Error and Minimum Error, obtained using the three LEA.
A. Reference Values
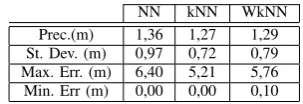
Because one alternative to the use of multiple maps is to build a single FM, based on data collected in all directions, the first test was made with such an FM. The FM used in the test, which results are presented in Table I, was built by averaging RSS data collected in the four directions.
TABLE I
RESULTS USING THEFMBASED ON ALL DIRECTIONS
NN kNN WkNN
Prec.(m) 1,36 1,27 1,29 St. Dev. (m) 0,97 0,72 0,79 Max. Err. (m) 6,40 5,21 5,76 Min. Err (m) 0,00 0,00 0,10
These values are presented here as reference values, and will be used for performance comparison.
The next test consisted in generating an FM per direction and do the location estimation of an user facing the same direction as the FM, during the on-line phase. Results of this test are presented in Table II. This is not a feasible solution for a real-life location system, however it can be used as the best case scenario. These are the best values that can be achieved using multiple maps.
Comparing data on Table II with data on Table I it can be concluded that considering a global FM with data collected in all directions, the results are worse than when the correct directional FM is used. These results validate that the solutions presented in this paper can improve the user’s location estimation.
Results of another test, made to demonstrate the user in-fluence in the precision of the location system, are presented on Table III. In this test four FM are used, one per direction, and the user is rotating. Analysing data it can be concluded that the user presence has a negative impact in the system precision, but not in the accuracy.
As it was expected the results obtained using an FM based on the average values of all directions (Table I) are better than those obtained with single direction FM (Table III).
B. Multiple Maps using Four Directions
The first set of tests using the proposed methods are presented in Table IV. In this table are shown the results
TABLE IV
RESULTS USING DIRECTIONALFM (DIRECTMAP)WITH FOUR DIRECTIONS
NN kNN WkNN
TABLE II
RESULTS OBTAINED USING ONEFMPER DIRECTION
North/North South/South East/East West/West
NN kNN WkNN NN kNN WkNN NN kNN WkNN NN kNN WkNN
Prec.(m) 1.12 1.14 1.11 1.24 1.22 1.19 1.26 1.16 1.20 1.25 1.12 1.16 St. Dev. (m) 1.10 0.71 0.83 1.09 0.67 0.78 1.09 0.68 0.82 1.05 0.61 0.76 Max. Err. (m) 5.00 4.03 4.38 6.40 5.21 5.04 5.83 3.54 4.58 4.12 3.67 3.96 Min. Err (m) 0.00 0.00 0.10 0.00 0.00 0.10 0.00 0.00 0.10 0.00 0.00 0.10
TABLE III
RESULTS USING ANFMPER DIRECTION AND USER FACING FOUR DIRECTIONS
North/All South/All East/All West/All
NN kNN WkNN NN kNN WkNN NN kNN WkNN NN kNN WkNN
Prec.(m) 1,44 1,30 1,34 1,54 1,35 1,41 1,52 1,30 1,38 1,44 1,27 1,30 St. Dev. (m) 1,02 0,75 0,83 1,06 0,75 0,84 1,00 0,74 0,81 1,00 0,72 0,78 Max. Err. (m) 5,10 4,71 4,88 6,40 5,21 5,92 6,40 5,43 6,03 6,40 5,66 5,02 Min. Err (m) 0,00 0,00 0,10 0,00 0,00 0,00 0,00 0,00 0,10 0,00 0,00 0,10
of a test using Direct Maps (a single map is chosen). In these tests four FM were generated (one per direction), the user’s location was estimated with the user facing all the four directions (N, S, E and W), and the FM was automatically selected by the method.
Comparing the obtained data with Table I, better results are achieved with directional maps, as it was expected. However, even though the user was not moving while acquiring data, the obtained results are worse than those where the FM was chosen manually (Table II). This is because the azimuth value reported by the magnetic sensor is not stable.
Using weighted maps (Table V), there is a slight im-provement of the precision (comparing to Table IV) and an improvement of the accuracy in comparison to the FM generated with all data (Table I).
TABLE V
RESULTS USING WEIGHTEDFMWITH FOUR DIRECTIONS
NN kNN WkNN
Prec.(m) 1.20 1.16 1.15 St. Dev. (m) 0.98 0.65 0.76 Max. Err. (m) 6.40 5.15 5.08 Min. Err (m) 0.00 0.00 0.04
C. Multiple Maps using Eight Directions
In this set of tests it is considered that the user might not be facing any of the directions used to build the FM. The Fingerprint Maps are the same as above (N, S, E and W) but for the user’s location four new directions are added (NE, SE, SW and NW).
These are limit conditions, because four slices are consid-ered (α=θ= 90). The newly added direction fall directly at the boundary between the Fingerprinting Maps. So this can be considered as a worse case scenario where the first method will constantly switch between maps. So for both methods it is expected a worse performance in comparison to results presented in Tables IV and V, and a better performance than using a single FM with all data (Table I). In fact, analyzing Table VI it can be concluded that those assumptions are true, except for the precision values with Nearest Neighbour Algorithm.
Results obtained using weighted maps are shown in Ta-ble VII. As it was expected these results are better than the
TABLE VI
RESULTS USING DIRECTIONALFM (DIRECTMAP)WITH EIGHT DIRECTIONS
NN kNN WkNN
Prec.(m) 1.47 1.21 1.26 St. Dev. (m) 0.85 0.62 0.75 Max. Err. (m) 4.47 3.40 3.98 Min. Err (m) 0.00 0.00 0.14
above. There is an improvement of the location precision and accuracy. There is a slight increase of both the maximum error value though.
TABLE VII
RESULTS USING WEIGHTEDFMWITH EIGHT DIRECTIONS
NN kNN WkNN
Prec.(m) 1.29 1.15 1.20 St. Dev. (m) 0.78 0.66 0.72 Max. Err. (m) 4.27 3.97 4.04 Min. Err (m) 0.00 0.02 0.01
V. CONCLUSION ANDFUTUREWORK
If the user’s direction is known, as well as the direction at which data to build the FM was collected, it is possible to decrease the location error. Two methods based on the direction information, compatible to existing LEA that were developed without having the user direction information, were presented and their performance was tested.
Comparing the results obtained using a single FM (av-erage) and the multi map approach, it was obtained an improvement of 10.3% for Nearest Neighbour, 8.7% for K-Nearest Neighbour and 9.30% for Weighted k-Nearest Neighbour.
Obviously that the user, in a real life application, will not be facing exactly the same direction at which the FM was collected. Even in these conditions, there is an improvement on the LEA performance (except for Nearest Neighbour in this particular testing scenario).
If instead a comparison is made with results obtained using an FM which includes only data collected in one direction, the precision improves by 22.08% for Nearest Neighbour,
By using multiple maps it was possible to improve the performance of the LEA, however there is a drawback, related to the amount of data that must be collected. To build more maps, it must exist in the database more data. Collecting data to build an FM is a time consuming task, if more maps are added, then more time is needed to collect data. This can be overcome by building the FM using propagation models, as presented by the authors in [8], it is only needed to add the user as an obstacle and generate the maps.
Adaptation of mobile devices to the maps generated by propagation models, or even to maps collected using other mobile devices can be made using Direct Search Methods as presented in [10].
REFERENCES
[1] G. Deak, K. Curran, and J. Condell, “A survey of active and passive indoor localisation systems,” Computer Communications, vol. 35, no. 16, pp. 1939 – 1954, 2012. [Online]. Available: http://www.sciencedirect.com/science/article/pii/S014036641200196X [2] A. Taheri, A. Singh, and E. Agu, “Location fingerprinting on infras-tructure 802.11 wireless local area networks,” inLCN ’04: Proceedings of the 29th Annual IEEE International Conference on Local Computer Networks. Washington, DC, USA: IEEE Computer Society, 2004, pp. 676–683.
[3] P. Bahl and V. N. Padmanabhan, “Radar: an in-building rf-based user location and tracking system,” pp. 775–784, 2000.
[4] C. Serodio, L. Coutinho, H. Pinto, and P. Mestre, “A comparison of multiple algorithms for fingerprinting using IEEE802.11,” inLecture Notes in Engineering and Computer Science: Proceedings of The World Congress on Engineering 2011, WCE 2011, 6-8 July, 2011, London, U.K., 2011, pp. 1710–1715.
[5] P. Silva., H. Pinto, C. Serodio, J. Monteiro, and C. Couto, “A multi-technology framework for lbs using fingerprinting,” in Industrial Electronics, 2009. IECON ’09. 35th Annual Conference of IEEE, Nov 2009, pp. 2693–2698.
[6] J. Andersen, T. Rappaport, and S. Yoshida, “Propagation Measure-ments and Models for Wireless Communications Channels,” IEEE Communications Magazine, vol. 33, no. 1, pp. 42–49, January 1995. [7] F. Evennou and F. Marx, “Improving positioning capabilities for indoor
environments with WiFi,” inIST Summit, 2005.
[8] C. Serodio, L. Coutinho, L. Reigoto, J. M. A., Correia, and P. Mestre, “A lightweight indoor localization model based on motley-keenan and cost.” in Lecture Notes in Engineering and Computer Science: Proceedings of The World Congress on Engineering 2012, WCE 2012, 4-6 July, 2012, London, U.K., 2012, pp. 1323–1328.
[9] M. Youssef, M. Mah, and A. Agrawala, “Challenges: Device-free passive localization for wireless environments,” in Proceedings of the 13th Annual ACM International Conference on Mobile
Computing and Networking, ser. MobiCom ’07. New York,
NY, USA: ACM, 2007, pp. 222–229. [Online]. Available: http://doi.acm.org/10.1145/1287853.1287880