New Area Based Metrics for
Automatic Gait Recognition
Jeffrey P. Foster, Mark S. Nixon, Adam Prugel-Bennett
Department of Electronics and Computer Science
University of Southampton
Southampton SO17 1BJ
{jpf99r,msn,apb}@ecs.soton.ac.uk
Abstract
Gait is a new biometric aimed to recognise a subject by the manner in which they walk. Gait has several advantages over other biometrics, most notably that it is non-invasive and perceivable at a distance when other biometrics are obscured.
We present a new area based metric, called gait masks, which provides statistical data intimately related to the gait of the subject and motivated by medical studies. This provides the first statistical approach that can expose the dynamics of the change in area of a subject. Early results show promising results with a recognition rate of 90% on a standard database. Further, there appear to be performance advantages with respect to handling of noise associated with this new approach, together with capability for extension and generalisation. Future research will capitalise on the advantages of this new approach, together with analysis on a larger database.
1. Introduction
1.1. Biometrics
A biometric is a measure of some human characteristic that can be used to distinguish between individuals. Perhaps the best example of a biometric in widespread use today is the fingerprint. Gait is a biometric aimed at recognising someone by the way they walk. It is not immediately apparent that gait is a unique biometric, however even from Shakespearian times there has been reference to gait recognition. In The Tempest [Act 4, Scene 1], Ceres observes “High’st Queen of state, Great Juno comes; I know her by her gait”. The Oxford English dictionary describes gait as “a manner of walking or forward motion”.
1.2. Psychological and Medical Studies of Gait
Work by Murray [1] considered gait as a “total walking cycle” and suggested that the action of walking can be thought of as a periodic signal as to be shown here. Murray produced data on sixty subjects by attaching markers to joints and recording data on the walking cycle. Murray et al’s work [2] suggests that if all gait movements were considered then gait is unique.
Psychological research also suggests that humans have a remarkable ability to recognise different types of motion. Johansson [3] performed an experiment with moving light displays (MLD’s) attached to body parts and showed that human observers can almost instantly recognise biological motion patterns, even when presented with only a few of these moving dots. This raised the question whether recognition of moving parts could be achieved directly from motion without structure recovery.
A more recent study by Stevenage [4] again confirmed the possibility of recognising people by their gait, but now using video. The study concentrated on determining whether illumination or length of exposure could impair the ability of gait perception. The study confirmed that, even under adverse conditions, gait could still be perceived. Psychological and medical studies therefore clearly support the view that gaits can be used for recognition.
1.3. Structure of Paper
We begin by examining previous approaches to gait recognition, with particular emphasis on the holistic approach using Principal Component Analysis coupled with Canonical Analysis. We will highlight issues with current holistic approaches and present a new technique, gait masks, which attempt redresses some of the limitations of previous approaches to holistic gait measurement.
Previous statistical approaches have concentrated on finding raw data from each sequence that was similar for each person, but different for other people. This raises questions on what is actually being recognised by the approach. In contrast, our approach gathers dynamic information directly about the gait of a subject and uses this information to recognise people.
Initial results using this technique are promising with high recognition rates even in the presence of noise corrupting the input silhouettes. We use the same databases as some of the earlier approaches, as this remains state-of-art. We also demonstrate how the approach is extensible. By combining simple metrics we are able to increase the recognition rate and increase the class separation in canonical space. In conclusion we summarise the benefits of using the new approach and detail areas in which further analysis is necessary.
2. Previous Approaches to Gait Recognition
2.1. Introduction
However, it remains to be seen whether these high recognition rates will translate to larger databases.
Model based approaches aim explicitly to model human motion and rely on human movement being tracked and a model being fitted to the image data. Cunado [8] proposed a method for gait recognition based on moving feature analysis. The gait signature was extracted directly from the evidence gathering process by using a Fourier series to describe the motion of the upper leg and apply temporal evidence gather techniques to extract the moving model from a sequence of images. Performance of this technique was also promising, with recognition rates of up to 100%, however the test sample was small. One of the main advantages of this technique is the handling of occlusion, which is of especial importance in gait as the human body is self-occluding. However, the only extant approach has a high computational cost.
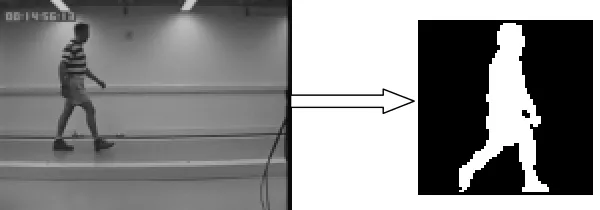
[image:3.595.139.439.370.475.2]We present a new technique that aims to combine elements of both the statistical and model based approaches. Gait masks aim to provide statistical metrics directly related to the gait of the walking subject with a direct link to medical analyses. To limit the scope of gait recognition we make several assumptions. We assume that there is a single static camera, and each subject is walking normal to the camera plane of view. In addition we assume only one human is present in each scene. From this data we extract a set of silhouettes. The binary silhouettes are extracted using a simple algorithm based upon background subtraction and region growing. Figure 2.1 shows an example of an extracted silhouette from an image in the sequence.
Figure 2.1 Single Image from Gait Sequence converted to a silhouette
2.2. Holistic Gait Descriptors
Little and Boyd’s approach [7] aims to describe the motion of a moving human figure in order to recognise individuals by variation in the characteristics of the motion description. The algorithm starts with a short sequence of images of a moving figure (taken by a static camera) and from this dense optical flow data is derived. A range of scale-independent scalar features of each flow image is calculated that characterises the spatial distribution of the flow. These scalar features represent the shape of the motion. The scales are based on various moments of the set of moving points. To characterise the shape of the motion, rather than the shape of moving points, the points are weighted by the estimates of optical flow.
2.3. Principal Component Analysis
Principal Component Analysis (PCA) has already been shown to be successful in the area of face recognition and Huang [6] extended this holistic approach to the area of gait recognition. PCA was combined with Canonical Analysis (CA) to project the gait sequence into a new space where class separability was maximised.
Given c training classes to be learnt, where each class represents a walking sequence of a single subject, x’i,j is the j-th image (of n pixels) in class i and Ni is the number of images in the i-th class. The total number of training images is
1 2 ...
T C
N =N +N + +N (1)
And the training set is represented by
[
]
c
N c N
x
x
x
x
'
1,1...
'
1,,
'
2,1,...,
,1 . The brightness of
each sample image is normalised and the mean pixel value for the full image set is:
∑ ∑
= =
=
ci N
j i j j i
T x
i
N
1 1 ,,
1
x
x
m
(2)Then an n × NT matrix X is created, where each column is formed from each of x’i,j less
the mean as:
[
x
m
xx
Nm
xx
cNcm
x]
X
=
1,1−
,...,
1, 1−
,...,
,−
(3)
The PCA transform used the eigenvectors and eigenvalues of the data covariance matrix derived from the product XXT to rotate the original data co-ordinates along the
direction of maximum variance. Calculating the eigenvectors of the matrix XXT is
intractable for typical image sizes so a partial set of eigenvalues is calculated from the matrix XTX using singular value decomposition. This partial set of eigenvectors spans
an eigenspace in which the points yi,jare the projections of the original images xi,j by the eigenspace transformation matrix thus
[
]
i jT k j
i,
e
1,...,
e
x
,y
=
(4)After this transformation, each original image can be approximated by the linear combination of these eigenvectors.
Following the eigenspace transformation the Canonical Space Transform (CST) is used to maximise the out of class separability (represented by Sb) and minimise within
class separability (Sw). The matrix St is a dispersion matrix. The object of the CST
function is to minimise Sw and to maximise Sb simultaneously. This is achieved by
minimising the generalised Fisher linear discriminant function J
W
S
W/W
S
W
W
T wb T
=
)
(
J
(5)This ratio is maximised by the selection of the feature W if
0
/
∂
=
∂
J
W
i (6)Supposing W* to be the optimal solution and that w
i* be its column vector which is a
generalised eigenvector and corresponds to the i-th largest eigenvector λλλλi, then * i w i * i
b
w
λ
S
w
S
=
(7)3. Gait Masks
3.1. Introduction
Gait masks are a new approach to gait recognition aiming to combine some of the elements of both the holistic and model based approaches. The disadvantage of traditional holistic approaches is that they simply derive data that is different for each class. This data has no direct relevance to the nature of gait! In most cases it is difficult to tell what is being recognised by holistic approaches – is it the silhouettes, rather than the actual movement? In contrast, model based approaches directly recognise gait by using a set of equations that describe the movement of a person. These feature-based metrics can achieve high recognition rates, but unfortunately the only extant approach has high computational costs.
Gait masks aim to combine holistic and model-based approaches by using statistical data that is intimately related to the nature of gait. Gait masks are used to transform human silhouettes into data directly related to the gait of the subject. The human silhouettes are calculated using a combination of background subtraction and thresholding to produce binary silhouettes. Figure 3.1 shows examples of these.
Figure 3.1 Sample Silhouettes
Using these silhouettes the gait masks (Figure 3.2) project the data into a new space giving statistical information about the gait cycle.
Figure 3.2 Sample Gait Masks
The set Cp labels each set of sequences of each individual person). Each item in the set (
j
P
S ) represents sequence j of person p.
{ }
pjp
C
=
S
(8)The set Tpjrepresents the individual images (silhouettes) in each sequence from each
subject. Each member of the setSpj(t)represents a specific image (t) as a vector from person p sample j.
{ }
(
t
)
T
j
j p
p
=
S
(9)The set K represents the set of gait masks, Mn, where each member represents each individual gait mask, each represented as a vector.
{ }
nK
=
M
(10)For each gait mask, n, and each person p, and each sample j, R is the projection of each sample into a new space using gait mask Mn.
)
(
)
(
t
n pt
np
M
S
In effect, this is the same as overlaying the gait masks upon each image in the sequence of silhouettes and measuring the area under the white part of the gait mask. These area changes provide data on the movement of the subject which are periodic and sinusoidal, consistent with earlier studies[1].
[image:6.595.124.473.272.427.2]3.2. Basic Gait Masks
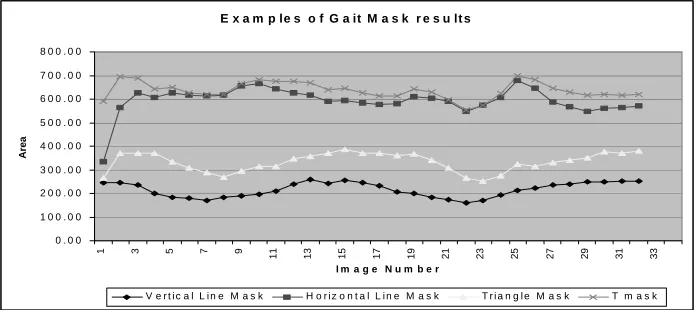
Figure 3.3 shows sample output using the gait masks in Figure 3.2. Each gait mask produces a similar, consistent output for each subject. In particular, the vertical line mask produces sinusoidal output that is directly related to the gait cycle of a subject. The peaks in the graph represent when the legs are closest together and the dips represent where the legs are at furthest flexion. The gait masks are therefore providing statistics that are intimately related to the mechanics of gait.
E x a m p le s o f G a it M a s k r e s u lt s
0 . 0 0 1 0 0 . 0 0 2 0 0 . 0 0 3 0 0 . 0 0 4 0 0 . 0 0 5 0 0 . 0 0 6 0 0 . 0 0 7 0 0 . 0 0 8 0 0 . 0 0
1 3 5 7 9 11 13 15 17 19 21 23 25 27 29 31 33
I m a g e N u m b e r
Area
V e r t i c a l L i n e M a s k H o r i z o n t a l L i n e M a s k T r i a n g l e M a s k T m a s k
Figure 3.3 Sample Gait Mask Results from one subject using 4 separate gait masks
It is possible to use the graphs produced by gait masks to provide recognition capabilities. A simple method is used to compare the graphs. A phase shift along the horizontal axis is possible (because the subject may be filmed at any point in their walking cycle), so the correlation is measured at various lags in time (t). The maximal correlation between the two results is used as the correlation between any two graphs. Least squares correlation technique is used to measure the mean squared difference between the two graphs. An FFT-based correlation function could have been used to find the optimal shift needed, however a brute force method was chosen due to the small number of possible shifts.
There were four samples of each subject, each possible combination of 3 of these was used to provide a database on which to compare a test sample (leave one out cross validation). For each individual gait mask the recognition rates varied from 30% to over 80%. Table 3.1 shows the recognition rate of various gait masks. On this dataset the speed variation was minimal so normalisation between successive heel-strikes (for speed) was not used. The SOTON database provided the data for the test. It consists of six people, with four samples of each person. This is one of the largest gait databases currently available, though more extended ones are being developed.
However, basic gait masks recognition capability comes from the silhouette of the subject. Adding noise to the silhouettes (to simulate the performance with poor quality silhouettes) results in a huge reduction in performance capabilities. As such, a new method of using gait masks was explored which aims to increase the correct recognition rate on noisy data.
Table 3.1 Gait Mask Recognition results
Gait Mask Recognition Rate
Horizontal Line Mask 71%
Vertical Line Mask 83%
Top Half Mask 58%
Right Half Mask 42%
Left Half Mask 33%
Bottom Left Mask 42%
Bottom Right Mask 38%
Triangle Mask 63%
T Mask 71%
Bottom Half Mask 54%
Mid Triangle Mask 83%
4. Extending Gait Masks using CA
4.1. Introduction
It could be argued that the recognition capabilities of gait masks could simply come from the DC component of the data (i.e. the size of the silhouette rather than the movement of the subject).
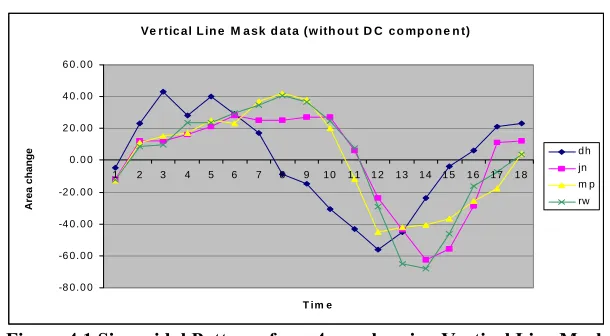
We performed the tests are detailed above, except this time the DC component of the data was omitted (i.e. the mean of each sample sequence was subtracted from each image in the sequence, before using gait masks to project the data into the new space). We decided simply to look at the sinusoidal output from the vertical line mask.
Figure 4.1 shows some example output.
Ve r tic al L in e M a sk d ata (w ith o u t D C c o mp o n e n t)
-8 0 . 0 0 -6 0 . 0 0 -4 0 . 0 0 -2 0 . 0 0 0 . 0 0 2 0 . 0 0 4 0 . 0 0 6 0 . 0 0
1 2 3 4 5 6 7 8 9 1 0 1 1 1 2 1 3 1 4 1 5 1 6 1 7 1 8
T i m e
Area ch
an
g
e d h
jn
[image:7.595.146.451.505.673.2]m p rw
Figure 4.1 Sinusoidal Patterns from 4 people using Vertical Line Mask
correlation function as before, recognition rates were poor, at less than 40%. We decided to use canonical analysis (as used in the previous holistic approach that combined PCA and CA). Canonical analysis aims to maximise the out of class separation whilst minimising in class dispersion. By moving to CA excellent results where achieved. The CA approach is summarized by Equations 5, 6 and 7.
Firstly, CA was used to produce a set of axes on which to project the data. The data was divided into a set of training and test data. The training data consisted of three samples from each of the six subjects. The centroid of each subject in canonical space was recorded and the distance between this centroid and the test data in canonical space was recorded. This was then used to calculate the recognition rate on the small SOTON database. Initial results were promising with a recognition rate of over 80% and good class separability.
To further evaluate the performance of the canonical analysis approach, the system was tested using noisy images. The original database consisted of 6 subjects with 4 samples of each. Each sample was corrupted with noise of varying degrees (where 1%, 2%, 4% and 8% of image pixels were set to white) to create a much larger database. Figure 4.2 shows examples of this.
[image:8.595.130.463.317.382.2]1% noise 2% noise 4% noise 8% noise
Figure 4.2 Sample silhouettes corrupted with noise
The new database consisted of 6 subjects with 20 samples each. Of these 120 samples, 90 were used as a training set and the rest used as test data. It is important not to overlearn the dataset. The axes generated from the training set should have good generalization capabilities, this is the reason why the training set is completely separate from the test set.
Canonical analysis was performed upon the training set to generate a set of canonical axes. These axes were used to project the training data into canonical space. Each class forms a cloud of data points in this new space. The centroids of each class are recorded and these are used to calculate which class any given point in canonical space belongs to. On the training set (90 samples) the recognition rate was 91.1%. The test set (30 samples) gave a recognition rate of 83.3%. These results are promising and show that the sinusoidal output of the gait masks has a structure (even in the presence of noise), which means they are suitable for recognition purposes.
4.2. Combining Gait Masks using Canonical Analysis
By combining different gait metrics it is possible to dramatically increase the recognition rate of the system. Previous work with canonical analysis focused on using the results from the vertical line mask for analysis. Another gait mask that performs well and is consistent for each person is the “mid-triangle” mask.
By using the mid-triangle mask alone performance is similar to that of the vertical line mask (approximately 80% recognition rate on the noisy dataset). By using the results from two gait masks it is possible to increase this recognition rate to 90% (with a 0% error on the training set, and 10% misclassification on the test set).
Table 4.1 shows the mean Malahanobis distance between classes for the SOTON database (complete with noisy silhouettes) for each combination of mask tested.
Table 4.1 Class separation
Method Mean Malahanobis distance
Vertical Line Mask 24.5
Mid Triangle Mask 75.6
Combined 96.6
To combine the results from two Gait Masks using canonical analysis is simple. The results from the second gait mask are simply appended to the end of the previous output, and CA is performed upon this set of data. The amount of masks that can be combined using CA is limited only by computational considerations. However, further research is necessary to determine whether combining many gait masks is detrimental to the performance of the system. Initial results are promising and a thorough evaluation of the performance factors of this approach needs to be undertaken.
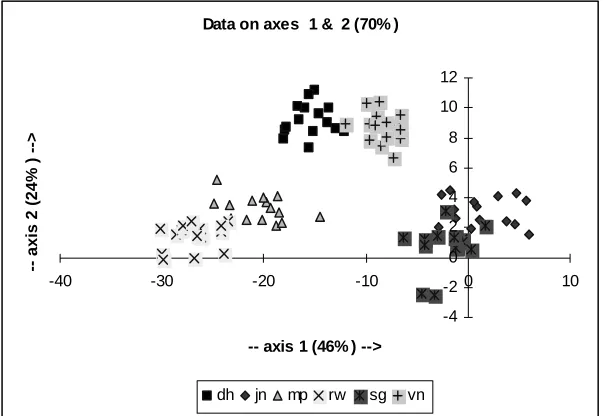
Figure 4.3 shows the class discrimination capabilities of the combined approach.
Data on axes 1 & 2 (70% )
-4 -2 0 2 4 6 8 10 12
-40 -30 -20 -10 0 10
-- axis 1 (46% ) -->
-- axis 2 (24%
) -->
[image:9.595.149.451.330.538.2]dh jn mp rw sg vn
Figure 4.3 Discrimination using combined approach
Whilst using Canonical Analysis does not provide any great increase in the correct recognition rate on this small database, it does have advantages over the basic gait masks approach. Gait masks, together with canonical analysis, provide high correct recognition rates even when the input silhouette has been corrupted by noise. When the DC component of the data has been removed (as is the case with gait masks and canonical analysis) we can also be sure the recognition capability is not simply coming from the size of the silhouette.
5. Conclusions and Further Work
Gait masks have been shown to be a potential technique for gait recognition. On small size databases correct recognition rates of 90% are possible. By using Canonical Analysis it is possible to achieve 90% correct recognition rates even in the presence of noise. By removing the DC component of the data we have shown that recognition capabilities do not come from the static silhouette, they come from the dynamic temporal properties of the silhouette. It is possible that using optical flow images of the subject may also provide discriminatory powers using gait masks and canonical analysis. Gait masks rely on the subject walking normal to the camera’s plane of view. Further research is necessary to determine the effects of the subject walking at an angle to the camera. This will aim to provide a better justification for the use of masking functions beyond the existing relationship with medical work. Foremost, a larger database is needed to evaluate the performance of the gait masks on a much larger dataset. A more sophisticated silhouette extraction process will need to be employed since the one used at present is very basic, and produces quite poor quality silhouettes in some cases. A larger database will also enable a much greater range of data in the training set which will enable us to evaluate the performance of the technique further still.
References
[1] M. P. Murray, “Gait as a total pattern of movement”, American Journal of Physical Medicine, 46(1), pp. 290-332, 1967.
[2] M. P. Murray, A. B. Drought, and R. C. Kory, “Walking patterns of normal men”, Journal of Bone Joint Surgery, 46-A(2), pp. 335-360, 1964.
[3] G. Johansson, “Visual perception of biological motion and a model for its analysis”,
Perception Psychophysics, 14 (2), pp.201-211, 1973.
[4] S. V. Stevenage, M. S. Nixon and K. Vince, “Visual Analysis of Gait as a Cue to Identity”,
Applied Cognitive Psychology, 13, pp.513-526, 1999.
[5] H. Murase and R. Sakai, “Moving object recognition in eigenspace representation: gait analysis and lip reading”, Pattern Recognition Letters, 17, pp. 155-162, 1996
[6] P. S. Huang, C. J. Harris, and M. S. Nixon, “Human Gait Recognition in Canonical Space using Temporal Templates”, IEE Proc. VISP, 146(2), pp. 93-100, 1999
[7] J. Little and J. Boyd, “Describing motion for recognition”, Videre, 1(2), pp. 1-32, 1998 [8] D. Cunado, M. S. Nixon, and J. N. Carter, “Automatic Gait Recognition via
Model-Based Evidence Gathering”,Proc. AutoID99: IEEE Workshop on Automated ID Technologies, Summit, pp. 27-30, 1999
[9] M. S. Nixon, J.N. Carter, D.Cunado, P.S. Huang and S.V. Stevenage, “Automatic gait Recognition”, in BIOMETRICS – Personal Identification in Networked Society, A. Jain, R. Bolle and S. Pankanti, Eds., pp. 231-249