Linear and non-linear plasma equilibrium responses on the
JT-60U and TCV tokamaks
J.B. Lister
a,*, R. Khayrutdinov
b, D.J.N. Limebeer
c, V. Lukash
d,
Y. Nakamura
e, A. Sharma
c, F. Villone
f, J.P. Wainwright
c, R. Yoshino
eaCentre de Recherches en Physique des Plasmas,Association EURATOM-Confederation Suisse,EPFL, 1015Lausanne,Switzerland
bTriniti,Troitsk,Russian Federation
cImperial College of Science,Technology and Medicine,London,UK dRRC Kurchato6 Institute,Moscow,Russian Federation eNaka Fusion Research Establishment,JAERI,Naka,Japan
fAssociation EURATOM/ENEA/CREATE,DAEIMI,Uni6ersity of Cassino,Cassino,Italy
Abstract
Although linear response models are useful for feedback controller design, their linear time-invariant properties cannot simulate the evolution of a full plasma discharge. A suitable code for this purpose is DINA, which has now been benchmarked against a complete set of experimental data from TCV control experiments in both the time and frequency domains. Experimental measurements of the plasma equilibrium dynamic response to poloidal field coil voltage variations have recently been performed on the JT-60U tokamak. These results have been compared with the RZIP rigid current displacement model, previously validated on TCV, but enhanced for the work described. © 2001 Elsevier Science B.V. All rights reserved.
Keywords:Plasma equilibrium; Tokamak; Simulation
www.elsevier.com/locate/fusengdes
1. DINA simulations of TCV
Considerable attention is being focused on the design of plasma position, current and shape con-trollers for the next generation tokamak-reactor designs, such as International Thermonuclear Ex-perimental Reactor (ITER)-FEAT. The develop-ment of a new control algorithm for a new plasma
configuration will require numerical analysis prior to experimental tests to optimise experimental time. It is, therefore, necessary to have a validated tokamak plasma simulator to test any new pro-posed plasma controller design. A first require-ment of such a tool is its ability to model a real experimental plasma evolution with sufficient ac-curacy. Considerable success had been obtained in modelling the stationary phase of TCV discharges using two linear models, RZIP and CREATE-L [1 – 3]. However, to simulate a full discharge, we require a non-linear self-consistent model. DINA * Corresponding author. Tel.:+41-21-693-3482; fax:+
41-21-693-5176.
E-mail address:[email protected] (J.B. Lister).
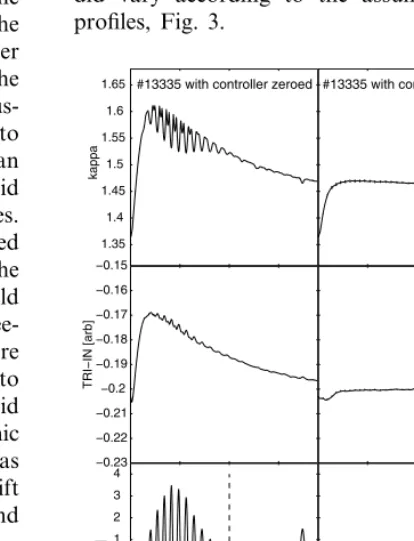
simulation, to start with a non-zero voltage on the integral term of the feedback controller, in order to avoid a transient, which could even drive the simulation unstable and end it prematurely, illus-trated in Fig. 1. Secondly, it is very difficult to adjust the poloidal flux consumption between an experiment and a simulation, since the latter did not model the transport in most of the cases. Modelling the transport would not have helped matching the data, since a long adjustment of the transport coefficients by trial and error would have been necessary to obtain even modest
agree-ment. A pragmatic solution was therefore
adopted, feeding back the toroidal resistance to agree with the experiment. This adjustment did not perturb the investigation into the dynamic equilibrium response, which in most cases was assessed with the lowest frequency response (drift and offset) removed from both simulation and experimental data.
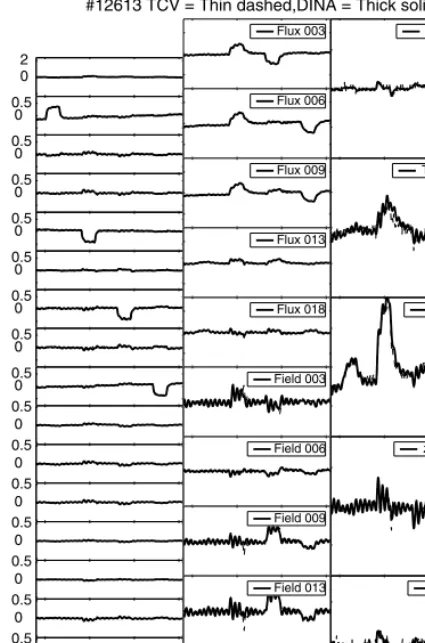
With these two improvements, 27 different dis-charges were simulated, with no adjustment of the DINA code, except for one minor numerical problem encountered for a particular discharge. Both limited and diverted plasmas were well mod-elled during the plasma current flattop for the rejection of external square-wave PF coil voltage pulses. Examples of the comparison between TCV and DINA responses are shown in Fig. 2. The agreement between the simulation and the experi-mental results was almost always within the noise width of the experimental data.
A complete single null diverted plasma dis-charge was also successfully simulated. The most
[image:2.612.282.489.229.500.2]profiles, Fig. 3.
Fig. 2. Simulation of a diverted off-centred plasma, using separate E1, E4, E6, E8 coil stimulations in a single pulse. The signals are shown detrended: (left column) all 18 external PF coil currents, OH1, OH2, E1 – E8, F1 – F8; (middle column) flux loopsc3, 6, 9, 13, 18, magnetic probesc3, 6, 9, 13, 18; (right column) the five feedback control parameters.
Fig. 3. Comparison between DINA simulation and TCV for the evolution of the sawtooth activity: left, the full pulse showing, from top to bottom: TCV Ip, TCV soft X-ray signal, DINA q(0); right, an expanded view of the same signals.
causes an excursion of the plasma elongation. The increase of elongation from 1.45 to 1.53 occurs at the same time that the closed loop is unstable. This observation is an example of non-time-in-variant behaviour of the experiment and the simu-lation, which can never be simulated by linearised models, for which time invariance is assumed.
Fig. 4. Comparison between TCV (left) and the DINA simula-tion (right) for a large excursion due to a square voltage pulse OH1 stimulation. The vertical position goes closed loop un-stable and returns to closed loop un-stable once the elongation is reduced.
[image:3.612.41.254.47.369.2] [image:3.612.278.494.381.549.2]departures from the experimental results than the latter.
2. JT-60U experiments
The method [3] used on TCV to measure the open loop plasma equilibrium response during the closed loop control of the vertically unstable plas-mas has been repeated on JT-60U. The locally linearised RZIP model of JT-60U has been re-derived using a clean Lagrangian approach. This removed a previous asymmetry in the determining equations concerning the radial derivative of the plasma resistance and the coupling between major radius and plasma current, but left most terms unchanged, see Eq. 1 with a similar structure as [3].
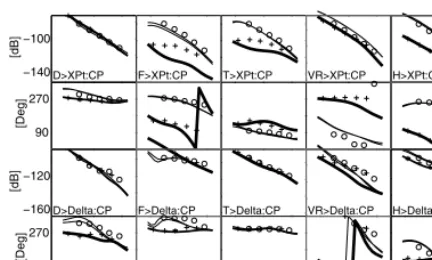
Fig. 5. Selected open loop responses from the JT-60U toka-mak. The heavy lines and (×) are the plasma-less model and data. The thin lines and () are the plasma data.
Acknowledgements
Thanks go to the TCV and JT-60U teams without whom the experimental results would not be comparable with the models. Two of the au-thors (RK, VL) thank the CRPP for their hospi-tality during visits to TCV. Two of the authors (JBL, AS) thank JAERI-Naka for their hospital-ity during visits to JT-60U. This work was partly supported by the Swiss National Science Founda-tion and three of the authors (DJNL, AS, JPW) were partly supported by the United Kingdom EPSRC.
References
[1] F. Villone, P. Vyas, J.B. Lister, R. Albanese, Nucl. Fusion 37 (1997) 1395.
[2] P. Vyas, F. Villone, J.B. Lister, R. Albanese, Nucl. Fusion 38 (1998) 1043.
[3] A. Coutlis, et al., Nucl. Fusion 39 (1999) 663.
[4] R.R. Khayrutdinov, V.E. Lukash, J. Comp. Phy. 109 (1993) 193.
data and thick lines for the model. The plasma responses are indicated as circles for the data and thinner lines for the RZIP model.