Abstract—In this study, the effects of methanol–gasoline
(M5, M10, M20, M30 and M50) fuel blends on the performance of a spark ignition (SI) engine were investigated. In the theoretical study, the four-cylinder, four-stroke, multi-point injection system SI engine was used. The results obtained from the use of methanol–gasoline fuel blends were compared to those of gasoline fuel. The results indicated that when methanol–gasoline fuel blends were used, the brake specific fuel consumption increased and engine performance parameters such as torque and power increases with increasing methanol amount in the blended fuel.
Index Terms—Alternative fuels, emissions, methanol blends,
spark-ignition engines
I. INTRODUCTION
LTERNATIVE fuels are derived from resources other than petroleum. When these fuels are used in internal combustion engines, they produce less air pollution compared to gasoline and most of them are more economically beneficial compared to oil. Last but not least, they are renewable. The most common fuels that are used as alternative fuels are natural gas, propane, ethanol, methanol and hydrogen. Lots of works have been written on engine operating with these fuels individually; but a small number of publications has compared some of these fuels together in the same engine [1–4]. The idea of adding low contents of ethanol or methanol to gasoline is not new, extending back at least to the 1970s, when oil supplies were reduced and a search for alternative energy carriers began in order to replace gasoline and diesel fuel. Initially, methanol was considered the most attractive alcohol to be added to gasoline. Methanol can be produced from coal, biomass or even natural gas with acceptable energy cost. Also, gasification of biomass can lead to methanol, mixed alcohols
Manuscript received March 11, 2014; revised March 19, 2014. The present document has been produced with the financial assistance of the European Social Fund under Operational Programme “Human Resources Development”. The contents of this document are the sole responsibility of the “Angel Kanchev” University of Ruse and can under no circumstances be regarded as reflecting the position of the European Union or the Ministry of Education and Science of Republic of Bulgaria. Project № BG051PO001-3.3.06-0008 “Supporting Academic Development of Scientific Personnel in Engineering and Information Science and Technologies”
S. P. Iliev is with the Department of Internal Combustion Engines, Faculty of Transport, University of Rues “Angel Kanchev”, 8 Studentska Str., 7017 Ruse, Bulgaria (phone: +359-82888-331; e-mail: [email protected]).
K. I. Hadjiev was with the Department of Internal Combustion Engines, Faculty of Transport, University of Rues “Angel Kanchev”, 8 Studentska Str., 7017 Ruse, Bulgaria (e-mail: [email protected]).
and Fischer-Tropsch liquids [5]. Since methanol can be produced from natural gas at no great cost, and is quite easy to blend with gasoline, this alcohol was seen as an attractive additive. However, when using methanol in practice it became clear that precautions had to be taken when handling it and that methanol is aggressive to some materials, such as plastic components and even metals in the fuel system [6].
The gasoline engine performance theory to link together with computer modeling of the engine thermodynamics in engine simulations are a great challenge, as the latter makes the most complete use of the former and the models used are becoming widespread. Engine modeling is a very large subject, in part because of the range of engine configurations possible and the variety of alternative analytical techniques or sub-models, which can be applied in overall engine models. Engine modeling is a fruitful research area and, as a result, many research laboratories have produced their own engine thermodynamics models with varying degrees of complexity, scope and ease to use [7].
Engine simulation is becoming an increasingly important engineering tool for time and cost efficiency in the development of internal combustion engines (ICE’s). The use of high speed computers and advances in computational methods has made it possible for the researchers to simulate and analyze complex physiological processes. The large number of results that are obtained by simulation are rather very difficult to be obtained experimentally. The use of Computational Fluid Dynamics (CFD) simulations allow researchers to understand flow behavior and quantify important flow parameters such as mass flow rates or pressure drops, provided that the CFD tools have been properly validated against experimental results. For reasons such as the aforementioned, CFD simulations have become a valuable tool in helping both the analysis and design of the intake and exhaust systems of an ICE’s. Many processes in engines are 3-D, but it requires greater knowledge and large computational time. Thus simplified 1-D simulation is often used. There are several components that manifest a complex three-dimensional flow behavior, such as turbo machinery or manifolds, which cannot be simulated properly by 1-D codes, and thus require viscous, 3-D codes.
Hence, it is a right choice to save computational time by simulating the complex components by means of a 3-D code and modeling the rest of the system with a 1-D code, i.e. the ducts. In this way, a coupling methodology between the 1-D and the 3-D code in the respective interfaces is required, and has become the objective of numerous authors [8–10].
In 1-D simulation, equations for conservation of mass, momentum, and energy are solved in time and in one dimension along the main flow direction in the engine pipes. Additional models, correlations, or measurements are
Theoretical Study of Engine Performance
Working on Methanol-Gasoline Blends
Simeon Penchev Iliev,
Member, IAENG
, Kiril Iliev Hadjiev
needed in 1-D for capturing 3-D phenomena such as flow over valves and combustion [11,12].
The present paper aims to develop the 1-D combustion model of four-stroke port-injection gasoline engine for predicting the effect of methanol–gasoline (M5, M10, M20, M30 and M50) fuel blends on the performance of a spark ignition (SI) engine. For this purpose, simulation of calibrated gasoline engine model was used as basic operating condition and the laminar burning velocity correlations of methanol–gasoline fuel blends for calculating the changed combustion duration. The engine performances: torque and specific fuel consumption were compared and discussed.
II. THEORETICAL STUDY A. Simulation setup
The 1-D engine simulation model is developed by using the software AVL BOOST and has been employed to study the engine performance working on methanol-gasoline blends.
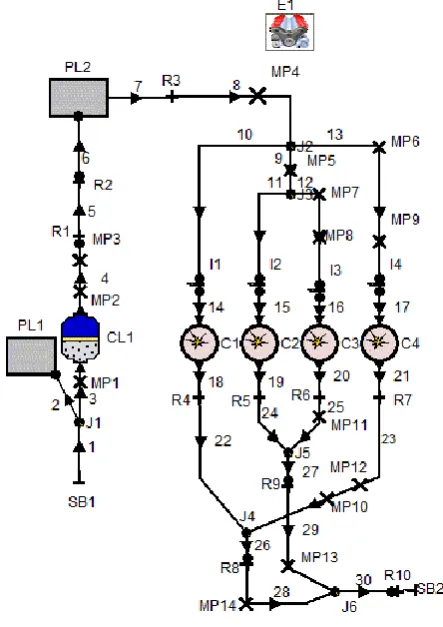
The engine model used in this simulation was performed on a four stroke, four cylinder spark ignition engine with port fuel injection. The gasoline engine model was calibrated by AVL and its layout is shown in Fig. 1 with engine specification shown in Table 1.
The pre-processing step of AVL Boost enable the user to model a 1-Dimensinal engine test bench setup using the predefined elements provided in the software toolbox. The various elements are joined by the desired connectors to establish the complete engine model using pipelines.
In Fig.1, E1 represents the engine while C1, C2, C3 and C4 represent the number of cylinders of the engine. MP1 to MP14 represent the measuring points. PL1 and PL2 represent the plenum. SB1 and SB2 are for the system boundary. The flow pipes are numbered 1 to 30. CL1 represents the cleaner. R1 to R10 represent flow restrictions.
B. Combustion Model
For the current study Vibe two zone model was selected for the combustion analysis. This model divides the combustion chamber into unburned and burned gas regions [13]. However the assumption that burned and unburned charges have the same temperature is dropped. Instead, the first law of thermodynamics is applied to the burned charge and unburned charge, respectively.
.
,
,
d dm h d dm h
d dQ d
dQ d
dV p d
u dm
b BB b BB b u
Wb F
b c b b
(1)
.
,
,
d dm h
d dm h d dQ d
dV p d
u dm
u BB u BB
B u Wu u
c u u
(2)
where,
u
dm
is the change of the internal energy in the cylinder,
d
dV
p
c is the piston work,
d
dQ
Fis the fuel heat input,
d
dQ
W [image:2.595.315.541.147.329.2]is wall heat loses,
Fig. 1. Layout of gasoline engine model.
TABLEI ENGINE SPECIFICATION
Engine Parameters Value
Bore (mm) 86
Stroke (mm) 86
Compression ratio 10,5
Connection rod length (mm) 143,5
Number of cylinder 4
Piston pin offset (mm) 0
Displacement (cc) 2000
Intake valve open (deg) Intake valve close (deg)
20 BTDC 70 ABDC
Exhaust valve open (deg) 50 BBDC
Exhaust valve close (deg) 30 ATDC
Piston surface area (mm2) 5809
Cylinder surface area (mm2) 7550
Number of strokes 4
[image:2.595.54.276.325.639.2]
d
dm
h
bu is the enthalpy flow from the unburned to the burned zone due to the conversion of a fresh charge to combustion products. Heat flux between the two zones is neglected.
d
dm
h
BBBB is the enthalpy due to blow by,
u
andb
in the subscript are unburned and burned gases. In addition, the sum of the volume changes must be equal to the cylinder volume change and the sum of the zone volumes must be equal to the cylinder volume.
d
dV
d
dV
d
dV
b u
(3)V
V
V
b
u
(4)The amount of mixture burned at each time setup is obtained from the Vibe function. For all other terms, like wall heat losses, etc., models similar to the single zone models with an appropriate distribution on the two zones are used [14].
III. RESULT AND DISCUSSION
The present study concentrated on the emissions and performance characteristics of the methanol-gasoline blends. Different concentrations of the blends 0% Methanol (M0), 5% Methanol (M5), 10% Methanol (M10), 20% Methanol (M20), 30% Methanol (M30) and 50% Methanol (M50) by volume) were analyzed using AVL BOOST at full load conditions for the speeds ranging from 1000 - 6500 rpm in the steps of 500rpm. The results are divided into different subsections based on the parameter analyzed.
A. Engine performance characteristics
The results of the brake power, torque, and specific fuel consumption for methanol gasoline blended fuels at different engine speeds are presented here.
Fig. 2 shows the influence of methanol gasoline blended fuels on engine brake power.
The brake power is one of the important factors that determine the performance of an engine. The variation of brake power with speed was obtained at full load conditions
for M5, M10, M20, M30, M50 and pure gasoline M0 using the CFD results. When the methanol content in the blended fuel was increased (M10, M20 and M30), the engine brake power slightly increased. The brake power can be attributed to the increase of the indicated mean effective pressure for higher methanol content blends. The heat of evaporation of methanol is higher than that of gasoline, providing air-fuel charge cooling and increasing the density of the charge. As a result, a higher power output is obtained. The brake power of gasoline was higher than those of M50 for all engine speeds.
Fig. 3 shows the influence of methanol gasoline blended fuels on engine torque. The increase of methanol content (M10 and M20) increased slightly the torque of the engine. The brake torque of gasoline was higher than those of M30 and M50.
Because of the existence of oxygen in the methanol chemical component, and the increase of methanol, lean mixtures are produced that decrease equivalence air-fuel ratio to a lower value, and due to the presence of oxygen in the combustion chamber, the burning ismore efficient.
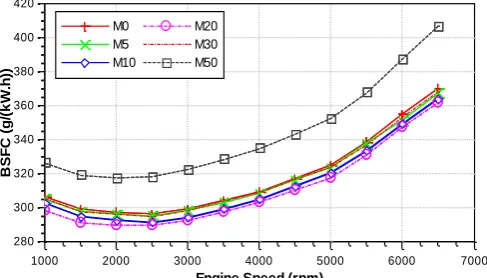
Fig. 4 indicates the variations of the BSFC for methanol gasoline blended fuels under various engine speeds. As shown in this figure, the BSFC increased as the methanol percentage increased. The reason is that heating value and stoichiometric air-fuel ratio are the smallest for these two fuels, which means that for specific air-fuel equivalence ratio more fuel is needed. The highest specific fuel consumption is obtained at M50 methanol-gasoline blend.
Also, a slight difference exists between the BSFC when using gasoline and when using methanol gasoline blended fuels (M5, M10, M20 and M30). As engine speed increased 10
20 30 40 50 60 70 80 90 100
P
o
w
e
r
(k
W
)
1000 2000 3000 4000 5000 6000 7000
Engine Speed (rpm)
M0 M5 M10
[image:3.595.309.548.195.324.2]M20 M30 M50
Fig. 2. Influence of methanol gasoline blended fuels on engine brake power.
110 120 130 140 150 160 170 180
T
o
rq
u
e
(N
.m
)
1000 2000 3000 4000 5000 6000 7000
Engine Speed (rpm)
M0 M5 M10 M20 M30 M50
Fig. 3. Influence of methanol gasoline blended fuels on engine torque.
280 300 320 340 360 380 400 420
B
SF
C
(g
/(k
W
.h
))
1000 2000 3000 4000 5000 6000 7000
Engine Speed (rpm)
M0 M5 M10
M20 M30 M50
[image:3.595.309.553.482.621.2] [image:3.595.45.290.567.704.2]reaching 2000 rpm, the BSFC decreased reaching its minimum value.
B. Engine emissions characteristics
The effect of the methanol gasoline blends on CO emissions for different engine speeds is shown in Fig. 5. It can be seen that when methanol percentage increases, the CO concentration decreases. This can be explained by the enrichment of oxygen owing to the methanol, in which an increase in the proportion of oxygen will promote the further oxidation of CO during the engine exhaust process. Another significant reason for this reduction is that methanol (CH3OH) has less carbon than gasoline (C8H18).
The effect of the methanol gasoline blends on HC emissions for different engine speeds is shown in Fig. 6. It can be seen that when methanol percentage increases, the HC concentration decreases. The concentration of HC emissions decreases with the increase of the relative air-fuel ratio. The reason for the decrease of HC concentration is similar to that of CO concentration described above.
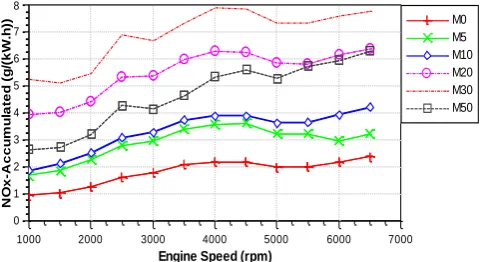
The effect of the methanol gasoline blends on NOx emissions for different engine speeds is shown in Fig. 7. It can be seen that when methanol percentage increases, the NOx concentration increase. When combustion process is closer to stoichiometric, flame temperature increases, therefore, the NOx emissions are increased.
IV. CONCLUSION
The present chapter demonstrates the influences of methanol addition to gasoline on SI engine performance and emissions characteristics.
Methanol gasoline blended fuels show lower brake power and brake torque and higher BSFC than gasoline.
When methanol percentage increases, the CO and HC concentration decreases.
Methanol gasoline blends the significant increase in NOx emissions with the increase of methanol percentage. When the combustion process is closer to stoichiometric, flame temperature increases, therefore, the NOx emissions are increased.
ACKNOWLEDGMENT
We are also eternally grateful to AVL-AST, Graz, Austria for granting use of AVL-BOOST under the university partnership program.
REFERENCES
[1] B. Hakan and D. Orhan. “Investigating the effects of LPG on spark ignition engine combustion and performance. „Energy Conversion and Management, 46:2317–33, 2005
[2] T. Melo, G. Machado, RT. Machado, Jr CR. Pereira Belchior and PP. Pereira, “Thermodynamic modeling of compression, combustion and expansion processes of gasoline, ethanol and natural gas with experimental validation on a flexible fuel engine.” SAE World Congress, 2007-24-0035, 2007.
[3] A. Shamekhi, N. Khtibzade and AH. Shamekhi, Performance and emissions characteristics of a bi-fuel SI engine fueled by CNG and gasoline. ASME paper, ICES2006-1387, 2006.
[4] A.M. Pourkhesalian, A.H. Shamekhi, and F. Salimi, “Alternative fuel and gasoline in an SI engine: A comparative study of performance and emissions characteristics,” Fuel, vol. 89, 2010, pp. 1056 – 1063, 2010.
[5] H. Chum and R. Overend, “Biomass and renewable fuels.” Fuel Processing Technology, vol. 71, pp. 187-195
[6] K. Egebäck, M. Henke, B. Rehnlund, M. Wallin and R. Westerholm, “Blending of Ethanol in Gasoline for Spark Ignition Engines – Problem Inventory and Evaporative Measurements.”, Rapport MTC 5407, May 2005.
[7] S. Iliev, K. Hadjiev, “Analysis of engine speed effect on the four stroke GDI engine performance” Proceedings in Manufacturing Systems, vol. 7, pp. 229-234, 2012
[8] A. Onorati, G. Montenegro and G. D’Errico, “Prediction of the attenuation characteristics of IC engine silencers by 1-D and multi-D simulation models,” SAE Technical Paper Series 2006, Tech. Rep. 2006-01-1541, doi:10.4271/2006-01-1541, 2006
[9] G. Montenegro and A. Onorati, “Modeling of silencers for IC engine intake and exhaust systems by means of an integrated 1D-multiD Approach,” SAE International Journal of Engines 1 (1), 466, doi:10.4271/2008-01-0677, 2009
[10] G. Montenegro, A. Onorati, F. Piscaglia, G. D’Errico, “Integrated 1D-Multi-D Fluid Dynamic Models for the Simulation of ICE Intake and Exhaust Systems,” SAE Technical Paper Series 2007, Tech. Rep. 2007-01-0495, doi:10.4271/2007-01-0495, 2007
[11] F. Lindström, H.E. Ångström, G. Kalghatgi, and C.E. Möller, “An Empirical SI Combustion Model Using Laminar Burning Velocity Correlations,” SAE2005-01-2106, 2005.
0 50 100 150 200 250 300 350
C
O
-A
c
c
u
m
u
la
te
d
(g
/(k
W
.h
))
1000 2000 3000 4000 5000 6000 7000
Engine Speed (rpm)
[image:4.595.44.289.88.231.2]M0 M5 M10 M20 M30 M50
Fig. 5. Influence of methanol gasoline blended fuels on CO emissions.
0.8 1 1.2 1.4 1.6 1.8 2 2.2 2.4 2.6 2.8
H
C
-A
c
c
u
m
u
la
te
d
(g
/(k
W
.h
))
1000 2000 3000 4000 5000 6000 7000
Engine Speed (rpm)
M0 M5 M10
[image:4.595.45.290.376.505.2]M20 M30 M50
Fig. 6. Influence of methanol gasoline blended fuels on CO emissions.
0 1 2 3 4 5 6 7 8
N
O
x
-A
c
c
u
m
u
la
te
d
(g
/(k
W
.h
))
1000 2000 3000 4000 5000 6000 7000
Engine Speed (rpm)
M0 M5 M10 M20 M30 M50
[image:4.595.49.290.631.762.2][12] H. Bayraktar, and O. Durgun, “Development of an empirical correlation for combustion durations in spark ignition engines,”
Energy Conversion and Management, vol.45, pp. 1419 – 1431, 2004. [13] J. B. Heywood, Internal combustion engine fundamentals,
McGraw-Hill, 1988
[14] AVL List Gmbh, AVL Boost – Theory, 2013
Dr. S. P. Iliev is an Assistant Prof. in