Abstract— The aim of this paper is to improve performance of a tea company using value chain analysis. The company value chain activities were investigated. Analysis of current production practice was analyzed using a failure mode & effect analysis (FMEA) technique to perform a risk assessment within the manufacturing process weaknesses. Linear programming method, based on fast moving product theory and the Lingo program was used as a tool to calculate a suitable model. Activity in warehouse storage was selected to improve and accommodate future product expansion and ordering. With the new warehouse layout, the use of space can be improved by more than 38% for storage products and the distance to transport can be reduced by almost 23%. The result can be used as a guideline for other companies in the tea industry to improve their process activities.
Index Terms—value chain management, efficiency improvement, tea industry, FMEA
I. INTRODUCTION
alue chain analysis is a method of studying and analyzing how value can be added in activities [1]. One of the main challenges in managing supply chains for most manufacturers is the uncertainty in contractual achievement to customers [2]. To ensure that value chain will improve, manufacturers required to work closely with their customers [3]. Moreover, the ASEAN Economic Community (AEC), which became effective on 2015, focuses on three policies, i.e., people, peace and prosperity. In short, the AEC is expected to transform ASEAN into a region with free movement of goods, services, investment, skilled labor, and free flow of capital. The formation of the AEC gave opportunities to business expansion of Thai food industry. It presents challenges and is hoped to bring more revenue to Thailand. This paper analyzes the activities within the value chain of tea product using of a tea company in Northern Thailand as a case study.
Food industry is supported by the Thailand Economic and Social Development Plan. The food industry in Thailand has high contribution which gives the economic potential of the food industry in ASEAN. Over the next 15 years, the ASEAN population is expected to grow up to 350 million. Most of them will have greater purchasing power [4]. The
Manuscript received March 1, 2017; revised March 30, 2017. This work were financially supported by Chiang Mai University via the Excellence Center in Logistics and Supply Chain Management (E-LSCM) and the Thailand Research Fund – Research and Researchers for Industry.
K. Y. Tippayawong is with the Department of Industrial Engineering, Faculty of Engineering, Chiang Mai University, Chiang Mai, Thailand. (corresponding author: +66-5394-4207; fax: +66-5394-4207; e-mail: [email protected])
P. Teeratidyangkul is with the Department of Industrial Engineering, Faculty of Engineering, Chiang Mai University, Chiang Mai, Thailand.
S. Ramingwong is with the Department of Industrial Engineering,
food industry also contributes to other supporting industries, including packaging, such as cans, which leads to employment and higher income. The food industry is an industry with the potential to produce for domestic consumption and for export to other countries. Thailand has a solid background in agricultural production including many qualified workers. Furthermore, the manufacturing sector that uses modern technology can develop a product to meet the needs of the market. Thailand aims to increase competitive advantage in this food industry to stay on top in providing sufficient and quality food.
Tea is a traditionally popular beverage. The agricultural output of the tea leaves are derived through different processes, leading to the appearance of different flavored teas. The culture of tea and drinking tea are unique in several countries. Tea is also a popular drink for Europe and china. Future of the tea market will continue to grow due to healthy consumption. The nutrients in tea are useful as antioxidants. This paper presents a case study of a tea company in Northern Thailand. The company was a pioneer of Thailand’s tea industry in 1941 before transforming into an international tea organic plantation as it is known today.
II. LITERATURE REVIEW
A. Value Chain Management
Originally, the value chain concept, proposed by Porter, showed how activities create value for the customer and how managed activities can create competitive advantage. The core of Porter’s work is the idea of linking the boundary between activities. Porter considers that as a part of a business strategy, active management and improvement of these linkages is important as costs can be eliminated [5]. Value chain analysis is used to comprehend socioeconomic and power relationships in the production chain from the initial starting material to a final product. It takes a financial view of the sequential value creation process in a network of firms [6]. The value chain can be used to understand how to plan and improve efficiency in industrial operations and practices as well as to strengthen the academic premise on the economics and optimality of the business value chains [7]. Moreover, value chain analysis can be applied to the food industry to develop and improve the efficiency that brings benefits for wide range of producers and consumers and improve demand management [8, 9].
Nowadays, the organic product value creation grows through a well-coordinated supply chain. Responsive to consumers’ personal values and agri-food value chain from a consumer or from a supply chain perspective are important [10]. In this research, value chain management was applied to a case study to improve company efficiency that creates
Analysis and Improvement of a Tea Value Chain
Korrakot Y. Tippayawong, Punnakorn Teeratidyangkul, and Sakgasem Ramingwong
B. Tea Industry in Thailand
The food industry uses raw materials from agricultural sector such as livestock, fisheries and crops. Technology of food processing and preservation is used to produce large quantities of food products. Recently, there has been a growing concern about fair trade and safe working conditions for producers and employees as well as sustainability and natural resource management. The principles of organic agriculture are wide ranging and include concerns for safe food production, environment, animal welfare, and social justice [12]. Thailand has a large agricultural production area, accounting for about 45% of the entire country. Thailand ranks among the world top food producers in several food categories. Thailand exports approximately 3,000,000 tons of food to various countries, valued at around 1,000 million US dollars [13].
The tea supply chain is complex, with many actors, producers, collectors, traders/brokers and packers involved [13]. The value chain with a wide range of stakeholders and activities involves transforming tea leaves to the beverage for consumer. Likewise, transforming the tea industry into a sustainable economic sector presents an extraordinary challenge to all stakeholders. Cooperation between producers, governments, traders, processors and retailers is necessary to improve the efficiency of people involved in the tea supply chain.
III. METHODOLOGY
A. Value Chain Analysis
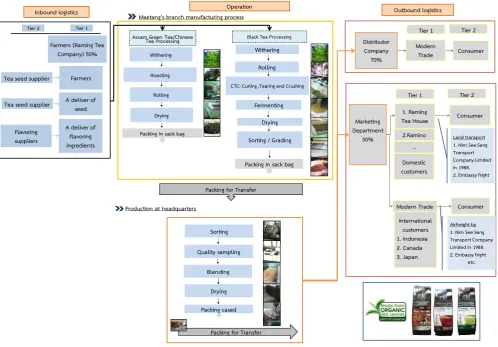
The concept of value chain is to help understand the roles of each activity in the company’s supply chain (Figure 1). Management of the supply chain can identify elements of the activities that are affected by internal and external factors along the value chain. In the case study, there were five primary activities and four supporting activities. These activities of the company were analyzed by using value chain analysis shown in Table 1.
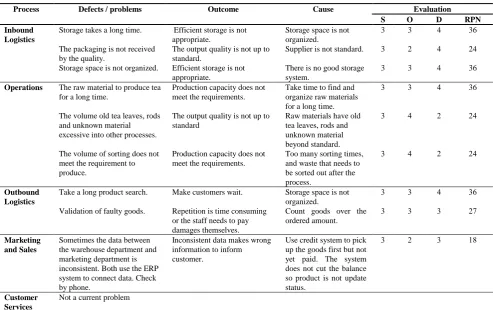
Failure mode and affect analysis (FMEA) was used to perform a risk assessment within the manufacturing process to identity weaknesses or deficiencies which may affect the product or products. The risk was calculated for each block using FMEA. It improves operational performance of the production cycles and reduces their risk level [14, 15]. The risk was calculated as ratio of three coefficients: severity of failures (S), probability of occurrences (O) and detection (D). Each coefficient was assigned in the range from 1 to 4 and the risk priority number (RPN) was calculated and shown in a simple equation as (RPN = S x O x D). The results of FMEA was rated based on priority by production supervisor and quality control supervisor, shown in Table 2. After the risk assessment by FMEA, it was found that the process in warehouse storage issue that occur on many issues. The evaluated RPN was used to identify problems to improve.
Inbound logistics
Tier 1
Tier 2
Tea seed supplier Tea seed supplier
Flavoring suppliers
Farmers (Raming Tea Company) 50%
Farmers A deliver of
seed A deliverof
flavoring ingredients
Operation Outbound logistics
Tier 1 Tier 2 Distributor
Company %
Modern
Trade Consumer
Packing for Transfer Maetang's branch manufacturing process
Production at headquarters
Marketing Department
30%
Domestic customers 1. Raming Tea House 2.Ramino
Consumer
Land transport 1. Nim See Seng Transport Company Limited in 1988. 2. Embassy fright
International customers Indonesia Canada Japan
Consumer
Airfreight by 1. Nim See Seng Transport Company Limited in 1988. 2. Embassy fright
etc.
Blending Sorting Quality sampling
Drying Packing cased
Assam Green Tea/Chinese Tea Processing
Withering
Roasting
Rolling
Drying
Packing in sack bag
CTC: Curling ,Tearing and Crushing
Fermenting Drying Sorting / Grading Packing in sack bag
Black Tea Processing
Withering Rolling
Tier 1 Tier 2
...
Modern Trade
[image:2.595.53.552.409.756.2]Packing for Transfer
Table 1 Analysis result of current value chain.
Activities Issues
Inbound Logistics - Most tea leaves are from the company plantation. Some of the tea leaves are imported that will affect the quality and taste of
the tea. Staff concerned about warehouse storage that takes a long time because it takes time to find storage space and packaging does not meet quality.
Operations - Production of the company is for mass production and customization. Production procedure is complex and consists of many
small steps in order to obtain products such as tea, dried tea leaves extraction. This process requires staff to sort leaves, find bud's tea leaves or other foreign materials.
- Flavor of the tea from different processes is not constant. It needs to be adjusted that requires further processing and long lead time.
- Contamination of old tea leaves, rods and unknown materials exceed standard. The raw materials for the production from warehouse take long time.
Outbound Logistics - Currently, exports to Europe, Japan and Indonesia account for 20% and domestic customers 80%.
- The problems in outbound logistics are long time to find materials and the accuracy of the wrong goods, such as over-count the goods ordered.
Marketing and Sales
- The company has market planning unit that has begun a project to expand the market to neighboring countries such as Burma. However, AEC market is small.
- Sometimes the data between the warehouse and the marketing departments is inconsistent, though both departments use the ERP system to connect data. They have to recheck by phone that makes them waste time.
Table 2 Failure mode and affect analysis result
Process Defects / problems Outcome Cause Evaluation
S O D RPN
Inbound Logistics
Storage takes a long time. Efficient storage is not
appropriate.
Storage space is not organized.
3 3 4 36
The packaging is not received by the quality.
The output quality is not up to standard.
Supplier is not standard. 3 2 4 24
Storage space is not organized. Efficient storage is not
appropriate.
There is no good storage system.
3 3 4 36
Operations The raw material to produce tea
for a long time.
Production capacity does not meet the requirements.
Take time to find and organize raw materials for a long time.
3 3 4 36
The volume old tea leaves, rods and unknown material excessive into other processes.
The output quality is not up to standard
Raw materials have old tea leaves, rods and unknown material beyond standard.
3 4 2 24
The volume of sorting does not meet the requirement to produce.
Production capacity does not meet the requirements.
Too many sorting times, and waste that needs to be sorted out after the process.
3 4 2 24
Outbound Logistics
Take a long product search. Make customers wait. Storage space is not
organized.
3 3 4 36
Validation of faulty goods. Repetition is time consuming
or the staff needs to pay damages themselves.
Count goods over the ordered amount.
3 3 3 27
Marketing and Sales
Sometimes the data between the warehouse department and marketing department is inconsistent. Both use the ERP system to connect data. Check by phone.
Inconsistent data makes wrong information to inform customer.
Use credit system to pick up the goods first but not yet paid. The system does not cut the balance so product is not update status.
3 2 3 18
Customer Services
Not a current problem
B. Linear Programming
Layout of the product placement was analyzed using the linear programming method, based on fast moving product theory (fast mover closest to the door) and the Lingo program to calculate a suitable storage model that accommodate future product expansion and ordering. The equation used to calculate the product placement area using the following computer program (Lingo).
Objective function:
1 39
1 36
1
j ij i ii j
q f
Min
d
x
(1)Constraints:
i i
j
x
ijq
: 36
1
(2)
i
x
ijc
j i
: 39
1
(3)
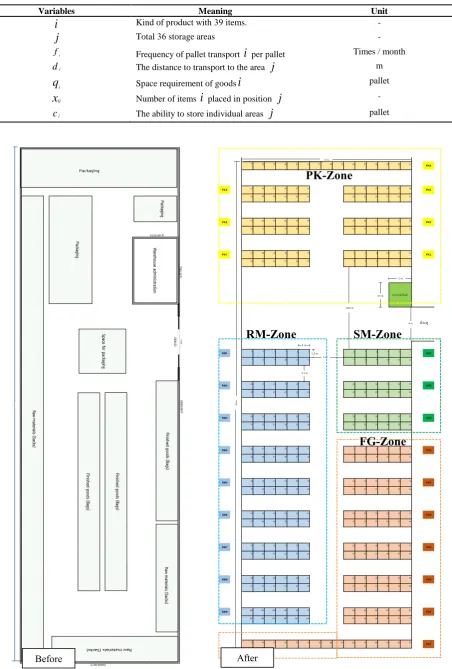
[image:3.595.57.551.313.623.2]Table 3 Variables used to calculate the product area using the Lingo computer program.
Variables Meaning Unit
i
Kind of product with 39 items. -j
Total 36 storage areas -fi Frequency of pallet transport
i
per pallet Times / monthdj The distance to transport to the area
j
mq
i Space requirement of goodsi
palletx
ij Number of itemsi
placed in positionj
-cj The ability to store individual areas
j
palletFig. 2. Original and proposed warehouse space of the case study.
37 38 39 40 41 42 43 44 45 46 47 48 49 50 51 PK4
PK5 57 56 55 54 53 52 31 32 33 34 35 36 PK3
58 59 60 61 62 63 30 29 28 27 26 25
PK6 69 68 67 66 65 64 19 20 21 22 23 24 PK2
70 71 72 73 74 75 18 17 16 15 14 13
PK7 81 80 79 78 77 76 7 8 9 10 11 12 PK1
82 83 84 85 86 87 6 5 4 3 2 1
RM1 6 5 4 3 2 1 6 5 4 3 2 1 SM1
7 8 9 10 11 12 7 8 9 10 11 12
RM2 18 17 16 15 14 13 18 17 16 15 14 13 SM2
19 20 21 22 23 24 19 20 21 22 23 24
RM3 30 29 28 27 26 25 30 29 28 27 26 25 SM3
31 32 33 34 35 36 31 32 33 34 35 36
RM4 42 41 40 39 38 37 6 5 4 3 2 1 FG1
43 44 45 46 47 48 7 8 9 10 11 12
RM5 54 53 52 51 50 49 18 17 16 15 14 13 FG2
55 56 57 58 59 60 19 20 21 22 23 24
RM6 66 65 64 63 62 61 30 29 28 27 26 25 FG3
67 68 69 70 71 72 31 32 33 34 35 36
RM7 78 77 76 75 74 73 42 41 40 39 38 37 FG4
79 80 81 82 83 84 43 44 45 46 47 48
RM8 90 89 88 87 86 85 54 53 52 51 50 49 FG5
91 92 93 94 95 96 55 56 57 58 59 60
RM9 102 101 100 99 98 97 66 65 64 63 62 61 FG6
103 104 105 106 107 108 67 68 69 70 71 72
73 74 75 76 77 78 79 80 81 82 83 84 85 86 87 FG7
ธุรการคลังสินค้า 15 m.
60
m.
m. 3m.
0.8m. 3.5m.
2m.
4m.
m. .5m.
PK-Zone
SM-Zone
FG-Zone
RM-Zone
After
15 00 0.00
60
00
0.00
6000
.00
7543
.16
4125.00
Wa
reh
ous
e adm
inist
ratio
n
Packaging
Pac
kagi
ng
Ra
w
ma
teria
ls (S
ack
s)
Pac
kagi
ng
Fin
ishe
d go
ods
(Ba
gs)
Fin
ishe
d go
ods
(Ba
gs)
Fin
ishe
d go
ods
(Ba
gs)
Spa
ce f
or p
ack
agin
g
In
-O
ut
Ra
w
ma
teria
ls (S
ack
s)
60
me
tre
IV. RESULTS AND DISCUSSION
A. Improvement of Warehouse Layout
The size of the warehouse is 15 m wide, 60 m long and 5 m high. Originally, the zone was divided into four categories: Administration warehouse, Raw material, Packaging and Finished goods, as shown in Figure 2. The researchers proposed that a selective placement where the warehouse staff can access the product immediately. The area can be divided according to Table 4, into 4 zones: - Raw materials (RM) have 55 items packed. When packed, it can be packed in 360 kg or 6 sacks/pallet. During high season the product has 91 pallets.
- Finished goods (FG) have 32 items packed. When packed, it can be packed in 40 and 60 boxes/pallet. During high season the product has 70 pallets.
- Semi finished goods (SM) have 39 items. When fully packed, 250 bags/pallet can be packed. During high season the product has 31 pallets.
- Packaging (PK) has 57 items and dividing the storage into rolls and envelopes. During high season the product has 74 pallets.
The new layout design will increase the number of pallets to 318 pallets by 15 m wide by 60 m or 900 m2, while the layout of the old warehouse layout has only 230 pallets in the same space. If stacked is not organized, employee cannot use hand lift to receive goods. The employee must walk across the product to lift the product out. The current storage
system uses a storage area of 3.91 m2/pallet, whereas a new storage system uses storage area of 2.83 m2/pallet. Therefore, the new storage system can increase the efficiency of the space utilization by 38% compared to the current storage system. There is also a computer program which serves to allocate product areas.
B. Improvement of Allocated Product Placement
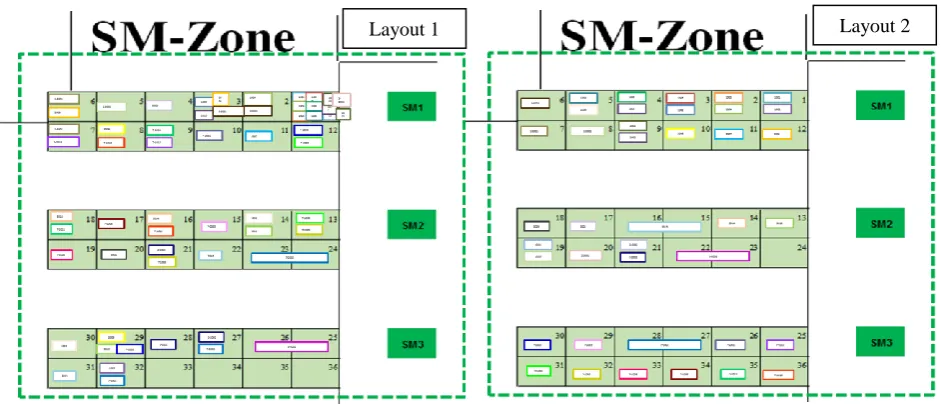
The analysis of the positioning of each item focuses on the distance that store shortest items without taking into account the storage of the same product (Layout 1). After consultation with the warehouse staff, the layout 2 is realized, based on the same items in the same neighborhood to work more easily. Table 5 shows moving distance of each product and comparative analysis of the inventory arrangement in the warehouse.
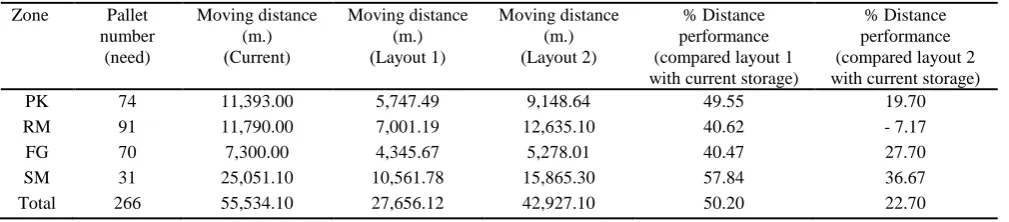
[image:5.595.47.551.452.547.2]The total distance of layout 1 is calculated to be about 27,650 m per month, while the total distance for layout 2 is about 42,900 m per month. However, from the warehouse staff opinions, the layout 2 is more appropriate than layout 1 because it focuses on the same products in the same neighborhood that can work more easily. For example storage in the SM zone is shown in Figure 3. When placing the product in the designated layout, it can reduce the distance from the current setup by 22.7%, due to the placement of raw materials and goods according to frequency of picking. Products with high picking frequency are near the door and low frequency products are far from the door. It can reduce the distance for picking goods.
Table 4 Storage areas after adjustment.
Main area (zone)
Sub area (pallet sequence)
Pallet number (Before)
Pallet number (Need)
Pallet number (After)
PK 1 - 7 1 - 87 65 74 87
RM 1 - 9 1 - 108 80 91 108
FG 1 - 7 1 - 87 60 70 87
SM 1 - 3 1 - 36 25 31 36
Total 318 230 266 318
Table 5 Comparison of the overall distance in warehouse layout per month.
Zone Pallet number
(need)
Moving distance (m.) (Current)
Moving distance (m.) (Layout 1)
Moving distance (m.) (Layout 2)
% Distance performance (compared layout 1 with current storage)
% Distance performance (compared layout 2 with current storage)
PK 74 11,393.00 5,747.49 9,148.64 49.55 19.70
RM 91 11,790.00 7,001.19 12,635.10 40.62 - 7.17
FG 70 7,300.00 4,345.67 5,278.01 40.47 27.70
SM 31 25,051.10 10,561.78 15,865.30 57.84 36.67
[image:5.595.41.546.594.705.2]Fig. 3. Comparison of sorting rods tea and old tea leaves (before – after).
V. CONCLUSION
In this work, analysis and improvement of a Thai tea company by value chain management technique was investigated. The risk assessment was used to identify weaknesses or deficiencies of the manufacturing process by FMEA. For the case study, the activity in the warehouse storage was selected for improvement. The proposed solution consists of a new layout of the warehouse, where the use of space can be improved by 38%. The linear programming method based on fast moving product theory was effective as a tool to calculate a suitable storage model that can accommodate future product expansion and ordering. The distance to transport may be reduced by 22.7%.
ACKNOWLEDGMENT
The authors would like to thank Raming Tea Co., Ltd. for information and technical support.
REFERENCES
[1] Porter M. E., Competitive Advantage: Creating and Sustaining
Superior Performance. The Free Press, Macmillan Publishing, New
York, 1985.
[2] Hilletofth P., “How to develop a differentiated supply chain strategy,”
Industrial Management & Data Systems, vol. 109, no. 1, pp. 16-33,
2009.
[3] Collin J., and Lorenzin D., “Plan for supply chain agility at Nokia:
lessons from the mobile Infrastructure industry,” International
Journal of Physical Distribution & Logistics Management, vol. 36
no. 6, pp. 418-30, 2006.
[4] Food Industry Asia, “Food industry is an important partner to the
AEC,” available at http://foodindustry.asia/food-industry-is-an-important-partner-to-the-aec, accessed on 25 September 2015.
[5] Bailey K., and Francis M., “Managing information flows for
improved value chain performance,” International Journal of
Production Economics, vol. 111, pp.2-12, 2006.
[6] Brooker A., Johnston D. and Heinrich M., “Value chains of herbal
medicines—Research needs and key challenges in the context of
ethnopharmacology,” Journal of Ethnopharmacology, vol.140, pp.
624– 633, 2012.
[7] Kess P., Law K., Kanchana R. and Phusavat K., “Critical factors for
an effective business value chain,” Industrial Management & Data
Systems, vol. 110, no. 1, pp. 63-77, 2010.
[8] Bloom D. J. and Hinrichs C. C., “Moving local food through
conventional food system infrastructure: Value chain framework
comparisons and insights,” Renewable Agriculture & Food Systems,
vol. 26, no. 1, pp. 13–23, 2010.
[9] Taylor H. D., and Fearne A., “Demand management in fresh food
value chains: a framework for analysis and improvement,” Supply
Chain Management, vol. 14/5, pp. 379–392, 2009.
[10] Vieira M. L., De Barcellos D. M., Hoppe A., and Silva B. S., “An
analysis of value in an organic food supply chain,” British Food
Journal, vol. 115, no. 10, pp. 1454-1472, 2013.
[11] Rieple A., and Singh R., “A value chain analysis of the organic
cotton industry: The case of UK retailers and Indian suppliers,”
Ecological Economics, vol. 69, pp. 2292–2302, 2010.
[12] Browne A. W., Harriss P. J. C., Hofny-Collins A. H., Pasiecznik N.,
and Wallace R. R., “Organic production and ethical trade: definition
practice and links,” Food Policy, vol. 25, pp. 69–89, 2000.
[13] International Fund for Agricultural Development, “Small-scale
producers in the development of tea value-chain partnerships,”
available at http://www.ifad.org/pub/factsheet/value_chain/
commodity_tea.pdf, accessed on 25 October 2015.
[14] Scipioni A., Saccarola G., Centazzo A. and Arena F., (2002), “FMEA
methodology design, implementation and integration with HACCP
system in a food company,” Food Control, vol.13, pp. 495-501,
2002.
[15] Trafialek J., and Kalanowski W., “Application of failure mode and
effect analysis (FMEA) for audit of HACCP system,” Food Control,
vol. 44, pp. 35-44, 2014.