Abstract— Activated bentonite was characterized and used as an
adsorbent for the removal of Fe ions from acid mine drainage (AMD) sourced from a gold mine site. Adsorption experiments were carried out under varying operating conditions in a glass continuous stirred batch reactor by agitation of bentonite clay with a fixed volume of AMD.
The adsorption behaviour of the adsorbent was investigated and the adsorption kinetics, thermodynamics and mechanism determined. The effect of adsorbent mass was initially investigated and thereafter the most optimum mass loading used for the rest of the adsorption experiments. The AAS was used to determine sample concentrations and the values obtained were used to calculate the resulting metal concentrations at 4 different time intervals. AMD concentrations of 65, 280 and 737 mg/L were used and the results obtained compared to establish the variation of percentage metal removal with varying concentration. Adsorption isotherms and kinetics were then determined from the data at temperatures of 25, 35 and 45°C respectively. The effect of particle size was determined by using varying particle sizes after particle size distribution was determined using Malvern software. Other analysis performed on the adsorbent powder, were X-ray fluorescence, X- ray diffraction and the scanning electron microscopy.
Modified bentonite of particle size 355 µm at 8% m/v mass loading, gave an overall removal of 99.02%. Overall, highest removal was also observed at a temperature of 45°C, as thermodynamics proved that the adsorption process was favourable at higher temperatures. The experimental data fitted perfectly to the Langmuir isotherm and followed pseudo second order at temperatures of 25°C and 45°C and followed pseudo first order at a temperature of 35°C.
Index Terms— Iron removal, adsorption, bentonite clay, acid
mine drainage (AMD)
I. INTRODUCTION
Heavy metal is any one of a number of elements that exhibit metallic properties, which includes transition metals, lanthanides, actinides as well as the metalloids arsenic and antimony. The term heavy metal arose with discussions of pollutants discharged in the environment in the form of air, water or soil contaminants [1].
Manuscript received June 20, 2017; revised July 18, 2017. This work was supported by the Department of Chemical Engineering, University of Johannesburg.
A. Vessal is a Lecturer with the Department of Civil Engineering, University of Johannesburg, Doornfontein, Johannesburg 2028 (corresponding author phone: +27 11 5596876; fax: +27 11 5596057; email: aliv@ uj.ac.za).
Typically water–related environmental problems associated with polluting discharges from coal and metal mines are due to acid mine drainage (AMD) and leaching of contaminants such as sulphates, arsenic, uranium and heavy metals such as chromium, cadmium and mercury etc. into groundwater. Heavy metals contained in industrial effluents, constitute a major source of metal pollution of the environment, since they are persistent and cannot be degraded or destroyed and can be biomagnified by aquatic organisms. Main industries containing heavy metals in its effluents are mining, metallurgical, nuclear power plants, metal coating, and battery production [2].
General factors affecting formation of AMD are pH, temperature, oxygen content of the gas phase, oxygen concentration in the water phase, degree of saturation with water, chemical activity of Fe3+, surface area of the exposed metal sulphide, chemical activation energy required to initiate acid generation and bacterial activity [3]. Problems associated with mine drainage include, contaminated drinking water, disrupted growth and reproduction of aquatic plants and animals, corroding effects of acid on parts of infrastructure such as bridges.
The most generally applied treatment method of AMD involves the addition of alkine reagents to increase the pH and precipitate the dissolved metals as hydroxides [4], followed by the collection and processing, and, typically, burial of sludge which contains toxic metals. Although this treatment can provide effective remediation, it has the disadvantages of high operational costs and problems related to the disposal of the bulky sludge [5].
Research based on published papers and currently underway, is mainly focused on finding cheaper, yet effective adsorbent, to lower the cost of the adsorption process thus making it a much more attractive solution for industries. In a study by Akpomie et al. [6], where a low cost Nigerian bentonite was used to extract nickel and manganese from a binary system
.
It was hypothesized that this Nigerian bentonite could adsorb these metal ions and thus its efficacy was tested by studying the effect of different parameters on the adsorption of these ions onto the adsorbate. Another study of reference, which investigated the adsorption of copper and nickel from AMD using activated bentonite by Ntuli et al [7].Reported that activated bentonite, can be used as an adsorbent for copper and nickel adsorption from AMD. In this paper, it was reported that a 6% solid loading of activated bentonite could remove 94.85% Cu and 92.05% Ni. It was further recommended to use AMD from different places in order to establish the effectiveness of activated bentonite.
Iron Removal from Acid Mine Drainage Using
Activated Bentonite Clay
The aim of this study is to establish the effectiveness of modified bentonite as an adsorbent in the removal of iron metal ions from AMD effluent. The effect of adsorbent mass and particle size along with AMD solution concentration and reactor optimum operating temperature on the removal of Fe ions was established from experimental data obtained .The mechanisms of metal removal and thermodynamic and kinetic parameters of the system were established through kinetic studies.
II. MATERIAL AND METHODS
A. Materials
Acid mine drainage (effluent) was collected from a local gold mine site in Randfontein, South Africa and was analyzed to find the concentration of heavy metals and other elements present. G&W Base Minerals supplied activated bentonite, which was used as the adsorbent. Analytical grades of FeSO4·7H2O was supplied by Sigma Aldrich.
B. Apparatus
Adsorption experiments were conducted in a glass continuous batch reactor. pH and conductivity were measured using Metler Toledo dual meter (Sevenduo pH/conductivity with Metler Toledo InLabPro ISM pH electrode and Metler Toledo InLab738 ISM conductivity probe). An Atomic Absorption Spectrometer (Thermo scientific ICE 3000 Series), was used for determining the concentration of iron (II) metal ion in AMD solution before and after adsorption. XRF (Rigaku ZSX Primus II) was used to determine elemental composition of the bentonite clay. Particle size distribution was measured using laser diffraction technique (Malvern Mastersizer 2000 model Tescan Vega 3 XMU). Specific surface area was measured by BET technique based on N2 adsorption-desorption using an ASAP 2020 (Micrometrics) instrument. A Buchner funnel was used to filter the collected sample.
C. Experimental Procedure
2.48g of Iron (II) heptahydrate was added to 400 ml of raw AMD. This was then stirred and heated on a hot plate thereby dissolving the solids. The sample was then acidified before metal analysis as described below.
Sample digestion was achieved by quantitatively transferring 100 ml of AMD solution to a 250 ml volumetric flask. The sample was then acidified with 2 ml of 1:1 HNO3: H2O and 1 ml of 1:1 HCl: H2O. The volumetric solution was then covered by a slightly raised watch glass and placed on a hotplate to provide evaporation at not more than 358.18K. The volume of the sample was then reduced to about 20 ml by evaporation. After cooling, 20 ml of the digested sample was quantitatively transferred to a 50 ml volumetric flask and made up to volume with distilled water. The sample was then ready for AAS analysis. The calibration standards
24 g, 32 g and 40 g samples of activated bentonite where each mixed with 400 ml of unfortified AMD and agitated at 450 rpm inside a continuous stirred batch reactor maintained at
25°C for 2 h. At every 30 min interval, the solution was withdrawn from the reactor and the pH and conductivity measured. The solutions were then filtered using a Buchner funnel and acidified with 1 drop of 55% concentrated nitric acid before metal analysis using AAS.
AMD effluent of concentrations 65 mg/L, 280 mg/L and 737 mg/L were used for the adsorption experimental work. The initial AMD concentration of 280 mg/L was increased to 737 mg/L by dissolving 2.48 g of iron (II) sulphate heptahydrate to increase iron metal ions in solution, also the initial concentration was diluted to a concentration of 65 mg/L. A particle size of 300-425 µm was selected and prepared from the bentonite clay sample. The sample was initially crushed in a cone crusher and pulverized before being sieved using sieve shakers to obtain the particle size range.
Temperatures of 25°C, 35°C and 45°C were obtained by adjusting the set point of the temperature controller.
III. RESULTS AND DISCUSSION
A.XRF analysis
[image:2.612.309.571.398.489.2]Table 1 shows the elemental composition of modified bentonite. Silica was the major constituent followed by aluminium oxide. This was expected, as bentonite is aluminium phyllosilicate clay, with sheets of silicates forming parallel sheets of silica tetrahedral with Si2O5.
Table 1: XRF analysis of modified bentonite
Component Result (mass %)
SiO2 80.191
Al2O3 11.618
Fe2O3 2.816
MgO 2.937
Na2O 0.872
CaO 0.381
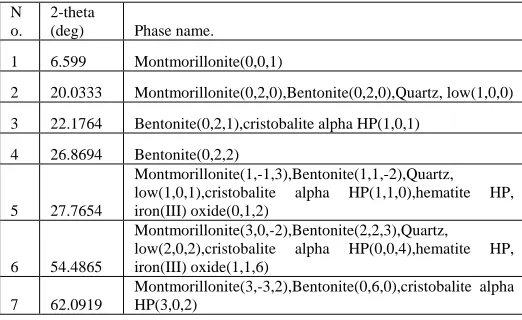
B.XRD analysis
Major constituents of modified bentonite are montmorillonite, quartz and trymidite as shown in the Table 2.
Table 2: XRD spectrum peak list of modified bentonite
N o.
2-theta
(deg) Phase name.
1 6.599 Montmorillonite(0,0,1)
2 20.0333 Montmorillonite(0,2,0),Bentonite(0,2,0),Quartz, low(1,0,0) 3 22.1764 Bentonite(0,2,1),cristobalite alpha HP(1,0,1)
4 26.8694 Bentonite(0,2,2)
5 27.7654
Montmorillonite(1,-1,3),Bentonite(1,1,-2),Quartz, low(1,0,1),cristobalite alpha HP(1,1,0),hematite HP, iron(III) oxide(0,1,2)
6 54.4865
Montmorillonite(3,0,-2),Bentonite(2,2,3),Quartz, low(2,0,2),cristobalite alpha HP(0,0,4),hematite HP, iron(III) oxide(1,1,6)
7 62.0919
[image:2.612.308.569.572.732.2]Fig. 1 Modified bentonite XRD spectrum 1
C. SEM analysis
The powder morphology was studied by means of SEM micrographs at a magnification of 2000. It can be noted that activated bentonite occurs as ultrafine, fluffy and mostly spherical crystals forming a dense aggregate. The bentonite morphology displayed a “cornflake” texture that is typical and representative of montmorillonite [8]. As montmorillonite is hydrated sodium calcium aluminium magnesium silicate hydroxide, the EDS spectrum obtained showed the highest peak of silica along with other major peaks for oxygen, calcium, aluminium, magnesium and sodium.
D. Particle size distribution
The PSD of modified bentonite was characterised using Malvern software, results obtained showed highest volume % for particle size of 11.25µm but as the particle size was increased, volume % decreased. For this study, particles with a particle size range of 300µm-425µm were used and their volume percentage was found to be between 0.5- 1 %.
E. Effect of solid loading
The results obtained showed a removal of 99.02%, 99.09% and 99.24% respectively after 2h. From Figure 2 it is noted at the end of adsorption period a 40 g (10%) mass loading gave the highest removal, however, an 8% mass loading was chosen for all other adsorption experiments as at this loading the equilibrium was reached after 5400 s and while for other mass loadings equilibrium was not reached. The increase in percent
removal was attributed to the increase of adsorption sites with increased mass loading of adsorbent. According to theory and previous experimental work, results have shown that the more the sites available, the higher adsorption [9].
Fig. 2 Effects of solids loading.
E. Effect of temperature
[image:3.612.324.508.457.596.2]and clay mineral was an exothermic process [10]. The effect of temperature is further explained on the discussion of isotherms.
[image:4.612.320.558.284.622.2]Fig. 3 Effect of temperature F. Effect of concentration
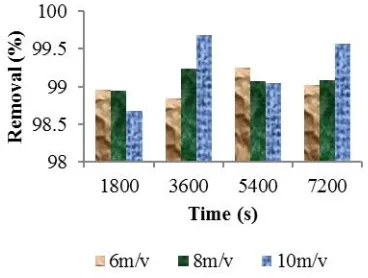
Figure 4 shows the removal % with varying concentration.
Fig. 4 Removal % with concentration.
From Figure 4, a decrease in metal removal was reported with an increase in metal concentration. At a concentration of 65 mg/L, the highest removal of 99.74% was recorded and the lowest removal of 45.25% recorded at a concentration of 737 mg/L. The initial AMD concentration of 280 mg/L was increased to 737 mg/L by dissolving 2.48 g of iron (II) sulphate heptahydrate, also the initial concentration was diluted to a concentration of 65 mg/L as outlined in methodology. The decrease in metal removal was attributed to the increase in competition amongst metal ions for adsorption sites on the adsorbent [11]. At higher concentrations there are more metal ions but the adsorbent surface area remains unchanged as the mass loading is fixed, therefore the higher the concentration of metal ions the lower the adsorption.
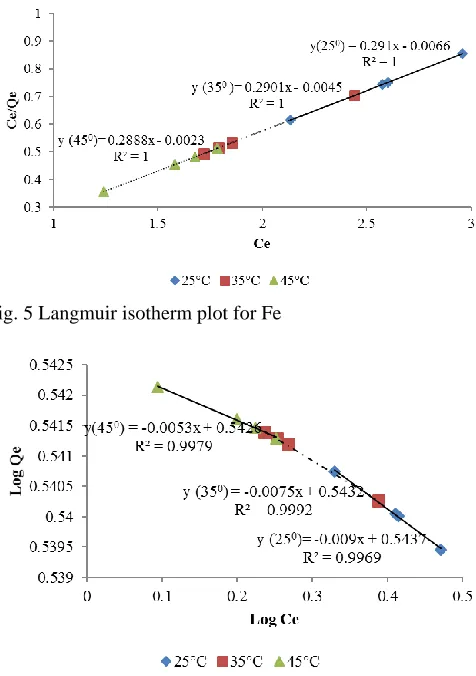
G. Adsorption Isotherms
The Langmuir isotherm gave the best fit for the experimental data. The Langmuir isotherms parameters calculated are summarized in table 3.
TABLE 3
Langmuir isotherm parameters
Parameter 25°C 35°C 45°C
Qmax (mg/g) 3.44 3.45 3.46
b (Lg-1) 44.09 64.47 125.57
R2 1 1 1
RL 0.000081 0.000054 0.000028
ΔG°(J/mol) -9380.72 -10668.31 -12777.27
Figure 5 and figure 6 thereafter show the plots for the Langmuir and Freundlich isotherms
Fig. 5 Langmuir isotherm plot for Fe
Fig. 6 Freundlich isotherm plot for Fe
[image:4.612.324.558.288.425.2] [image:4.612.60.282.340.532.2]was reversible, though at the brink of irreversibility as for (RL=1) adsorption is linear and if (RL=0) adsorption is irreversible [3].
Results from a previous study [3], showed that a mass loading of 5% could remove 85% of all metal ions and as the concentration was increased, the % removal decreased. This trend was also observed in this study, however, an 8% mass loading gave % removal above 99% and a decrease in % removal was also observed. RL values of 0.0000036-0.0000014 were obtained in the previous study, while RLvalues of 0.000028-0.000081 were obtained in this study.
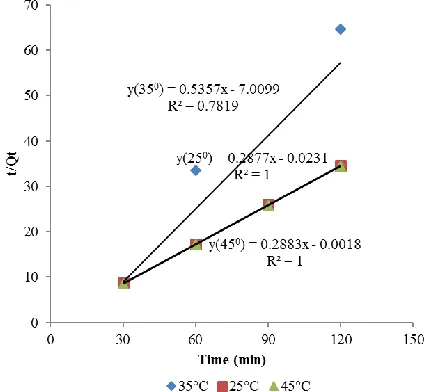
H. Adsorption kinetics
Table 4 lists the pseudo first order parameters as calculated from experimental data.
TABLE 4
Pseudo first order parameters
T qe exp Δqe qe cal k1
35⁰ C 3.48 0.014 2678.5515 0.025
45⁰ C 3.48 0.015 69.2309 0.027
Figure 7 and 8 shows the pseudo first and second order plots.
-4 -3 -2 -1 0
0 50 100 150
y(450) = -0.0118x - 1.8403 R² = 0.9852
y(350) = 0.0108x - 3.4279 R² = 1
Time (min)
Lo
g q
e
-q
t
45°C 35°C
Fig. 7 Pseudo first order for Fe
[image:5.612.322.534.54.250.2]Fig.8 Pseudo second order for Fe
TABLE 5
Pseudo second order parameters
T qe exp Δqe qe cal k2
25° C 3.47 0.0065 3.4758 523.008
35° C 3.48 0.0073 1.8667 0.497
45° C 3.48 -0.0045 3.4686 6684.027
[image:5.612.41.264.305.369.2]I. Thermodynamics
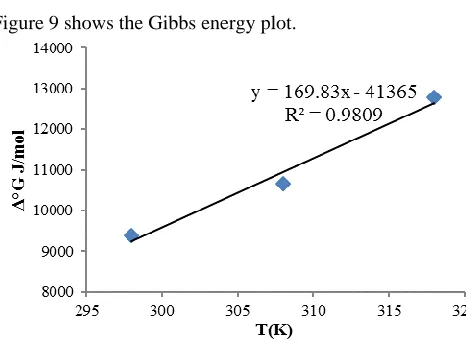
[image:6.612.51.284.68.244.2]Figure 9 shows the Gibbs energy plot.
Fig. 9 Gibbs energy plot for Fe
The Gibbs free energy plot (Figure 9) showed a decrease in the negative value of Δ°G with an increase in temperature, indicating that the adsorption process of Fe ions onto modified bentonite was favourable at higher temperatures. The negative Δ°G values indicate that the process was thermodynamically favourable. A Δ°G value of up to -20 KJ/mol is consistent with electrostatic interaction between adsorption sites and metal ions indicating that the adsorption process was physisorption [12].
IV. CONCLUSIONS
Modified bentonite of particle size range 300 µm-355 µm at a mass of 32 g can be used for Fe ions removal from acid mine drainage using a batch glass stirred reactor maintained at a temperature of 45°C, as thermodynamics proved that the adsorption process was favourable at higher temperatures. The experimental data fitted perfectly to the Langmuir isotherm and followed pseudo second order at temperatures of 25°C and 45°C and followed pseudo first order at a temperature of 35°C. Thermodynamically the process was favourable and physisorption was the mechanism of removal.
Kinetics showed that Fe followed Langmuir isotherms in both studies and followed pseudo second order mostly except for a temperature of 35°C. It can therefore be concluded that the study was successful as % removal was higher than results obtained previously.
ACKNOWLEDGEMENTS
The authors acknowledge financial support from the University of Johannesburg. The author also would like to express utmost thanks to Mr. A.G. Buthelezi for helping to conduct the experiment.
REFERENCES
[1] M. Ghaedi, M. and N. Mosallannejad, , “Removal of heavy metal ions from polluted wastes by using low cost adsorbents: Review’" , Journal of Chemical Health Risks vol. 3, no.1 pp. 07-22, 2013.
[2] R. Nazeem, R. and S.S .Tahir, “Removal of Pb (II) from aqueous/acidic solutions by using bentonite as an adsorbent," Journal of Environ Monitoring Assess., vol. 35, pp. 3982–3986, 2001.
[3] T. Falayi, “adsorption of heavy metals and neutralisation of acid mine drainage using clay minerals " Mtech (Chemical Engineering, University of Johannesburg. https://ujdigispace.uj.ac.za, (2015.09.14), 2012.
[4] A Jamal, B.B , Dhar, and S. Ratan , “Acid mine drainage control in open cast coal mine,” Mine Water and the Environment, vol. 10, pp. 1-16 , 1991.
[5] S. Babel, and T.A. Kurniawan, “Low-cost adsorbents for heavy metal uptake from contaminated water,” Journal of Hazard Mater , vol. 9, pp. 219-243 , 2003.
[6] K.G. Akompie, and F.A.,, Dawudo, “Potential of a low-cost bentonite for heavy metal abstraction from binary component system,’” Beni-Suef University Journal of Basic and Applied Sciences, vol. 4,no.1, pp. 25-28 , 2015.
[7] F. Ntuli, T. Falayi, and P. Molala, “Adsorption of Cu and Ni from AMD using Activated Bentonite,” International Journal of Research in Chemical, Metallurgical and Civil Engineering(IJRCMCE), vol. 1,no.1, pp. 79-83 , 2014. [8] W.D. Keller, R.C. Reymolds, and A. Inoue “Morphology of
clay minerals in the smectite-to-illite cnversion series by scanning electron microscopy,” Clays and Clay Minerals, vol. 34, no.2 pp. 187-197, 1986.
[9] N. Azouaou, M. Belmedanib, H. Mokaddema, and Z. Sadaoui, , “Adsorption of lead from aqueous solution onto untreated orange barks,” Chemical Engineering Transactions , vol. 32, pp. 55-60 , 2013.
[10] B.B. Johnson, “Effect of pH, temperature and concentration on the adsorption of cadmuim on gethite,” Envirn.Sci.Technol, vol, 24, no.1, pp. 112-118., 1990.
[11] H. Ucum , Y. K. Bayhan, Y. Kaya, A, Cakici, and 0. F. Algur, “Biosorption of lead (II) from aqueous solution by cone biomass of Pinus sylvestris.,” Desalination , vol. 154, pp. 233-238, 2003.