During the grain filling period, water (W) and nitrogen (N) interactions determine the extents to which grain number (GN) and grain weight (GW) contribute to grain yield (GY) (Saint Pierre et al. 2008). There is some evidence to support the idea that N supply at anthesis could increase GY of drought-stressed wheat more by alleviating sink limitations than by increasing source strength (Madani et al. 2010). First, grain growth in non-irrigated wheat varied from sink limitation to some degree of co-limitation (Acreche and Slafer 2009). These cultivars may have required an ample supply of N fertilizer to attain maximum grain set (GS) and GY, (Kichey et al. 2007). Second, it was clearly illustrated that drought-resistant genotypes with greater GS are better able to real-locate stem dry matter to the grains (Ehdaie et al. 2006). Thus, if the SR remobilized to grains was < 1.5 t/ha, then drought-stressed wheat did not respond to N, and if this amount was < 2.5 t/ha, then the GY increase resulting from increased N supply exceeded 25% (Madani et al. 2010).
These evidences suggest that N supply at anthesis could increase sink capacity under all irrigation regimes (Madani et al. 2010). The increased GS resulting from increased N supply would increase the GY if pre- and/or post-floral assimilate levels increased to meet the demand from grains and inhibited the reduction in assimilate per grain and consequently in GW.
In previous work, Spike-halving caused reduc-tions in GY in all W × N treatments, suggesting that the studied cultivar was sink-limited under different W × N conditions. In present work, we studied the effects of various N treatments on the Chamran cultivar under irrigation and drought conditions with attention to biomass gain by as-similation and its loss by respiration. We hypoth-esised that under drought conditions (GN < 35), high N supply at anthesis may satisfy the increased grains’ demands that resulted from N supply. This could be achieved by increasing post-floral as-similation, and the surplus assimilates could not only compensate for the low-N-induced biomass
The impact of post-anthesis nitrogen and water availability
on yield formation of winter wheat
A. Madani
1, A.H. Makarem
2, F. Vazin
1, M. Joudi
31
Gonabad Branch, Islamic Azad University, Gonabad, Iran
2
Varamin-Pishva, Islamic Azad University, Varamin, Iran
3
Agriculture Faculty, University of Mohaghegh Ardabili, Moghan, Iran
ABSTRACT
The effects of irrigation regimes (full irrigation and water-withholding at anthesis) and post-anthesis nitrogen sup-plies (LN: 0, MN: 20 and HN: 40 kg N/ha) on grain yield and its components in winter wheat were studied, with attention to biomass gain by assimilation and its loss by respiration. Fully-irrigated wheat responded to N fertiliza-tion with increased grain number (GN) and decreased grain weight (GW) and achieved similar grain yields (5.2 to 5.5 t/ha) at different N supplies. However, drought-stressed wheat responded to N with higher GN without sig-nificant changes in GW, and achieved higher grain yields (2.7 vs. 3.3 t/ha) with HN compared to LN. Net assimila-tion rates during grain filling (NARg) increased with increasing post-anthesis N fertilizaassimila-tion for drought-stressed
wheat (NARg: 3.8 and 4.5 g/m/day for LN and HN). Apparent whole-plant respiration (RA) was not influenced by
increased post-anthesis N fertilizer. Thus, in drought-stressed wheat, the total biomass and straw yield at maturity were increased by increasing N supply. These results suggest that high N supply at anthesis satisfied the grains’ in-creased demand for N by increasing post-floral assimilation, and the surplus assimilates not only compensated for the low-N-induced biomass loss by respiration but may also have increased the straw yield.
loss by respiration but could also increase straw yield at maturity.
MATERIAL AND METHODS
This study was conducted under post-anthesis water and nitrogen deficiencies with the bread winter wheat cv. Chamran during the 2007–2008 and 2008–2009 growing seasons. The research site was located in Ahwaz-Iran (latitude: 31°16'N, lon-gitude: 49°36'E, altitude: 151 m a.s.l.). This region has a hot and humid climate, with 35-year mean annual maximum and minimum daily air tempera-tures of 32.7°C in August and 19.5°C in February, respectively. The precipitation during the first and second wheat growing seasons (November to May) was 329 and 352 mm, respectively (Madani et al. 2010). There was not precipitation during grain filling period (25 April to 30 May) in the experimental seasons. The soil was a montmoril-lonite clay loam, 0.5 m deep, low in total nitrogen (2007: 3–4 g/kg; 2008: 4–5 g/kg) and very low in organic matter (9–10 g/kg), with a pH of 7.8 and Ec of 0.44 dS/m. The field experiments were laid out in a randomized complete block design with split-plot arrangement, with three replicates. Water regimes (full irrigation and water-withholding at anthesis) were allotted to main plots, and post-anthesis nitrogen supplies (0, 20 and 40 kg N/ha) were allotted to subplots. Prior to anthesis, all the experimental units were irrigated uniformly when the soil water content reached 75% of the avail-able soil water content (SWC), corresponding to the difference between the SWC at field capacity (θFC) and wilting point (θWP). After anthesis, well-watered plots were irrigated in this schedul-ing. In drought-stressed plots water-withholding was applied 7 days before anthesis and continued to 7 days after anthesis till the SWC reached to 25% (FC-WP). After water-withholding period, the routine irrigation was continued in drought-stressed plots. Day-to-day measurement of the soil water content was done using granular matrix sensors according to the method described by Madani et al. (2010). The amount of water needed in each irrigation event to bring soil water content to field capacity (θFC) was determined using the formula:
ETPcrop = ETPpan × Kc
Where: ETPcrop, ETPpan and Kc are crop evapo-transpi-ration, Pan evaporation and crop coefficient, respectively. Diammonium phosphate ((NH4)2HPO4) and urea (CO(NH2)2) were top-dressed at maximum
rates of 200 kg and 100 kg/ha, which corresponded to 36 and 46 kg N/ha, respectively. Therefore, the maximum N supply was 82 kg N/ha. In all nitrogen treatments, one quarter of the total N was applied while sowing and one quarter while tillering. At anthesis, the N supplies were 0, 20 and 40 kg N/ha, resulting in N supplies of 41, 61.5 and 82 kg N/ha for N1, N2 and N3, respectively. The N3 treatment was applied a day before water-withholding to ensure the fertilizer get to rooted soil in water stress treatment. Each experimental plot measured 2 m × 5 m. Within each plot, wheat was sown at a rate of 450 seeds per square metre in four rows, 0.5 m apart, on 25 November 2007 and 5 December 2008. Sowing was done on both sides of hills, following the cropping techniques customarily adopted in the region. Uniformity of sowing depth was achieved by using a hand dib-bler to make holes 3–5 cm deep. At physiological maturity (Zadoks stage 90), grain yield and total biomass were measured by harvesting a sample area of 2 m2 at the centre of each plot. Dry weights
were recorded after the plant material was oven-dried at 70°C for 48 h. Harvest index (HI) was calculated as the ratio of grain yield to above-ground biomass. Straw yield was calculated as the difference of total biomass and grain yield. A random sample of 20 plants was chosen from two middle rows for recording the grain weight. The number of grains per square metre was calculated as the ratio of grain yield (mg/m2) to grain weight
(mg). 7 days before anthesis and before applying the N × W treatments and at physiological matu-rity, the leaf area index (LAI) and total biomass were measured (2008: 4.6 and 452 g/m2; 2009:
4.3 and 419 g/m2) to determine the net
based on the gas exchange system described by Bloom et al. (1989) and according to the formula:
Ci = Ca + P (RA/gc)
Where: P – gas exchange cuvette air pressure (Pa); RA – the measured leaf CO2 flux area density (i.e., apparent respiration rate on a leaf area basis, mol CO2 efflux/m2/S)
and gc – leaf CO2 conductance (mol CO2/m2/s) estimated
from leaf H2O conductance.
Statistical analyses were performed using the GLM procedure of SAS/STAT, using the correct error terms to evaluate water and nitrogen main effects and their interactions. Duncan’s multiple range test (P < 0.05) was applied for mean separa-tions when F values were significant.
RESULTS AND DISCUSSION
During 2008–2009, full irrigation and water-withholding at anthesis exhibited different re-sponses of the main yield components (GN and GW) to increased N availability (Table 1), indi-cating that available assimilates were allocated to produce either many small seeds or few larger seeds depending on resource availability (Gambín and Borrás 2009). Well-watered wheat responded to N fertilization by increasing GN and decreas-ing GW (LN: 10 100 grains/m2 and 48.5 mg per
grain; MN: 14 600 grains/m2 and 43.2 mg per
grain; HN: 13 400 and 38.0 mg per grain), while drought-stressed wheat responded by increasing GN without significantly changing GW (LN: 7 200 grains and 33.2 mg per grain; MN: 7 300 grains and 37.0 mg per grain; HN: 9 000 grains and 34.4 mg per grain). A similar trend was observed in 2007– 2008 (Table 1). As a result, in 2008–2009 and av-erage of both years, well-watered wheat with MN supply achieved greater GY than the lower (LN) and higher (HN) nitrogen-supplied plants (4.9, 6.3 and 5.1 t/ha for LN, MN and HN, respectively). While for drought-stressed wheat, N fertilization of 40 kg N/ha (HN) increased the GY by 16.6% (2008) and 29.2% (2008–2009), showing that high N supply at anthesis satisfied the demand of the larger number of grains (by N) by increasing the post-floral assimilation (Rodrigues et al. 2007, Fuertes-Mendizabal et al. 2010).
Comparing the two irrigation regimes across the two experimental years, the well-watered wheat (WW) had a higher response than drought-stressed wheat (DW) to N fertilization in terms of GN (WW: 11 300 and 14 600 grains for LN and HN; DW: 8 600 and 9 700 grains for LN and HN). Thus, for
non-irrigated wheat, especially with optimum N supply after anthesis, breeders could direct their selection programs to increase GS (Bruckner and Frohberg 1991). In addition, comparing the three nitrogen supplies across the two experimental years, well-watered wheat showed a tendency to saturate its response to N fertilization in terms of GN (Table 1). In fact, the crop gave similar GN values in MN and HN treatments (WW: 15 000 and 14 600 grains for MN and HN; DW: 7 900 and 9 700 grains for MN and HN). Well-watered wheat achieved similar GY with LN and HN, due to lower GW (WW: 46.8 and 37.3 mg for LN and HN; DW: 31.7 and 33.8 mg for LN and HN). Albrizio et al. (2010) reported that there was a strict relation-ship between GN and GY for drought-stressed wheat with a high response to nitrogen (slope of 0.622 for HN vs. 0.465 for LN) related to constant GW under different nitrogen supplies. However, Pandey et al. (2001) showed a quadratic response in GY and GS with increasing N levels in all ir-rigation regimes.
Averaged across years, the observed reduction in seed weight (46.8 to 37.3 mg) of well-watered wheat with increased nitrogen supply (HN vs. LN) could be related to different responses of GN and NARg to nitrogen supply and, consequently, dif-ferent assimilate levels per established seed (NAR: 6.0 g/m2/day and GN: 11 300 grains for LN; NAR:
6.3 g/m2/day and GN: 14 600 grains for HN). This
behaviour was observed in both cropping years (Table 1). In 2007–2008 and averaged across years, increased nitrogen supply increased both the NARg and GN in drought-stressed wheat (NAR: 3.8 g/m2/
day and GN: 8 600 grains for LN; NAR: 4.5 g/m2/
day and GN: 9 700 grains for HN). However, this behaviour was not observed in 2008–2009 (Table 1). Indeed, the different responses of GW and GY to N supply under various irrigation regimes could be explained by the responses of photosynthesis and respiration, and the consequent assimilates available per grain with different N supplies and irrigation regimes.
Well-watered wheat produced more GN than drought-stressed wheat (13 600 vs. 8 800 grain/m2).
Table 1. Means for total biomass, grain yield, harvest index, grain weight, number of grains per spike, total grain weight per spike, straw yield at maturity, number of grains per square meter, net assimilation rate during grain
filling, whole-plant apparent respiration, flag leaf chlorophyll content and net CO2 exchange as affected by
post-anthesis water and nitrogen interaction in separated and combined analysis of 2007–2008 and 2008–2009 data
Total biomass (t/ha) Grain yield (t/ha)
2007–2008 2008–2009 combined 2007–2008 2008–2009 combined W1N1 14.3 a (a) 15.9 a (a) 15.1 a (a) 5.6 b (a) 4.9 b (b) 5.2 b (b) W1N2 14.8 a (a) 14.9 a (a) 14.8 a (a) 6.1 b (a) 6.3 a (a) 6.2 a (a) W1N3 12.1 b (ab) 13.4 b (ab) 12.7 b (ab) 5.8 b (a) 5.1 b (b) 5.5 b (b) W2N1 8.5 b (c) 9.6 b (c) 9.1 b (c) 3.0 b (bc) 2.4 b (d) 2.7 b (d) W2N2 8.5 b (c) 9.1 b (c) 8.8 b (c) 2.7 b (c) 2.7 b (cd) 2.7 b (d) W2N3 10.4 a (bc) 11.4 a (bc) 10.9 a (bc) 3.5 a (b) 3.1 a (c) 3.3 a (c)
Harvest index (%) Grain weight (mg)
W1N1 39.2 b (ab) 30.8 b (ab) 35.0 b (ab) 45.1 a (a) 48.5 a (a) 46.8 a (a) W1N2 41.2 b (ab) 37.3 a (ab) 39.2 ab (ab) 39.6 b (ab) 43.2 b (ab) 41.4 ab (ab) W1N3 47.9 a (a) 38.1 a (a) 43.0 a (a) 36.6 b (ab) 38.0 c (b) 37.3 b (b) W2N1 35.3 a (ab) 25.0 a (b) 30.1 a (b) 30.2 a (b) 33.2 a (b) 31.7 a (b) W2N2 31.8 a (b) 29.7 a (ab) 30.7 a (b) 31.4 a (b) 37.0 a (b) 34.2 a (b) W2N3 33.7 a (b) 27.2 a (ab) 30.4 a (b) 33.2 a (b) 34.4 a (b) 33.8 a (b)
Number of grains per spike Total grain weight per spike (g) W1N1 36.6 b (b) 32.4 b (ab) 34.5 b (b) 1.7 a (a) 1.6 b (b) 1.6 b (b) W1N2 45.1a (a) 50.9 a (ab) 48.0 a (a) 1.8 a (a) 2.2 a (a) 1.9 a (a) W1N3 48.2 a (a) 41.4 a (a) 44.8 a (a) 1.8 a (a) 1.6 b (b) 1.6 b (b) W2N1 28.2 b (c) 23.8 b (b) 26.0 b (c) 0.9 b (c) 0.8 b (d) 0.8 b (d) W2N2 26.3 b (c) 22.9 b (b) 24.6 b (c) 0.8 b (c) 0.8 b (d) 0.8 b (d) W2N3 32.6 a (bc) 28.0 a (b) 30.3 a (bc) 1.1 a (c) 1.0 a (c) 1.0 a (c) Straw yield at maturity (t/ha) Number of grains per square meter × 103
W1N1 8.7 a (a) 11.0 a (a) 9.9 a (a) 12.4 b (b) 10.1 b (b) 11.3 b (b) W1N2 8.7 a (ab) 10.6 a (ab) 9.6 a (ab) 15.4 a (a) 14.6 a (a) 15.0 a (a) W1N3 6.3 b (bc) 8.3 b (bc) 7.3 b (bc) 15.8 a (a) 13.4 a (a) 14.6 a (a) W2N1 5.5 b (c) 7.2 ab (c) 6.4 b (c) 9.9 a (c) 7.2 b (c) 8.6 b (cd) W2N2 5.8 b (c) 6.4 b (c) 6.0 b (c) 8.6 b (d) 7.3 b (c) 7.9 b (d) W2N3 6.9 a (bc) 8.3 a (bc) 7.6 a (abc) 10.5 a (c) 9.0 a (b) 9.7 a (c)
Net assimilation rate during grain filling (g/m2/day) Whole-plant apparent respiration (nmol CO
2/g DW/S)
W1N1 5.8 b (b) 6.2 a (a) 6.0 a (a) 28.1 b (bc) 28.3 b (c) 28.3 c (c) W1N2 6.4 a (a) 6.6 a (a) 6.4 a (a) 35.2 b (b) 38.1 b (bc) 38.0 b (b) W1N3 6.2 ab (ab) 6.4 a (a) 6.3 a (a) 56.1 a (a) 49.0 a (a) 49.2 a (a) W2N1 4.1 b (c) 4.0 a (b) 4.1 b (c) 27.9 a (bc) 35.2 b (bc) 31.7 a (bc) W2N2 3.9 b (c) 3.9 a (b) 3.9 b (c) 21.2 a (c) 31.4 b (c) 28.1 a (c) W2N3 4.4 a (c) 4.3 a (b) 4.3 a (b) 28.2 a (bc) 42.2 a (ab) 35.1 a (bc)
Chlorophyll content (mg/g DW) Net CO2 exchange (mg CO2/dm2/h)
W1N1 7.8 a (a) 7.8 a (a) 7.8 a (c) 29 b (b) 37.2 a (a) 33.1 a (a) W1N2 8.1 a (a) 8.2 a (a) 8.1 a (c) 38.4 a (a) 33 a (a) 35.7 a (a) W1N3 8.0 a (a) 8.1 a (a) 8.1 a (c) 31 b (ab) 38.4 a (a) 34.7 a (a) W2N1 4.6 b (c) 4.0 b (c) 4.3 b (a) 24.6 ab (bc) 20.5 b (b) 22.5 b (b) W2N2 5.2 b (b) 4.8 b (c) 5.0 b (a) 19.5 b (c) 23.4 b (b) 21.4 b (b) W2N3 5.6 a (b) 6.2 a (b) 5.9 a (b) 26.4 a (bc) 35.2 a (a) 30.8 a (b)
W1 – post-anthesis full irrigation; W2 – water with-holding at anthesis; N1 – 0 kg/ha N; N2 – 20 kg/ha N; N3 –
40 kg/ha N at anthesis. Means within each column of each category followed by different letters are significantly
and HN; 2009: 28.3, 38.1 and 49.0 nmol CO2/g DW/S for LN, MN and HN). Indeed, N-induced carbon loss in terms of RA after anthesis exceeded assimilation during grain filling in terms of bio-mass; this could not be compensated for by cur-rent assimilation or by SR reallocation to grains when post-anthesis N was applied over a certain rate (Sun et al. 2007). As a result, the shortage of assimilates caused a reduction in available as-similates per grain, and consequently in the GW with increasing N supply (Table 1). Therefore, the strong trade-off between GN and GW resulted in similar yields among different nitrogen supplies (Table 1). In addition, due to large RA values, the TB (Total biomass) and SR values were decreased by increasing N supplies (Table 1).
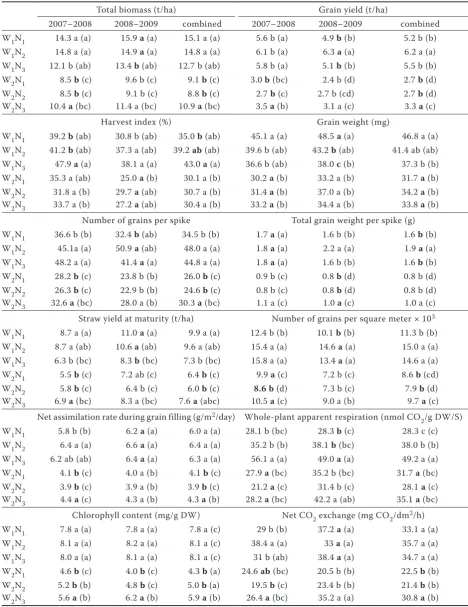
Averaged across years, NARg, NCO2 and Chl in-creased with increasing post-anthesis N fertilizer for drought-stressed wheat (NARg: 3.8 and 4.5 g/m2/
day for LN and HN; NCO2: 22.5 and 30.8 mg CO2 /dm2/h for LN and HN; Chl: 4.3 to 5.9 mg/g DW).
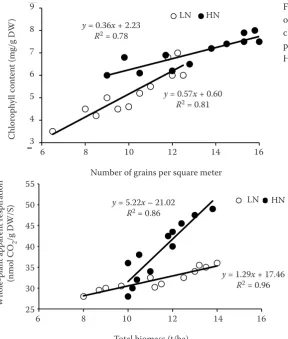
This trend was observed in both years. The only exception was seen in 2008–2009, when NARg was not influenced by nitrogen supply. Averaged across years and in 2007–2008, RA was not influenced by increasing post-anthesis N fertilizer (Table 1). There was a strict relationship between TB and RA with a
high response to nitrogen (Figure 2), showing that N-induced respiration was low, due to the small amount of biomass present (Sun et al. 2007). As a re-sult, available assimilates per grain, and consequently, GW remained constant (Table 1). Therefore, greater GN resulted in greater yields with higher nitrogen supplies (Table 1). In addition, in drought-stressed wheat, the surplus assimilates increased the TB and SR (Table 1). The results conclude that the response of GN to N is similar at different irrigation regimes. While, the response of NAR and consequently GW (assimilates per grain) to N is dependent on water availability.
REFERENCES
Acreche M.M., Slafer G.A. (2009): Grain weight, radiation in-terception and use efficiency as affected by sink-strength in Mediterranean wheats released from 1940 to 2005. Field Crops Research, 110: 98–105.
Albrizio R., Todorovic M., Matic T., Stellacci A.M. (2010): Com-paring the interactive effects of water and nitrogen on durum wheat and barley grown in a Mediterranean environment. Field Crops Research, 115: 179–190.
[image:5.595.68.357.54.394.2]Amthor J.S., Koch G.W., Bloom A.J. (1991): CO2 inhibits respira-tion in leaves of Rumex crispus L. Plant Physiology, 98: 757–760. Figure 1. The relationship between number of grains per square meter (× 1000) and chlorophyll content in grain as a function of post-anthesis nitrogen supply. LN – 0 kg/ha; HN – 40 kg/ha
Figure 2. The relationship of total biomass and whole-plant apparent respiration as a function of post-anthesis nitrogen supply. LN – 0 kg/ha; HN – 40 kg/ha
C
hlor
oph
yll c
on
ten
t (mg/g DW
)
Number of grains per square meter
Total biomass (t/ha)
Whole-pl
an
t a
pp
ar
en
t r
espira
tion
(nmol C
O2
/g DW/S)
y = 0.36x + 2.23
R2 = 0.78
y = 0.57x + 0.60
R2 = 0.81
LN HN
LN HN
9
8
7
6
5
4
3
6 8 10 12 14 16
y = 5.22x – 21.02
R2 = 0.86
y = 1.29x + 17.46
R2 = 0.96
55
50
45
40
35
30
25
Corresponding author:
Assistant Professor of Agronomy, Ahad Madani, Islamic Azad University, Gonabad Branch, Gonabad, Iran e-mail: [email protected]
Bloom A.J., Cardwell R.M., Finazzo J., Warner R.L., Weissbrat J. (1989): Oxygen and carbon dioxide fluxes from barley shoots depend on nitrate assimilation. Plant Physiology, 91: 352–356. Bruckner P.L., Frohberg R.C. (1991): Source-sink manipulation as
a postanthesis stress tolerance screening technique in wheat. Crop Science, 31: 326–328.
Ehdaie B., Alloush G.A., Madore M.A., Waines J.G. (2006): Geno-typic variation for stem reserves and mobilization in wheat: II. Postanthesis changes in internode water-soluble carbohydrates. Crop Science, 46: 2093–2103.
Fuertes-Mendizábal T., Setién I., Estavillo J.M., González-Moro M.B. (2010): Late nitrogen fertilization affects carbohydrate mobilization in wheat. Journal of Plant Nutrition Soil Science,
173: 907–919.
Gambín B.L., Borrás L. (2009): Resource distribution and the trade-off between seed number and seed weight: a comparison across crop species. Annals of Applied Biology, 156: 91–102. Kichey T., Hirel B., Heumez E., Dubois F., Le Gouis J. (2007): In
winter wheat (Triticum aestivum L.), post-anthesis nitrogen uptake and remobilisation to the grain correlates with agro-nomic traits and nitrogen physiological markers. Field Crops Research, 102: 22–32.
Liu D., Wang X., Chen Z., Xu H., Wang Y. (2010): Influence of mercury on chlorophyll content in winter wheat and mercury bioaccumulation. Plant, Soil and Environment, 56: 139–143. Madani A., Shirani-Rad A., Pazoki A., Nourmohammadi G.,
Zarghami R., Mokhtassi-Bidgoli A. (2010): The impact of source or sink limitations on yield formation of winter wheat
(Triticum aestivum L.) due to post-anthesis water and nitrogen deficiencies. Plant, Soil and Environment, 56: 218–227. Mi G., Tang L., Zhang F., Zhang J. (2010): Is nitrogen uptake
after anthesis in wheat regulated by sink size? Field Crops Research, 68: 183–190.
Osaki M., Iyoda M., Tadano T. (1995): Effect of nitrogen applica-tion and sink manipulaapplica-tion on the contents of ribulose-1,5-bisphosphate carboxylase/oxygenase, phosphoenolpyruvate carboxylase, and chlorophyll in leaves of maize during the maturation stage. Soil Science and Plant Nutrition, 41: 295–303. Pandey R.K., Maranville J.W., Admou A. (2001): Tropical wheat
response to irrigation and nitrogen in a Sahelian environment. I. Grain yield, yield components and water use efficiency. Eu-ropean Journal of Agronomy, 15: 93–105.
Rodrigues O., Lhamby J.C.B., Didonet A.D., Marchese J.A. (2007): Fifty years of wheat breeding in southern Brazil: Yield im-provement and associated changes. Pesquisa Agropecuária Brasileira, 42: 817–825.
Saint Pierre C., Peterson C.J., Ross A.S., Ohm J.B., Verhoeven M.C., Larson M., Hoefer B. (2008): Winter wheat genotypes under different levels of nitrogen and water stress: Changes in grain protein composition. Journal of Cereal Science, 47: 407–416.
Sun W.J., Huang Y., Chen S.T., Zou J.W., Zheng X.H. (2007): Dependence of wheat and rice respiration on tissue nitrogen and the corresponding net carbon fixation efficiency under dif-ferent rates of nitrogen application. Advances in Atmospheric Sciences, 24: 55–64.