Femtosecond ultraviolet laser ablation of silver and comparison with
nanosecond ablation
B. Toftmann, B. Doggett, C. Budtz-Jørgensen, J. Schou, and J. G. Lunney
Citation: J. Appl. Phys. 113, 083304 (2013); doi: 10.1063/1.4792033
View online: http://dx.doi.org/10.1063/1.4792033
View Table of Contents: http://jap.aip.org/resource/1/JAPIAU/v113/i8
Published by the American Institute of Physics.
Related Articles
Near-infrared femtosecond laser machining initiated by ultraviolet multiphoton ionization Appl. Phys. Lett. 102, 101111 (2013)
Silver nano-entities through ultrafast double ablation in aqueous media for surface enhanced Raman scattering and photonics applications
J. Appl. Phys. 113, 073106 (2013)
Ultrafast heating and magnetic switching with weak external magnetic field J. Appl. Phys. 113, 043919 (2013)
Two-color femtosecond strobe lighting of coherent acoustic phonons emitted by quantum dots Appl. Phys. Lett. 102, 043107 (2013)
Lifetime of sub-THz coherent acoustic phonons in a GaAs-AlAs superlattice Appl. Phys. Lett. 102, 041901 (2013)
Additional information on J. Appl. Phys.
Journal Homepage: http://jap.aip.org/
Journal Information: http://jap.aip.org/about/about_the_journal
Top downloads: http://jap.aip.org/features/most_downloaded
Femtosecond ultraviolet laser ablation of silver and comparison with
nanosecond ablation
B. Toftmann,1B. Doggett,2C. Budtz-Jïrgensen,2J. Schou,1,a)and J. G. Lunney2 1
DTU Fotonik, RisïCampus, DK-4000 Roskilde, Denmark
2
School of Physics, Trinity College Dublin, Dublin 2, Ireland
(Received 21 November 2012; accepted 29 January 2013; published online 26 February 2013) The ablation plume dynamics arising from ablation of silver with a 500 fs, 248 nm laser at2 J cm2 has been studied using angle-resolved Langmuir ion probe and thin film deposition techniques. For the same laser fluence, the time-of-flight ion signals from femtosecond and nanosecond laser ablation are similar; both show a singly peaked time-of-flight distribution. The angular distribution of ion emission and the deposition are well described by the adiabatic and isentropic model of plume expansion, though distributions for femtosecond ablation are significantly narrower. In this laser fluence regime, the energy efficiency of mass ablation is higher for femtosecond pulses than for nanosecond pulses, but the ion production efficiency is lower.VC 2013 American Institute of Physics.
[http://dx.doi.org/10.1063/1.4792033]
I. INTRODUCTION
The dynamics of ablation plume expansion in femtosec-ond (fs) laser ablation of solid materials is of interest in micromachining, thin film deposition and microanalysis.1–9 It is now well established that fs laser ablation of solids is significantly different from nanosecond (ns) ablation. Infs
ablation the time available for heat conduction is of the order of the electron-lattice relaxation time, typically 1–10 ps. The hydrodynamic motion of the ablated material commences on the same time scale, thus for sub-ps laser pulses there is no interaction of the laser with ablated material. The plume is typically characterized by the kinetic energy and angular dis-tribution of the ablated particles,2,6–13 which in turn are determined by the dimensions of the ablation spot and the thickness of the layer of ablated material when the adiabatic expansion of the ablation plume commences.
Most of the comparisons between nsandfsexperiments or film depositions have been carried out for the light elements,2,3,7,12,14in particular carbon, which may not be rep-resentative for a broader set of elements. Another significant feature is that most of the experiments on medium, or heavy elements, have been carried with laser wavelengths in the near infrared around 800 nm,2,6,7 or in the visible at 527 nm, or 620 nm,3,8–10,13 whereas ns ablation is typically studied for UV lasers at 355 nm or 248 nm. However, one should note that the strong-field excitation induced by fs-lasers makes it possible to ablate materials using longer wavelengths where the materials are transparent to the laser light.15
Plume studies offslaser ablation are often based on time-and space-resolved spectroscopy from which it can be difficult to extract the velocity and angular distributions of the ablated particles. Spectroscopic measurements of emission from excited atomic and ionic species may not give a representative picture of all the ablated material. In particular, it is known that infsirradiation a significant part of the ablation occurs
via emission of nanoparticles (NPs), which leave the target at lower velocity than atoms or ions and emit a continuous light spectrum.15–17There are some reports of ion energy distribu-tion measurements using Langmuir probes7or ion energy ana-lyzers,2,4,7,11 but these measurements have been made in a direction close to the normal of the target surface, and do not give information about the shape of the ablation plume. Don-nelly et al.8,9 have used ion probes to measure the plume shape and the ion energy distribution infsablation of nickel.
In this paper, we describe the results of an experiment to measure the energy and angular distributions of the plasma produced by ablation of a silver (Ag) target with afsUV laser. The angular distribution of the net deposition was also meas-ured. The results were compared with similar measurements fornspulses. We show that the adiabatic and isentropic plume expansion model18,19provides a good description of the plume expansion in fs ablation. This model was developed for the expansion of the neutral vapour produced by pulsed laser abla-tion, but has been found to provide a good description of the expansion of ionizednslaser ablation plumes.20–22The param-eters of the model are realistic, and the flip-over effect, whereby for an elliptical ablation spot the major axis of the expanding plume becomes orthogonal to the major axis of the ablation spot, was observed. The main result of the present work is that both plasma plume shape and the angular distribu-tion of deposidistribu-tion are significantly narrower for fs ablation than for the corresponding case of ns ablation. However the plasma and deposition plumes are of finite angular width, and clearly do not correspond to unidirectional flow along the tar-get normal, as is described in Ref. 23. In the present experi-ment the laser beam strikes the target at normal incidence, though the laser spot is rectangular. However the conclusions drawn here are generally applicable, in particular to pulsed laser deposition (PLD) where non-normal incidence is used.
II. EXPERIMENT
The fs ablation measurements were performed at the UV laser facility at IESL-FORTH, Crete, using a 500 fs,
a)Author to whom correspondence should be addressed. Electronic mail:
josc@fotonik.dtu.dk.
248 nm laser. Laser pulses at 496 nm were generated in a dis-tributed feedback dye laser before frequency doubling and amplification in a KrF excimer laser amplifier.24 The laser beam was delivered, using a demagnifying optical system, as a rectangular spot 0.62 mm0.26 mm (0.0016 cm2area) at normal incidence onto a Ag target in a vacuum chamber with a base pressure of 107mbar. The laser beam could be adjusted to orient the long axis of the spot either horizontal or vertical, and the target could be rotated to a new ablation spot after each sequence of shots. To identify the ablation re-gime of this experiment the ablation depth per pulse was measured as function of laser fluence by keeping the target fixed and delivering between 500 and 1000 laser pulses. The ablation crater profile was measured across the long and short dimensions using a Dektak surface profilometer. An array of 13 planar Langmuir probes was arranged in the hori-zontal plane in a semi-circular arc around the laser ablation spot at a distance of 80 mm, as shown in Fig.1. The planar probes were biased negatively at 10 V to reject plasma electrons and to measure the time-of-flight (TOF) ion current signal due to the plasma flow. The planar probes were simi-lar to those in Ref.25and had an area of 0.04 cm2. The col-lecting surface was oriented to face the ablation spot, and thus the plasma flow. While recording the signal from a par-ticular probe, all other probes were grounded. An identical system with cylindrical probes has been used for ion probe measurements with ns pulses.21 A simple homemade low-resolution cylindrical ion energy analyzer with a Faraday plate detector was used to identify the main ionic species in the ablation plasma. The deposition was measured by placing a semi-circular stripe of transparent plastic around the abla-tion spot at the same radius as the probes. After an appropri-ate number of laser pulses the thickness of the Ag film was determined by measuring the optical transmission with a He-Ne laser26 and using the known optical properties of Ag metal.27
III. RESULTS AND DISCUSSION
Figure 2shows the fluence variation of the measured fs ablation depth per pulse in the fluence range 0.3 to 2 J cm2.
At low fluence there is a logarithmic dependence consistent with the analysis of Nolte et al.5In this regime the ablation is determined by the penetration of light into the solid,
a120 nm. For larger fluence the depth increases linearly with fluence, which reflects the increasing importance of heat conduction.28,29 The ablation depth at 2 J cm2 is 160 nm. Vestentoft and Balling measured a value of 100 nm at 2 J cm2for ablation with 100 fs 800 nm pulses;28the higher value measured here is most likely due to the lower target reflectivity for UV irradiation. In both cases the laser pulses are much shorter than the electron-lattice relaxation time, which is9.4 ps for Ag in the ablation conditions considered here.30It should be noted that after the delivery of 500-1000 pulses at the same position the floor of the ablation crater is highly structured, showing 50% modulation of the ablation depth on a typical lateral scale length of 50lm.
In making the ion probe measurements it was noted that the first shot on a particular target location gave rise to a sig-nal of higher amplitude and shorter TOF than for subsequent shots delivered in quick succession. Figure 3(a) shows the ion signals obtained for the first, second, and third shots delivered at a repetition rate of 1 Hz. Subsequent shots are similar to the third shot. It was also noted that if the irradia-tion is stopped for a few seconds the fast ion peak reappears when the irradiation is restarted. These observations indicate the buildup of low-Z contamination of the Ag surface. This was confirmed using the cylindrical ion energy analyser. Fig.3(b)shows TOF signals of the ions transmitted through the analyser when the pass energy was set at 47 eV for singly-charged ions. The approximate ion mass was deter-mined from the TOF. When the target is rotating we observe ion signals due to singly-ionised H, C, and/or O and Ag, as there is sufficient time between laser shots on the same loca-tion on the target for the buildup of surface contaminaloca-tion. A similar low-Z impurity peak was observed in fs ablation of Ni.8However, with the target stationary only the Ag ion sig-nal is observed. The ion probe sigsig-nals reported below were obtained after laser ablative cleaning of the target.
Figure4(a)shows the fluence variation of the ion signals measured near the target normal. The fluence was varied by changing the laser pulse energy while keeping the beam spot size constant. To minimise the problem of surface contami-nation, each TOF-spectrum is an average of the last 5 laser shots in a series of 10 shots fired at a repetition rate of 2 Hz.
FIG. 1. Geometry of the setup used for the ion probe measurements in UV fs laser ablation experiment at IESL-FORTH, Crete. Only planar probes (indicated with dots) were used.
FIG. 2. The ablation depth as a function of laser fluence with vertical beam spot.
[image:3.612.56.293.563.730.2] [image:3.612.340.536.604.741.2]As the fluence is increased the amplitude of the signal increases, and the TOF corresponding to maximum ion flux decreases, but the characteristic shape of the signal remains the same. Figure 4(b) shows that the integrated ion charge collected by the probe increases linearly with fluence. This figure also shows that ion energy corresponding to the TOF at maximum ion flux increases monotonically from40 eV at the ablation threshold to a150 eV at 2 J cm2. A similar increase of the ion energy, in nearly the same fluence range, was seen fornsablation of Ag at 355 nm.31
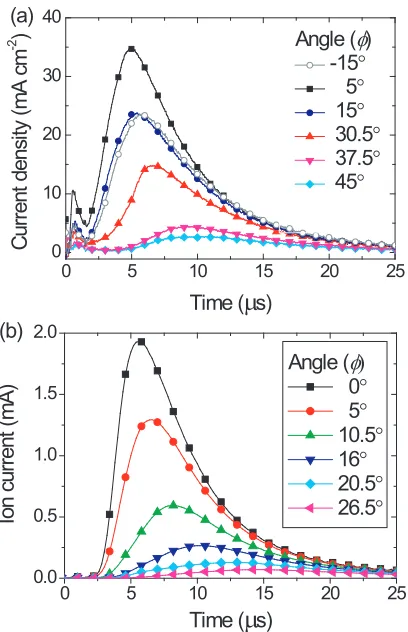
Figure5(a)shows TOF spectra at different angles meas-ured from the target normal forfsablation at 2.4 J cm2. The signal amplitude is greatest and the TOF is least along the target normal. There is no indication of a bimodal velocity distribution reported in Refs.2and7. The very weak feature near 1ls is due to some residual low-Z contamination. The general behavior of these ion signals is quite similar to that obtained forns ablation of Ag, which is shown in Fig.5(b)
for comparison.32,33 The ns ablation was done using a 248 nm, 26ns excimer laser with 2.0 J cm2 on a 1.8 mm
0.7 mm spot (0.013 cm2 area) and a 3 mm1.5 mm planar probe was positioned at 41 mm. This ablation spot is
3 times larger than thefslaser spot, though, as will be dis-cussed below, the angular size of the ion fluence and deposi-tion plumes are wider than the fs case. The ion energy
corresponding to the TOF for peak ion flux is 160 eV, which is quite similar to the value for fs ablation at the same fluence.
The angular distribution of ion TOF spectra was meas-ured for two orientations of the beam spot; with the long axis (x-axis) both horizontal and vertical, and the results are shown in Fig.6. With the long axis vertical the smaller hori-zontal spot dimension gives rise to wider angular distribution in the horizontal plane and vice versa. This so-called “flip-over effect” is in agreement with the gas dynamics model of plume expansion.18,19 The time-integrated ion signals were fitted with the angular distributionF(u)derived from the gas dynamical expansion model
FðuÞ=Fð0Þ ¼ ð1þtan2uÞ3=2½1þk2tan2u3=2; (1)
where the fitting parameter kis the asymptotic value of the longitudinal-to-transverse axes ratio of the semi-ellipsoidal shaped ablation plume. The parameter kis a measure of the elongation of the plume, i.e., a larger k means a more forward-peaked plume. This distribution describes the parti-cle deposition on a hemispherical surface, in contrast to the formula in Ref. 18which describes particle deposition on a planar substrate positioned parallel to the target surface. The fits in Fig.6show that when the long axis of the beam spot is horizontal the ion angular distribution in the horizontal plane is described bykx¼6.2 and byky¼4.0 with the long axis of
the beam spot in the vertical plane.
FIG. 3. (a) Ion signals on the probe at 7.5 from target normal for laser pulses delivered at 2 Hz on 5 different beam spots. (b) Ion energy analyser signals at an angle of 45from the normal for a Ag target, both rotating and stationary, obtained with the ion pass energy set at 47 eV. The fluence was 2.2 J cm2with the laser at normal incidence.
[image:4.612.72.278.61.390.2] [image:4.612.335.540.62.372.2]The flip-over effect occurs whenever the laser spot is not rotationally symmetric.18,22The plume expansion, which is assumed to be adiabatic and isentropic, is driven by the pressure gradients in the ablated material at the time when the adiabatic expansion commences. Typically at this time the ablated material exists as a thin layer of thickness Z0on
the ablation spot. Thus the pressure gradient and the plume acceleration are largest normal to the target surface and a forward-peaked ellipsoid plume is produced. Similarly, when the ablation spot is not rotationally symmetric the transverse pressure gradient is higher in the direction of the smaller spot dimension. For a rectangular laser beam spot the plume will exhibit a flip-over, i.e., during the expansion the plume evolves in such a way that that the major axis lies at 90to that of the initial spot.
The angular distribution of deposition (ions, neutral, and nanoparticles) was measured by depositing a Ag film on the inner side of a semi-cylindrical plastic sheet mounted at the same radial location as the probes. Figure7(a)shows a pho-tograph of a Ag film deposited using 16 000 laser shots with the long axis (x-axis) of the beam vertical; a new ablation spot was selected after every 200 laser shots. For this mea-surement the probe setup together with the target were rotated in the horizontal plane such that the laser struck the silver target at an angle of 10. The spatial variation of the film thickness was determined by light transmission, as described above. Then knowing the radius of curvature of
the plastic sheet, the angular distribution of the film thick-ness was found, and this is shown in Fig. 7(b). Fitting the distribution to Eq.(1)yieldsky¼2.4. This can be compared
withky¼4.0 for the ion distribution. Thus, the plasma part
of the plume is significantly narrower in angle than the over-all plume giving rise to deposition. The opposite tendency has been observed infsablation of nickel for fluence values below 0.8 J cm2.34 The reason for this difference in behav-iour is not clear at this stage, but may be related to the higher fluence used here combined with the low reflectivity for silver at 248 nm. In any case the deposition measurement shows no indication of the presence of a very narrowly-collimated ablation jet near the target normal, as was reported in Ref. 23. Figure8shows the angular variation of the ion fluence and deposition on a 41 mm radius cylindrical surface centered on the ablation spot for ns ablation under the same conditions as for the data in Fig. 5(b). As for the plume shape in fs ablation (Fig. 7), the plasma part of the plume is more forward-peaked than the net deposition.
It is of interest to make a quantitative comparison of the ablation yield, total deposition and total ion yield. For fs
[image:5.612.73.277.60.376.2]ablation at 2.4 J cm2the average ablation depth is 185 nm (slightly outside range of Fig.2) and the number of ablated atoms calculated from the crater dimensions is 1.7 1015.
FIG. 5. Angular variation of TOF ion signals for (a) fs ablation of silver 2.2 J cm2with vertical beam spot, and (b)nslaser ablation at 248 nm, 2.0 J cm2on a 1.8 mm0.7 mm spot and 45angle of incidence. The sig-nals were recorded by rotating a planar probe at 41 mm from the target.32,33
FIG. 6. (a) Schematic showing the beam spot (pink rectangle) orientation and plume deposition (grey ellipse). (b) Angular variation of the ion fluence in the horizontal plane forfsablation of Ag for both vertical and horizontal orientations of the beam spot.
[image:5.612.321.557.62.413.2]For a semi-ellipsoidal plume deposited on a substrate at a distance ofdfrom the ablation spot, the total deposited yield
Yis related to the deposition per unit areaF(0) in the direc-tion of the target normal direcdirec-tion and thek-values,kxandky
of the deposition plume by22
Y¼ 2pd2Fð0Þ=kxky: (2)
Since d¼80 mm, F(0)¼3.31013 atoms cm2 pulse1,
kx¼3.8 (estimated as described below) andky¼2.4 the total
number of atoms deposited per pulse isY¼1.51015, which is of the same order as the number of ablated atoms as meas-ured from the ablation crater. Repeating this calculation for
the ions gives a total ion yield of 2.01013, which is only about 1% of the ablated atoms. Noting that the ion fluence is a small fraction of the net deposition, it can be concluded that sputtering by ions is not a significant process.
It is also of interest to compare the efficiencies ofnsand
fs ablation with respect to both material removal and ion production. For thefsablation described above, the ablation efficiency is 4.51014 atoms/mJ of incident laser energy, which corresponds to 14 eV per atom, while the ion pro-duction efficiency is 51012 ions/mJ. Referring to the data in Refs.32and33for ablation of Ag with 26 ns, 248 nm laser irradiation at 2 J cm2on a 0.013 cm2 spot, it can be seen that the ablation efficiency is 4.21013 atoms/mJ and the ion production efficiency is 2.51013 ions/mJ. Thus it is clear, that for the laser fluence range considered here, the ablation efficiency is 10 times higher for fs irradiation, while the ion production efficiency is5 times lower. Since
fs andns laser ablation proceed in very different ways, it is not possible to identify a single factor to account for the very different ablation efficiencies. However, it can be noted that since the ns pulse is much longer than the electron-phonon relaxation time, which determines the time for heat conduc-tion in thefscase, the heat diffusion depth is smaller in thefs
case. In fsablation most of the ablated material is removed by nanofragmentation of superheated material,15,17,34,35 while in the ns ablation material removal is limited by sur-face evaporation from the laser heated sursur-face. Innsablation plume material evolved during the laser pulse absorbs the laser light leading to a reduction of the energy coupled to the target. It can also be noted that the efficiency of fsablation
[image:6.612.60.556.62.364.2]FIG. 7. (a) Photograph of the Ag film deposited on a semi-cylindrical plastic film centered of the ablation spot usingfsablation. (b) Angular variation of the deposition thickness and the ion fluence forfsablation of Ag using a vertical beam spot and 10angle of incidence.
FIG. 8. Angular variation of ion fluence and net deposition per pulse forns
[image:6.612.69.278.587.722.2]of Ni is one order of magnitude larger thanns ablation at approximately the same wavelength.9,36 While the ablation efficiency is higher with fs lasers, it should be noted that these lasers are more complicated and expensive than thens
lasers normally used for ablation.
There are reports of the observation of extremely narrow plumes forfsablation,23but as mentioned above, this has not been observed in the present experiment. Spectroscopic measurements of visible emission from ablation of ZnO,3 Ti,12 and BaTiO3 (Ref. 37) clearly show that the plume of
excited species is narrower forfs ablation thanns ablation. This general trend is supported by the ion and deposition data presented here. The comparison of plume shapes for dif-ferent ablation regimes is most easily done by comparing the
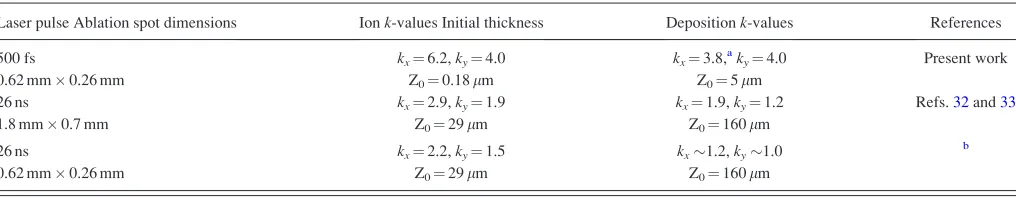
k-values. The k-values for both the ion and deposition plumes forfsandns ablation are compared in TableI. The
nsablation was done with a larger laser spot, but we can use the Anisimov model18,19to make an estimate of thek-values for similar ablation conditions on a smaller spot. Running the Anisimov model, with the adiabatic indexc¼1.25 (Ref.
21) for thensablation spot with a range of values for Z0and
comparing the predictedk-values with the measured values allows us to find the value of Z0for nsablation; the values
obtained are 29lm for the ion plume and 160lm for the deposition plume. Then using these values of Z0and thefs
spot dimensions, the Anisimov model gives kx¼2.2 and
ky¼1.5 for the ions andkx1.2 andky1.0 for the
deposi-tion, as shown in TableI. A value ofky1.0 implies that the
plume shape is approximately hemispherically symmetric in the yz-plane. Thus it is clear that, for the same ablation spot dimensions,fsablation gives rise to much narrower ion and deposition plumes thanns ablation. Unfortunately these k -values could not be confirmed by experiment since when the
fs beam was apertured to yield a circular beam the laser energy was reduced and signal on most of the probes was too small for measurement. It is possible to run the UV laser fa-cility at IESL-FORTH innsmode with same beam shape as the fsmode, but again the ion signals were insufficient for reliable measurement. The same trend towards narrower ablation plumes infsablation is observed in ablation of Ni using 250fslaser pulses at 527 nm.9The asymptotic aspect ratio of the ablation plume depends on the ratio of thickness to lateral dimension of the ablated material at the time when the adiabatic expansion commences. Thus, the results pre-sented here and in Ref.9indicate that the initial thicknesses of both the atomic and NP ablation layers infsablation are much less than fornsablation.
We need to consider if laser energy arriving before the main fs pulse has any influence on our measurements. The present measurements have been performed relatively close to the ablation threshold.5The energy of any prepulse on a
nstimescale has been estimated by Geretovszkyet al.38to be at most 25% of the total pulse energy and the contribution will not be significant, as can be seen from Fig.2.
A possible complicating feature is the roughness of the target surface, which is already induced by the first laser shot. Clearly it would be desirable to obtain the ion angular distribution data from the first shot of a virgin surface. How-ever, this is not possible because of the low-Z contamination of the target, and cleaning by even a few shots leads to roughening of the surface. The Anisimov model18,19 of plume expansion shows that there is negligible lateral expan-sion of the plume until the plume extent in the forward direc-tion is comparable to the lateral radius, which in our case will take 50 ns. This time is sufficiently long for ion-ion collisions to randomise any directed plasma motion arising from non-planarity of the crater floor.
IV. CONCLUSION
In summary, we have studied the plume dynamics from 500 fs laser ablation of silver at 248 nm with Langmuir probe and thin film deposition techniques. The TOF spectra fromfs
laser ablation show a single peak and are quite similar to those fornsablation at 248 nm and 355 nm at the same value of fluence.21,32,33The angular distribution of ions, as well as that of the deposition, can be analyzed and quantified in terms of Anisimov’s plume expansion model with realistic parameters. The present data for the plume dynamics indi-cate that the expansion is determined by the initial stage of the plume formation rather than by direct interaction between the ablated particles and the laser. An additional support for the validity of Anisimov’s model forfsablation is the obser-vation of a distinct flip-over effect for a horizontal and verti-cal laser beam spot. The angular distribution of ions and of the total deposit is somewhat narrower than for ns pulses evaluated on the basis of Anisimov’s model. The energy effi-ciency of fs laser ablation is 10 higher than ns ablation, while the ion production efficiency is lower forfsablation.
ACKNOWLEDGMENTS
[image:7.612.53.561.76.175.2]The authors want to thank Arne Nordskov for excellent technical assistance and the staff at IESL-FORTH for most
TABLE I. Comparison of k-values for femtosecond and nanosecond ablation.
Laser pulse Ablation spot dimensions Ionk-values Initial thickness Depositionk-values References
500 fs kx¼6.2,ky¼4.0 kx¼3.8,aky¼4.0 Present work
0.62 mm0.26 mm Z0¼0.18lm Z0¼5lm
26 ns kx¼2.9,ky¼1.9 kx¼1.9,ky¼1.2 Refs.32and33
1.8 mm0.7 mm Z0¼29lm Z0¼160lm
26 ns kx¼2.2,ky¼1.5 kx1.2,ky1.0
b
0.62 mm0.26 mm Z0¼29lm Z0¼160lm
aEstimated using Anisimov model.
bEstimatedk-values found from the Anisimov model using thefsspot dimensions but the initial ablated layer thickness corresponding tonsablation.
helpful local support. This work was supported by a grant from the EU Growth Programme. The work was carried out, in part, at the Ultraviolet Laser Facility operating at FORTH (Heraklion, Crete, Greece) with support from the EC through the Human Potential-Access to Research Infrastructures pro-gram (Contract No. HPRI-CT-2001-00139).
1
J. Kr€uger and W. Kautek, Laser Phys.9, 30 (1999).
2
S. Amoruso, X. Wang, C. Altucci, C. De Lisio, M. Armenante, R. Bruzzese, and R. Velotta,Appl. Phys. Lett.77, 3728 (2000).
3J. Perrie`re, E. Millon, W. Seiler, C. Boulmer-Leborgne, V. Cracuin,
O. Albert, J. C. Loulergue, and J. Etchepare, J. Appl. Phys. 91, 690 (2002).
4R. Stoian, A. Rosenfeld, D. Ashkenasi, I. V. Hertel, N. M. Bulgakova, and
E. E. B. Campbell,Phys. Rev. Lett.88, 097603 (2002).
5
S. Nolte, C. Momma, H. Jacobs, A. T€unnermann, B. N. Chichkov, B. Wellegehausen, and H. Welling,J. Opt. Soc. Am. B14, 2716 (1997).
6P. P. Pronko, Z. Zhang, and P. A. VanRompay, Appl Surf. Sci.208–209,
492 (2003).
7
Z. Zhang, P. A. VanRompay, J. A. Nees, and P. P. Pronko,J. Appl. Phys.
92, 2867 (2002).
8T. Donnelly, J. G. Lunney, S. Amoruso, R., Bruzzese, X. Wang, and
X. Ni,J. Appl. Phys.108, 043309 (2010).
9
T. Donnelly, J. G. Lunney, S. Amoruso, R., Bruzzese, X. Wang, and X. Ni,Appl. Phys. A100, 569 (2010).
10M. Sanz, M. Castillejo, S. Amoruso, G. Ausanio, R. Bruzzese, and X.
Wang,Appl. Phys. A101, 639 (2010).
11
V. Schmidt, W. Husinsky, and G. Betz,Phys. Rev. Lett.85, 3516 (2000).
12
O. Albert, Y. Glinec, J. C. Loulergue, J. Etchepare, C. Boulmer-Leborgne, J. Perriere, and E. Millon,Appl. Phys. A76, 319 (2003).
13A.-S. Loir, F. Garrelie, J.-L. Subtil, F. Goutaland, M. Belin, R. Le Harzic,
C. Donnet, Y. Ouerdane, F. Rogemond, and P. Laporte, Appl. Surf. Sci.
208–209, 553 (2003).
14F. Claeyssens, M. N. R. Ahsfold, E. Sofoulakis, C. G. Ristoscu, D. Anglos,
and C. Fotakis,J. Appl. Phys.91, 6162 (2002).
15
P. Balling and J. Schou, Rep. Prog. Phys.76, 036502 (2013).
16S. Amoruso, R. Bruzzese, N. Spinelli, R. Velotta, M. Vitiello, X. Wang,
G. Ausanio, V. Iannotti, and L. Lanotte,Appl. Lett.84, 4502 (2004).
17
M. Sanz, R. de Nalda, J. F. Marco, J. G. Izquierdo, L. Banares, and M. Castillejo,J. Phys. Chem. C114, 4864 (2010).
18S. I. Anisimov, B. S. Luk’yanchuk, and A. Luches, Appl. Surf. Sci.96–98,
24 (1996).
19
S. I. Anisimov, D. B€auerle, and B. S. Luk’yanchuk, Phys. Rev. B48, 12076 (1993).
20J. Schou. S. Amoruso, and J. G. Lunney, in Laser Ablation and Its
Applications, edited by C. L. Phipps (Springer, 2007), pp. 67–95.
21
B. Thestrup, B. Toftmann, J. Schou, B. Doggett, and J. G. Lunney, Appl. Surf. Sci.197–198, 175 (2002).
22B. Toftmann, J. Schou, and J. G. Lunney,Phys. Rev. B67, 104101 (2003). 23A. M. Komashko, M. D. Feit, and A. M. Rubenchik,Proc. SPIE
3935, 97 (2000).
24
S. Szatmari and P. F. Schafer,Opt. Commun.68, 196 (1988).
25B. Toftmann, J. Schou, T. N. Hansen, and J. G. Lunney,Phys. Rev. Lett.
84, 3998 (2000).
26
I. Weaver and C. L. S. Lewis,J. Appl. Phys.79, 7216 (1996).
27
CRC Handbook of Chemistry and Physics, 78th ed., edited by D. R. Lide (CRC Press, 1997).
28K. Vestentoft and P. Balling,Appl. Phys. A
84, 207 (2006).
29
J. Byskov-Nielsen, J.-M. Savolainen, M. S. Christensen, and P. Balling, Appl. Phys. A101, 97 (2010).
30C. Wu and L. V. Zhigilei, private communication (2012).
31B. Toftmann and J. Schou, “Time-resolved and integrated angular
distribu-tions of plume ions from silver at low and medium laser fluence,” Appl. Phys. A (to be published).
32B. Doggett and J. G. Lunney,J. Appl. Phys.109, 093304 (2011). 33
B. Doggett and J. G. Lunney,J. Appl. Phys.111, 099902 (2012).
34
S. Amoruso, R. Bruzzese, X. Wang, N. N. Nedialkov, and P. A. Atanasov, J. Appl. Phys. D40, 331 (2007).
35S. Eliezer, N. Eliaz, E. Grossman, D. Fisher, I. Gouzman, Z. Henis,
S. Pecker, Y. Horovitz, and M. Fraenkel,Phys. Rev. B69, 144119 (2004).
36
W. Svendsen, O. Ellegaard, and J. Schou,Appl. Phys. A63, 247 (1996).
37
E. Millon, J. Perriere, R. M. d’Efourmeau, D. d’Efourmeau, O. Albert, and J. Etchepare,Appl. Phys. A77, 73 (2003).
38Zs. Geretovszky, Z. Kantor, and T. Sz€orenyi,Appl. Surf. Sci.