www.impactjournals.com/oncotarget/ Oncotarget, 2018, Vol. 9, (No. 17), pp: 13959-13970
Association of body mass index with mortality and postoperative
survival in renal cell cancer patients, a meta-analysis
Jiao Zhang1,2,*, Qiang Chen2,*, Zhan-Ming Li1, Xu-Dong Xu1, Ai-Fang Song1 and Li-Shun Wang1,2
1Institute of Fudan-Minhang Academic Health System, Minhang Hospital, Fudan University, ShanghaI 201199, China 2School of Public Health Taishan Medical University, Taian, Shandong 271000, China
*These authors contributed equally to this work
Correspondence to: Li-Shun Wang, email: lishunwang@fudan.edu.cn
Ai-Fang Song, email: saf_1963@hotmail.com
Keywords: renal cell cancer; BMI; postoperative survival; mortality; meta-analysis
Received: May 12, 2017 Accepted: December 05, 2017 Published: January 12, 2018
Copyright: Zhang et al. This is an open-access article distributed under the terms of the Creative Commons Attribution License 3.0 (CC BY
3.0), which permits unrestricted use, distribution, and reproduction in any medium, provided the original author and source are credited.
ABSTRACT
Obesity is one of the major risk factors of cancer. However, how body mass index (BMI) influences the prognosis of renal cell cancer (RCC) patient is unclear. In this work, we have performed a meta-analysis to elucidate the role of abnormal weight in RCC mortality and postoperative survival. Articles related to BMI and RCC mortality as well as postoperative survival has been identified by searching PUBMED and ENBASE. Totally, 19 articles have been selected for this meta-analysis, 5 articles for RCC mortality and 14 for postoperative survival. Compared to normal weight, the estimated relative risks of RCC mortality are 0.71 (95% CI: 0.34–1.49), 1.19 (95% CI: 1.05–1.35) and 1.71 (95% CI: 1.27–2.00) respectively for the underweight, overweight and obesity patients. The risk of RCC mortality increase 5% for each 1 kg/m² increment of BMI. However, the estimated hazard ratios of cancer specific postoperative survival are 2.62 (95% CI: 1.67–4.11), 0.72 (95% CI: 0.63–0.83) and 0.66 (95% CI: 0.49–0.89) respectively for underweight, overweight and obesity RCC patients. The risk of hazard ratio decrease 5% for each 1 kg/m² increment of BMI. In addition, the hazard ratios of postoperative overall survival show a similar tendency. These results indicate an opposite association of BMI with mortality and postoperative survival in renal cell cancer patients.
INTRODUCTION
Cancer is one of the major causes of death in the world and an estimated 12.7 million new cancer cases occur annually, of which approximately 271,000 is new cases of kidney cancer [1]. Renal cell carcinoma (RCC), accounting for 2%-3% of all adult malignancies, is the most common kidney malignancy [2]. In many countries, RCC is increasingly diagnosed at an early stage, however, nearly 50% of RCC patients die within 5 years after diagnosis [3]. Obesity, hypertension and smoking are known risk factors of RCC [4–10]. Increased BMI was reported to be associated with high RCC incidence [11–13] both in men and women [14], however, extreme obesity didn’t predict poor cancer outcomes after surgery in RCC
patients [15], which indicated that the association between BMI and RCC prognosis is controversial. Therefore, we performed a meta-analysis to explore the relationship between BMI and RCC mortality as well as postoperative survival.
MATERIALS AND METHODS
Literature retrievalWe conducted a literature search of PubMed and Embase database as well as hand-searching to 2017/07/30 for studies evaluating the effect of BMI on the risk of RCC mortality and postoperative survival. The studies were searched using the terms “BMI or body mass index Meta-Analysis
or obesity or overweight” matched “mortality, prognostic or survival” and “renal cell cancer/carcinoma or kidney cancer/carcinoma”. And the publication language was restricted to English. We also searched the reference list of eligible articles. Only the most recent and informative one was included if several articles based on one data.
Eligibility criteria
The criteria of studies included in this meta-analysis were set out as: (i) the exposure of interest should be BMI, weight, obesity or underweight; (ii) the outcome of interest should be mortality or postoperative survival; (iii) articles should report BMI categories and risk estimates with responding 95% CIs, or have sufficient information for us to calculate them.
Data extraction
All the articles were analyzed independently by two investigators. Data extracted by one and checked by two. And discrepancies were discussed by all investigators until consensus was reached. The following information were extracted from each articles included: the first author’s name, publication year, country, mean age or median age and the range, follow-up year, study size, number of cases (Table 1), BMI categories and hazard ratio or relative ratio estimates including 95% CIs and surgical method (Table 2). We extracted RR or HR estimates from multivariate for analysis which were adjusted by most complete confounding factors for studies.
Assessment of methodological quality
We assessed the methodological quality of the articles included rely on the Newcastle-Ottawa Scale Star (NOS) system [16]. It assesses study quality by 3 classifications including selection, comparability and outcome with a total score of 9 stars. Of these 9 stars, 4 represents for the appropriate selection of exposure and nonexposure cohort participants, 2 represents for the comparability of cohort, and the last 3 describes the assessment of outcome and follow-up. Articles were considered as high quality study if its’ quality score more than or equal to 5 stars.
Statistical methods
For different BMI levels, we conducted separate meta-analysis [14]. For each study, the normal weight represented the referent category, underweight represented the lowest category, obesity represented the highest category which provided that two or more categories above the reference category, whiles the overweight represented between obesity and normal weight categories. And we compared each categories with normal weight. The summary estimates of RR or HR and 95% CIs were
calculated by using a random-effects model to evaluated the inter-study heterogeneity [17].
For dose-response analysis, a two-staged random-effects dose-response meta-analysis [18] was performed to compute the trend from the correlated logHR estimates across levels of BMI, taking into account the between-study heterogeneity. Firstly, a restricted cubic spline model with three knots at percentiles 10, 50 and 90% of the distribution was estimated using generalized least-square regression taking into account the correlation within each set of published RRs/HRs. Then, the GLST command with the generalized least-squares regression was used to carry out the dose-response meta-analysis. The estimated RR/HR and their 95% CI were represented by solid line and the long dash line. Short dash line represents the liner relationship (per 1 kg/m² increment). And a p value for nonlinearity was calculated by testing the null hypothesis that the coefficient of the second spline was equal to zero [19]. And the evidence of publication bias was estimated by visual inspection of funnel plots using Egger’s regression test [20].
All the statistical analysis was performed by using Stata SE 12 for Windows (Stata Corporation, College Station, TX). And all p values were 2-sided. p < 0.05 was regarded as statistically significant.
RESULTS
Characteristics of the studies
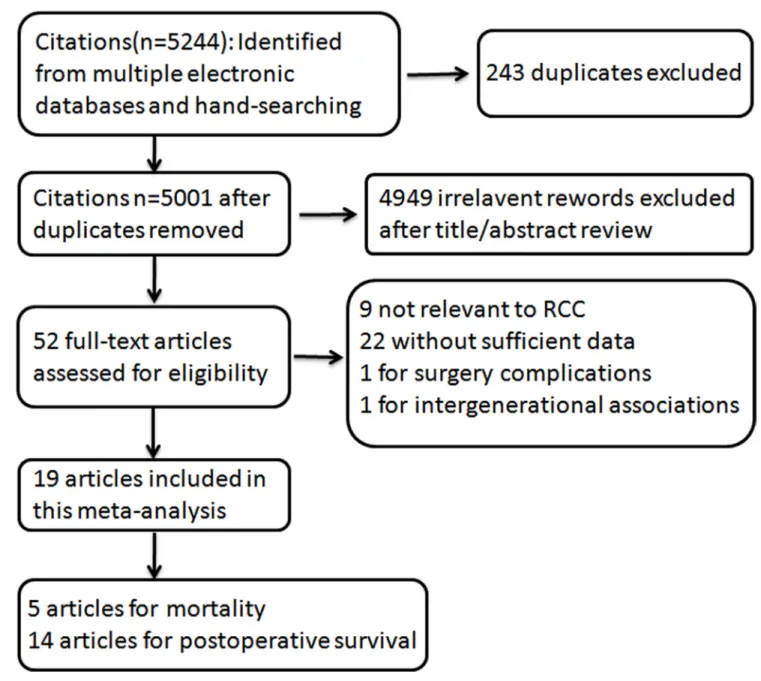
5244 citations were identified from PUBMED and EMBASE, of which 243 duplicative ones were excluded after reviewed. Figure 1 showed the process of our study selection. As for the remaining 5001 citations, 4949 were excluded by scanning either the titles or abstracts. For the 52 remaining potentially related articles, full-text was reviewed in detail, of which 9 articles not relevant to RCC, 22 without sufficient data reported, 1 for surgery complications and 1 for intergenerational associations were excluded. Totally 19 articles were included for this meta-analysis, of which, 5 for RCC mortality [21–25], and 14 for RCC postoperative survival [26–39]. The follow-up intervals were from 4 to 35 years for RCC mortality, and 2.3 to 9.75 years for RCC postoperative survival.
The main characteristics of the studies are shown in the Table 1 and Table 2. Newcastle-Ottawa Scale (NOS) was used to assess the quality score of these articles and all these included articles were above 6 stars (Tables 1 and 2).
BMI and mortality in RCC
The association of BMI and RCC mortality was shown in Figure 2. With the comparison to normal weight, the estimated relative risk (RR) of RCC mortality for the underweight was 0.71 (95% CI: 0.34–1.48), while for the overweight and obesity, the RRs were 1.19 (95% CI: 1.04– 1.37) and 1.71 (95% CI: 1.45–2.02) based on
random-effect models. There was no heterogeneity in underweight and obesity groups and the heterogeneity was slightly high in overweight group (I² = 40.2%, P = 0.154).
In addition, a dose-response meta-analysis including 5 articles [21–25] was performed, a liner relationship was shown in the Figure 3. It was revealed that per 1 kg/m² increment in BMI was associated with a 5% higher risk of mortality in RCC patients (RR: 1.05 (1.03–1.07) P = 0.000).
BMI and postoperative survival in RCC
The combined hazard ratio (HR) of CSS were 2.62 (95% CI: 1.67–4.11), 0.71 (95% CI: 0.62–0.82), 0.66 (95% CI: 0.49–0.89) respectively for the category of underweight, overweight and obesity based on random-effect models (Figure 4). Heterogeneity was found in obesity group (I² = 65.0% P = 0.009).
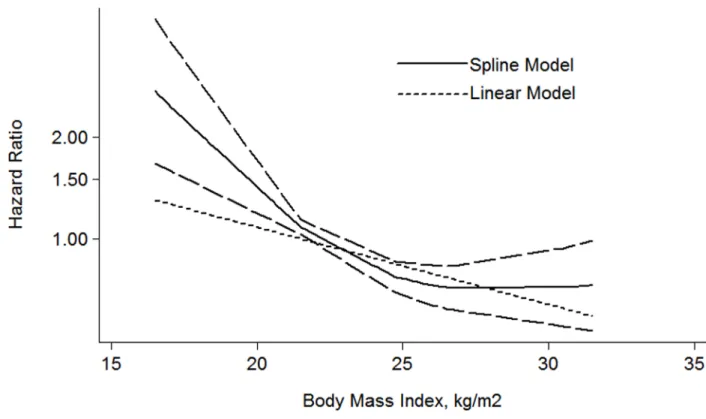
For the dose-response meta-analysis, 6 articles were included [28, 30, 31, 34–36]. As shown in the Figure 5, the BMI-CSS relationship showed a L-shaped curve with a nadir at around BMI value of 26 kg/m². The risk of HR decrease 5% for each 1 kg/m² increment of BMI (HR: 0.95 (0.92–0.98) P = 0.001).
In addition, overweight and obesity patients had significantly longer overall survival (OS) time than normal weight patients (HR: overweight: 0.76 (95% CI: 0.61–0.95); obesity: 0.57 (95% CI: 0.34–0.97)) (Figure 6). For the BMI-OS dose-response meta-analysis, 4 articles were included [27, 31, 33, 35], which showed a similar tendency with the CSS curve (HR: 0.93 (0.86–0.99) P = 0.021) (Figure 7). Before the BMI of around 26 kg/m², the HR of survival decreased with the increase of body weight, and then tended to a stable value.
Meta-regression analysis
We conducted the meta-regression analysis to investigate whether the association between BMI and RCC postoperative survival is modified by study location, publication year, follow up and sample size. We found that the study location can explain 62.8% and 100% heterogeneity for CSS and OS in the obesity category. For the Asia, the combined HR were 0.44 (95% CI: 0.30–0.64; I² = 0.0%) and 0.43 (95% CI: 0.31–0.61; I² = 0.0%) for CSS and OS in the obesity category.
Sensitivity analysis
For study influence analysis, one study was removed and the rest was analyzed. The pooled RR for mortality ranged from 0.60 to 1.17 for underweight, from 1.14 to 1.23 for overweight and from 1.68 to 1.73 for obesity respectively. And for postoperative CSS, the pooled HRs
ranged from 2.36 to 3.20 for underweight, from 0.68 to 0.73 for overweight and from 0.58 to 0.71 for obesity respectively. The HRs for overweight and obesity ranged from 0.70 to 0.76 and 0.43 to 0.58 for postoperative OS. All of the results showed that the pooled estimates were stable and not influenced by a single study.
Publication bias
Publication bias was assessed by using Egger regression test and Begg funnel plot. And there were no efficient evidence indicating publication bias on the relationship of BMI and RCC mortality and postoperative survival.
DISCUSSION
In this meta-analysis, we observed a statistically significant increased risk of RCC mortality in overweight and obese individuals as compared with their
Figure 3: The dose-response analysis between BMI and RCC mortality in studies with restricted cubic spline in a multivariate random-effects dose-response model.
Figure 5: The dose-response analysis between BMI and RCC CSS in studies with restricted cubic spline in a multivariate random-effects dose-response model.
weight peers. However, decreased risk of postoperative survival was observed in overweight and obesity RCC patients.
RCC mortality is the measure of deaths (in general, or due to a specific cause) in RCC population. The mechanism by which obesity may increase RCC mortality is not well studied [40], although mechanisms linking obesity with RCC incidence have been studied long time. Increasing prevalence of obesity is thought to contribute to the increasing incidence of RCC via several hormonal mechanisms including free estrogen [41], insulin and IGF-1 [42, 43], as well as physical damage mechanisms by lipid peroxidation, higher glomerular filtration rate and renal plasma flow [44, 45]. The RCC progression might share these mechanisms and develop fast in obesity RCC patients. In addition, increased BMI also increase the risk of other chronic disease including cardiovascular and stroke and thus increase the death risk.
On the other hand, it was reported that people without surgery-treatment have a significantly shorter survival time than surgical patients [31, 46, 47] indicating that surgery is a great factor for RCC postoperative survival. Obesity contributes to poor postoperative complications especially wound infection [48–53]. Yet, overweight and obesity might provide more sufficient nutritional reserve and metabolic state to overcome the stress of surgery. On the other hand, underweight are bad in energy use and metabolic excess, which fail to deal with the extreme stress of major surgery as well as remained tumor cells. And a molecular mechanism underlying this
phenomenon may be that higher BMI associating with lower serum total adiponectin and thus may inhibit the remaining disseminated RCC cells [54].
A clinical-based cohort and meta-analysis by Choi et al [35] revealed that the postoperative survival significantly increased in highest BMI RCC patients than lowest BMI RCC patients. To clearly reveal the relationship between each BMI category and RCC postoperative survival, the postoperative survival of abnormal weight (underweight, overweight and obesity) were compared to normal weight in this study, in addition, their dose-response relationship were analyzed and the risk of hazard ratio was found to decrease 5% for each 1 kg/m² increment of BMI.
Previously, a meta-analysis by Bagheri et al [55], of which 6 articles included, 5 for CSS, 3 for OS, stated that the CSS increased in relation to BMI, while for the OS, it decreased for each increase in BMI over 25kg/m2. Of our meta-analysis, 14 articles have been included for CSS and OS, and the results indicate that both overweight and obesity were beneficial to postoperative survival. Our conclusion is not identical to this meta-analysis. The numbers of included articles for the meta-analysis may contribute to this difference. In addition, that meta-analysis didn’t study the relation between BMI and RCC mortality. Our meta-analysis have studied the relationship between BMI and RCC mortality and found that BMI was a risk factor for RCC mortality.
On the other hand, BMI and the incidence of RCC had been analyzed by wang et al [14], whose results indicated that increase of body weight may increase the
Figure 7: The dose-response analysis between BMI and RCC OS in studies with restricted cubic spline in a multivariate random-effects dose-response model.
incidence of RCC. The increased incidence of RCC in overweight and obesity populations might contribute to the corresponding increased mortality of RCC.
There are some limitations in our meta-analysis. Firstly, abnormal weight was associated with unhealthy diet habit, but the studies included were almost not adjusted for it. Secondly, obesity tends to be accompanied
with diabetes, which is also associated with RCC [56], but there is no sufficient information to analyze it. Thirdly, lacking of higher obese, such as obese class III, information limit us to evaluate the status of morbidly obese survival. Last, the association between BMI and RCC histological information were lacked which limit us to histological subgroup analysis.
Table 1: Characteristics of the 5 included articles on BMI and mortality of RCC
Author, year country Study type Mean/ median age, Follow up Study size,number of cases BMI (Kg/m 2)
cases RR (95% CI) Adjustmentfactors NOS
Reeves et al. 2007 UK Cohort 50–64 7 1222630 < 22.5 63 22.5–24.9 81 25.0–27.4 80 27.5–29.5 58 ≥ 30 100 per 10 units 1.01 (0.79–1.30) 1.00 (0.80–1.24) 1.14 (0.92–1.42) 1.30 (1.01–1.68) 1.71 (1.39–2.09) 1.65 (1.28–2.13
Age, socio economic status, smoking, alcohol,
physical activity, region, years since menopause and use of hormone replacement therapy, geographical reproductive history, 7 Batty et al. 2005 Austrilia Cohort 55.9 35 18403 18.5–24.9 36 25.0–29.9 20 ≥30 5 1.0 0.58 (0.32–1.04) 1.20 (0.41–3.52)
Age, physical activity, plus employment grade, smoking, marital status, disease at entry, weight loss in the last year, height, FEV1, blood pressure-lowering medication, triceps skin
fold thickness, systolic blood pressure, plasma cholesterol, glucose intolerance and diabetes
status. 8 Calle et al. 2003 USA Cohort 57 16 900053 M:404576 W:495477 M 18.5–24.9 305 25.0–29.9 437 30.0–34.9 81 ≥ 35 14 W 18.5–24.9 243 25.0–29.9 153 30.0–34.9 55 35.0–39.9 12 ≥ 40 10 M 1.00 1.18 (1.02–1.37) 1.36 (1.06–1.74) 1.70 (0.99–2.92) W 1.00 1.33 (1.08–1.63) 1.66 (1.23–2.24) 1.70 (0.94–3.05) 4.75 (2.50–9.04)
Age, education, smoking status, physical activity,
number of cigarettes, fat consumption, alcohol, marital status, aspirin use, vegetables
consumption. 8 Parr et al 2010 Asia-Pacific Cohort 48 4 424519 12.0–18.4 2 18.5–24.9 29 25.0–29.9 27 30.0–60.0 9 Per 5 units (> 18.5) 1.17 (0.28–4.97) 1.00 (0.70–1.43) 1.42 (0.96–2.12) 1.59 (0.78–3.24) 1.20 (0.86–1.66)
Age and smoking 7
Heath et al. 1997 USA Cohort 56–57 7 998904 M < 20.7 4 20.7–24.6 62 24.7–27.7 81 27.8–31.0 48 ≥31.1 17 W < 19.1 2 19.1–21.9 18 22.0–27.2 57 27.3–32.2 33 ≥ 32.3 13 M 0.6 (0.2–1.5) 1.0 1.1 (0.8–1.6) 1.6 (1.1–2.3) 1.6 (0.9–2.7) W 0.6 (0.1–2.5) 1.0 1.5 (0.9–2.6) 2.5 (1.4–4.4) 3.15 (1.5–6.4) Adjusted age 7
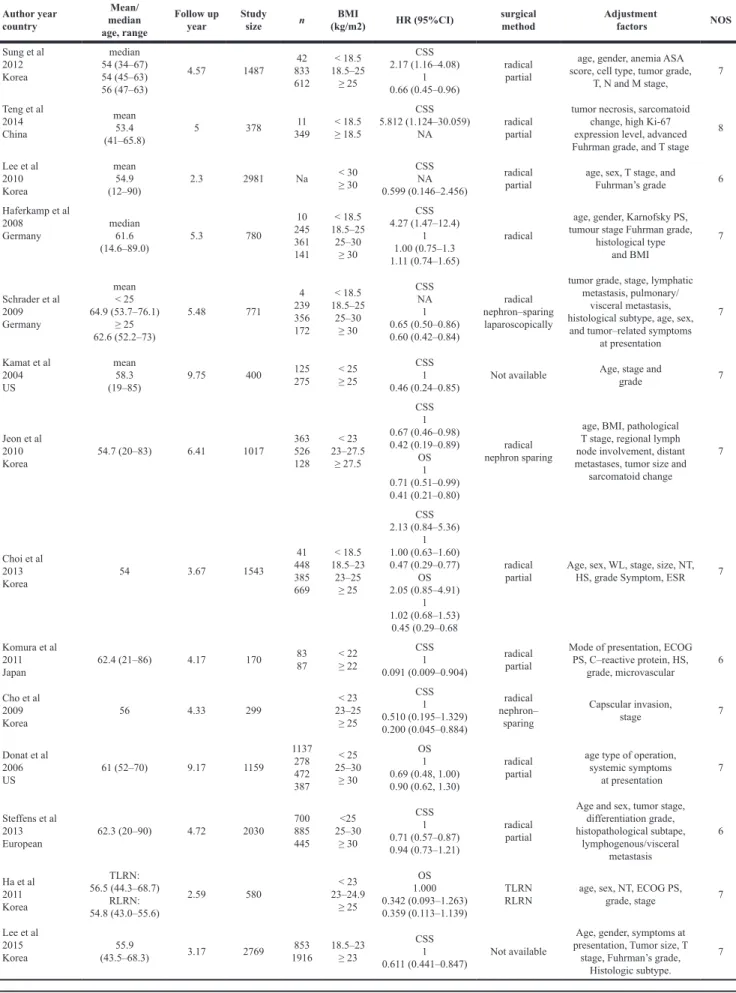
Table 2: Characteristics of the 14 articles on BMI and postoperative survival of RCC
Author year country Mean/ median age, range Follow upyear Study size n (kg/m2)BMI HR (95%CI) surgical method Adjustment factors NOS
Sung et al 2012 Korea median 54 (34–67) 54 (45–63) 56 (47–63) 4.57 1487 833 42 612 < 18.5 18.5–25 ≥ 25 CSS 2.17 (1.16–4.08) 1 0.66 (0.45–0.96) radical partial
age, gender, anemia ASA score, cell type, tumor grade,
T, N and M stage, 7 Teng et al 2014 China mean 53.4 (41–65.8) 5 378 11 349 < 18.5 ≥ 18.5 CSS 5.812 (1.124–30.059) NA radical partial
tumor necrosis, sarcomatoid change, high Ki-67 expression level, advanced Fuhrman grade, and T stage
8 Lee et al 2010 Korea mean 54.9 (12–90) 2.3 2981 Na < 30 ≥ 30 CSS NA 0.599 (0.146–2.456) radical
partial age, sex, T stage, and Fuhrman’s grade 6 Haferkamp et al 2008 Germany median 61.6 (14.6–89.0) 5.3 780 10 245 361 141 < 18.5 18.5–25 25–30 ≥ 30 CSS 4.27 (1.47–12.4) 1 1.00 (0.75–1.3 1.11 (0.74–1.65) radical
age, gender, Karnofsky PS, tumour stage Fuhrman grade,
histological type and BMI 7 Schrader et al 2009 Germany mean < 25 64.9 (53.7–76.1) ≥ 25 62.6 (52.2–73) 5.48 771 4 239 356 172 < 18.5 18.5–25 25–30 ≥ 30 CSS NA 1 0.65 (0.50–0.86) 0.60 (0.42–0.84) radical nephron–sparing laparoscopically
tumor grade, stage, lymphatic metastasis, pulmonary/
visceral metastasis, histological subtype, age, sex,
and tumor–related symptoms at presentation 7 Kamat et al 2004 US mean 58.3 (19–85) 9.75 400 125 275 < 25 ≥ 25 CSS 1 0.46 (0.24–0.85) Not available
Age, stage and
grade 7 Jeon et al 2010 Korea 54.7 (20–83) 6.41 1017 363 526 128 < 23 23–27.5 ≥ 27.5 CSS 1 0.67 (0.46–0.98) 0.42 (0.19–0.89) OS 1 0.71 (0.51–0.99) 0.41 (0.21–0.80) radical nephron sparing
age, BMI, pathological T stage, regional lymph node involvement, distant metastases, tumor size and
sarcomatoid change 7 Choi et al 2013 Korea 54 3.67 1543 41 448 385 669 < 18.5 18.5–23 23–25 ≥ 25 CSS 2.13 (0.84–5.36) 1 1.00 (0.63–1.60) 0.47 (0.29–0.77) OS 2.05 (0.85–4.91) 1 1.02 (0.68–1.53) 0.45 (0.29–0.68 radical
partial Age, sex, WL, stage, size, NT, HS, grade Symptom, ESR 7
Komura et al 2011 Japan 62.4 (21–86) 4.17 170 83 87 < 22 ≥ 22 CSS 1 0.091 (0.009–0.904) radical partial
Mode of presentation, ECOG PS, C–reactive protein, HS, grade, microvascular 6 Cho et al 2009 Korea 56 4.33 299 < 23 23–25 ≥ 25 CSS 1 0.510 (0.195–1.329) 0.200 (0.045–0.884) radical nephron– sparing Capscular invasion, stage 7 Donat et al 2006 US 61 (52–70) 9.17 1159 1137 278 472 387 < 25 25–30 ≥ 30 OS 1 0.69 (0.48, 1.00) 0.90 (0.62, 1.30) radical partial
age type of operation, systemic symptoms at presentation 7 Steffens et al 2013 European 62.3 (20–90) 4.72 2030 700 885 445 <25 25–30 ≥ 30 CSS 1 0.71 (0.57–0.87) 0.94 (0.73–1.21) radical partial
Age and sex, tumor stage, differentiation grade, histopathological subtape, lymphogenous/visceral metastasis 6 Ha et al 2011 Korea TLRN: 56.5 (44.3–68.7) RLRN: 54.8 (43.0–55.6) 2.59 580 23–24.9 < 23 ≥ 25 OS 1.000 0.342 (0.093–1.263) 0.359 (0.113–1.139) TLRN
RLRN age, sex, NT, ECOG PS, grade, stage 7 Lee et al 2015 Korea (43.5–68.3)55.9 3.17 2769 1916853 18.5–23 ≥ 23 CSS 1 0.611 (0.441–0.847) Not available
Age, gender, symptoms at presentation, Tumor size, T
stage, Fuhrman’s grade, Histologic subtype.
In conclusion, our meta-analysis indicated that obesity may be associated with high risk of mortality in whole RCC patient but a better survival in surgery-treated RCC patients. Individualized weight control might be necessary for RCC patients.
CONFLICTS OF INTEREST
The authors confirm that this article content has no conflicts of interest.
FUNDING
This work is supported in part by grants from National Natural Science Foundation of China (81472758, 31170783, U1302225).
REFERENCES
1. Jemal A, Bray F, Center MM, Ferlay J, Ward E, Forman D. Global cancer statistics. CA Cancer J Clin. 2011; 61:69–90. 2. Ohno Y, Nakashima J, Nakagami Y, Satake N, Gondo T,
Ohori M, Hatano T, Tachibana M. Sex and the clinical value of body mass index in patients with clear cell renal cell carcinoma. Br J Cancer. 2013; 109:1899–903.
3. Cho E, Adami HO, Lindblad P. Epidemiology of renal cell cancer. Hematol Oncol Clin North Am. 2011; 25:651–65. 4. Flaherty KT, Fuchs CS, Colditz GA, Stampfer MJ, Speizer
FE, Willett WC, Curhan GC. A prospective study of body mass index, hypertension, and smoking and the risk of renal cell carcinoma (United States). Cancer Causes Control. 2005; 16:1099–106.
5. Hunt JD, van der Hel OL, McMillan GP, Boffetta P, Brennan P. Renal cell carcinoma in relation to cigarette smoking: meta-analysis of 24 studies. Int J Cancer. 2005; 114:101–08.
6. Moore LE, Wilson RT, Campleman SL. Lifestyle factors, exposures, genetic susceptibility, and renal cell cancer risk: a review. Cancer Invest. 2005; 23:240–55.
7. Schouten LJ, van Dijk BA, Oosterwijk E, Hulsbergen-van de Kaa CA, Kiemeney LA, Goldbohm RA, Schalken JA, van den Brandt PA. Hypertension, antihypertensives and mutations in the Von Hippel-Lindau gene in renal cell carcinoma: results from the Netherlands Cohort Study. J Hypertens. 2005; 23:1997–2004.
8. Setiawan VW, Stram DO, Nomura AM, Kolonel LN, Henderson BE. Risk factors for renal cell cancer: the multiethnic cohort. Am J Epidemiol. 2007; 166:932–40. 9. Sanfilippo KM, McTigue KM, Fidler CJ, Neaton JD, Chang
Y, Fried LF, Liu S, Kuller LH. Hypertension and obesity and the risk of kidney cancer in 2 large cohorts of US men and women. Hypertension. 2014; 63:934–41.
10. Chow WH, Dong LM, Devesa SS. Epidemiology and risk factors for kidney cancer. Nat Rev Urol. 2010; 7:245–57.
11. Luke C, Sargent N, Pittman K, Price T, Roder D. Epidemiology of cancers of the kidney in an Australian population. Asian Pac J Cancer Prev. 2011; 12:2893–99. 12. Ildaphonse G, George PS, Mathew A. Obesity and kidney
cancer risk in men: a meta-analysis (1992–2008). Asian Pac J Cancer Prev. 2009; 10:279–86.
13. Mathew A, George PS, Ildaphonse G. Obesity and kidney cancer risk in women: a meta-analysis (1992–2008). Asian Pac J Cancer Prev. 2009; 10:471–78.
14. Wang F, Xu Y. Body mass index and risk of renal cell cancer: a dose-response meta-analysis of published cohort studies. Int J Cancer. 2014; 135:1673–86.
15. Blute ML Jr, Zorn K, Grimes M, Shi F, Downs TM, Jarrard DF, Best SL, Richards K, Nakada SY, Abel EJ. Extreme obesity does not predict poor cancer outcomes after surgery for renal cell cancer. BJU Int. 2016; 118:399–407.
16. Shi YQ, Yang J, Du P, Xu T, Zhuang XH, Shen JQ, Xu CF. Effect of Body Mass Index on Overall Survival of Pancreatic Cancer: A Meta-Analysis. Medicine (Baltimore). 2016; 95:e3305.
17. Zhong S, Yan X, Wu Y, Zhang X, Chen L, Tang J, Zhao J. Body mass index and mortality in prostate cancer patients: a dose-response meta-analysis. Prostate Cancer Prostatic Dis. 2016; 19:122–31.
18. Orsini N, Li R, Wolk A, Khudyakov P, Spiegelman D. Meta-analysis for linear and nonlinear dose-response relations: examples, an evaluation of approximations, and software. Am J Epidemiol. 2012; 175:66–73.
19. Desquilbet L, Mariotti F. Dose-response analyses using restricted cubic spline functions in public health research. Stat Med. 2010; 29:1037–57.
20. Egger M, Davey Smith G, Schneider M, Minder C. Bias in meta-analysis detected by a simple, graphical test. BMJ. 1997; 315:629–34.
21. Heath CW Jr, Lally CA, Calle EE, McLaughlin JK, Thun MJ. Hypertension, diuretics, and antihypertensive medications as possible risk factors for renal cell cancer. Am J Epidemiol. 1997; 145:607–13.
22. Calle EE, Rodriguez C, Walker-Thurmond K, Thun MJ. Overweight, obesity, and mortality from cancer in a prospectively studied cohort of U.S. adults. N Engl J Med. 2003; 348:1625–38.
23. Batty GD, Shipley MJ, Jarrett RJ, Breeze E, Marmot MG, Smith GD. Obesity and overweight in relation to organ-specific cancer mortality in London (UK): findings from the original Whitehall study. Int J Obes. 2005; 29:1267–74. 24. Reeves GK, Pirie K, Beral V, Green J, Spencer E, Bull D,
and Million Women Study Collaboration. Cancer incidence and mortality in relation to body mass index in the Million Women Study: cohort study. BMJ. 2007; 335:1134. 25. Parr CL, Batty GD, Lam TH, Barzi F, Fang X, Ho SC,
Jee SH, Ansary-Moghaddam A, Jamrozik K, Ueshima H, Woodward M, Huxley RR; Asia-Pacific Cohort Studies Collaboration. Body-mass index and cancer mortality in the
Asia-Pacific Cohort Studies Collaboration: pooled analyses of 424,519 participants. Lancet Oncol. 2010; 11:741–52. 26. Kamat AM, Shock RP, Naya Y, Rosser CJ, Slaton JW,
Pisters LL. Prognostic value of body mass index in patients undergoing nephrectomy for localized renal tumors. Urology. 2004; 63:46–50.
27. Donat SM, Salzhauer EW, Mitra N, Yanke BV, Snyder ME, Russo P. Impact of body mass index on survival of patients with surgically treated renal cell carcinoma. J Urol. 2006; 175:46–52.
28. Haferkamp A, Pritsch M, Bedke J, Wagener N, Pfitzenmaier J, Buse S, Hohenfellner M. The influence of body mass index on the long-term survival of patients with renal cell carcinoma after tumour nephrectomy. BJU Int. 2008; 101:1243–46.
29. Cho HJ, Kim SJ, Ha US, Hong SH, Kim JC, Choi YJ, Hwang TK. Prognostic value of capsular invasion for localized clear-cell renal cell carcinoma. Eur Urol. 2009; 56:1006–12.
30. Schrader AJ, Rustemeier J, Rustemeier JC, Timmesfeld N, Varga Z, Hegele A, Olbert PJ, Hofmann R. Overweight is associated with improved cancer-specific survival in patients with organ-confined renal cell carcinoma. J Cancer Res Clin Oncol. 2009; 135:1693–99.
31. Jeon HG, Jeong IG, Lee JH, Lee CJ, Kwak C, Kim HH, Lee SE, Lee E. Prognostic value of body mass index in Korean patients with renal cell carcinoma. J Urol. 2010; 183:448–54. 32. Lee WK, Byun SS, Kim HH, Rha KH, Hwang TK, Sung
GT, Lee W, Lim JS, Jeong YB, Kwon TG. Characteristics and prognosis of chromophobe non-metastatic renal cell carcinoma: a multicenter study. International Journal of Urology. 2010; 17:898–904.
33. Komura K, Inamoto T, Black PC, Koyama K, Katsuoka Y, Watsuji T, Azuma H. Prognostic significance of body mass index in Asian patients with localized renal cell carcinoma. Nutr Cancer. 2011; 63:908–15.
34. Sung HH, Jeon SS, Park SY, Jeong BC, Seo SI, Lee HM, Choi HY. Impact of body mass index in Korean patients with renal cell carcinoma. Cancer Causes Control. 2012; 23:505–11.
35. Choi Y, Park B, Jeong BC, Seo SI, Jeon SS, Choi HY, Adami HO, Lee JE, Lee HM. Body mass index and survival in patients with renal cell carcinoma: a clinical-based cohort and meta-analysis. Int J Cancer. 2013; 132:625–34. 36. Steffens S, Ringe KI, Schroeer K, Lehmann R, Rustemeier
J, Wegener G, Schrader M, Hofmann R, Kuczyk MA, Schrader AJ; German Renal Cell Tumor Network. Does overweight influence the prognosis of renal cell carcinoma? Results of a multicenter study. International Journal of Urology. 2013; 20:585–592.
37. Teng J, Gao Y, Chen M, Wang K, Cui X, Liu Y, Xu D. Prognostic value of clinical and pathological factors for surgically treated localized clear cell renal cell carcinoma. Chin Med J (Engl). 2014; 127:1640–44.
38. Lee WK, Hong SK, Lee S, Kwak C, Oh JJ, Jeong CW, Kim YJ, Kang SH, Hong SH, Byun SS. Prognostic Value of Body Mass Index According to Histologic Subtype in Nonmetastatic Renal Cell Carcinoma: A Large Cohort Analysis. Clin Genitourin Cancer. 2015; 13:461–68. 39. Deng FM, Melamed J. Histologic variants of renal cell
carcinoma: does tumor type influence outcome? Urol Clin North Am. 2012; 39:119–32.
40. Calle EE, Kaaks R. Overweight, obesity and cancer: epidemiological evidence and proposed mechanisms. Nat Rev Cancer. 2004; 4:579–91.
41. Zumoff B. Hormonal abnormalities in obesity. Acta Med Scand Suppl. 1988; 723:153–60.
42. Frystyk J, Vestbo E, Skjaerbaek C, Mogensen CE, Orskov H. Free insulin-like growth factors in human obesity. Metabolism. 1995; 44:37–44.
43. Kellerer M, von Eye Corleta H, Mühlhöfer A, Capp E, Mosthaf L, Bock S, Petrides PE, Häring HU. Insulin- and insulin-like growth-factor-I receptor tyrosine-kinase activities in human renal carcinoma. Int J Cancer. 1995; 62:501–07.
44. Hall JE. Louis K. Dahl Memorial Lecture. Renal and cardiovascular mechanisms of hypertension in obesity. Hypertension. 1994; 23:381–94.
45. Ribstein J, du Cailar G, Mimran A. Combined renal effects of overweight and hypertension. Hypertension. 1995; 26:610–15.
46. Patel HD, Kates M, Pierorazio PM, Hyams ES, Gorin MA, Ball MW, Bhayani SB, Hui X, Thompson CB, Allaf ME. Survival after diagnosis of localized T1a kidney cancer: current population-based practice of surgery and nonsurgical management. Urology. 2014; 83:126–32. 47. Hollenbeck BK. Commentary on “Racial disparity in renal
cell carcinoma patient survival according to demographic and clinical characteristics.” Chow WH, Shuch B, Linehan WM, Devesa SS, Division of Cancer Epidemiology and Genetics, National Cancer Institute, Bethesda, MD.: Cancer 2013; 119:388–94. [Epub 2012 Nov 12]. https://doi. org/10.1002/cncr.27690. Urologic Oncology. 2014; 32:512. 48. Lee CT, Dunn RL, Chen BT, Joshi DP, Sheffield J, Montie
JE. Impact of body mass index on radical cystectomy. J Urol. 2004; 172:1281–85.
49. House MG, Fong Y, Arnaoutakis DJ, Sharma R, Winston CB, Protic M, Gonen M, Olson SH, Kurtz RC, Brennan MF, Allen PJ. Preoperative predictors for complications after pancreaticoduodenectomy: impact of BMI and body fat distribution. Journal of Gastrointestinal Surgery. 2008; 12:270–278.
50. Holley JL, Shapiro R, Lopatin WB, Tzakis AG, Hakala TR, Starzl TE. Obesity as a risk factor following cadaveric renal transplantation. Transplantation. 1990; 49:387–89. 51. Hawn MT, Bian J, Leeth RR, Ritchie G, Allen N, Bland KI,
Vickers SM. Impact of obesity on resource utilization for general surgical procedures. Ann Surg. 2005; 241:821–26.
52. Thomas EJ, Goldman L, Mangione CM, Marcantonio ER, Cook EF, Ludwig L, Sugarbaker D, Poss R, Donaldson M, Lee TH. Body mass index as a correlate of postoperative complications and resource utilization. Am J Med. 1997; 102:277–83.
53. Pravinkumar E. Obesity in general elective surgery. Lancet. 2003; 362:576–77.
54. Ito R, Narita S, Huang M, Nara T, Numakura K, Takayama K, Tsuruta H, Maeno A, Saito M, Inoue T, Tsuchiya N, Satoh S, Habuchi T. The impact of obesity and adiponectin
signaling in patients with renal cell carcinoma: A potential mechanism for the “obesity paradox”. PLoS One. 2017; 12:e0171615.
55. Bagheri M, Speakman JR, Shemirani F, Djafarian K. Renal cell carcinoma survival and body mass index: a dose-response meta-analysis reveals another potential paradox within a paradox. Int J Obes. 2016; 40:1817–22.
56. Bao C, Yang X, Xu W, Luo H, Xu Z, Su C, Qi X. Diabetes mellitus and incidence and mortality of kidney cancer: a meta-analysis. J Diabetes Complications. 2013; 27:357–64.


![High spin [Fe(TTP)(THF)2]](data:image/gif;base64,R0lGODlhAQABAIAAAP///wAAACH5BAEAAAAALAAAAAABAAEAAAICRAEAOw==)