Regulation of the interferon-gamma (IFN-γ) pathway by p63
and Δ133p53 isoform in different breast cancer subtypes
Sunali Y. Mehta1,2, Brianna C. Morten4, Jisha Antony1,2, Luke Henderson1, Annette Lasham2,3, Hamish Campbell5, Heather Cunliffe1, Julia A. Horsfield1,2, Roger R. Reddel5, Kelly A. Avery-Kiejda4, Cristin G. Print2,3,* and Antony W. Braithwaite1,2,5,* 1Pathology Department, University of Otago, Dunedin, New Zealand
2Maurice Wilkins Centre for Molecular Biodiscovery, University of Auckland, Auckland, New Zealand 3Department of Molecular Medicine and Pathology, University of Auckland, Auckland, New Zealand
4Priority Research Centre for Cancer Research, Innovation and Translation, School of Biomedical Sciences and Pharmacy,
Faculty of Health and Medicine, The University of Newcastle, Calvary Mater Hospital, Waratah NSW, Australia
5Children’s Medical Research Institute, The University of Sydney, Westmead, NSW, Australia *These authors have contributed equally to the work
Correspondence to: Antony W. Braithwaite, email: antony.braithwaite@otago.ac.nz Keywords: TP53; TP63; isoforms; immune response; breast cancer
Received: May 22, 2018 Accepted: May 31, 2018 Published: June 26, 2018
Copyright: Mehta et al. This is an open-access article distributed under the terms of the Creative Commons Attribution License 3.0 (CC BY 3.0), which permits unrestricted use, distribution, and reproduction in any medium, provided the original author and source are credited.
ABSTRACT
The TP53 family consists of three sets of transcription factor genes, TP53, TP63 and TP73, each of which expresses multiple RNA variants and protein isoforms. Of these, TP53 is mutated in 25-30% of breast cancers. How TP53 mutations affect the interaction of TP53 family members and their isoforms in breast cancer is unknown. To investigate this, 3 independent breast cancer cohorts were stratified into 4 groups based on oestrogen receptor (ER) and TP53 mutation status. Using bioinformatic methodologies, principal signalling pathways associated with the expression of TP53 family members were identified. Results show an enrichment of IFN-γ signalling associated with TP63 RNA in wild type TP53 (wtTP53), ER negative (ER-) tumours and with Δ133TP53 RNA in mutant TP53 (mTP53) ER positive (ER+) tumours. Moreover, tumours with low IFN-γ signalling were associated with significantly poorer patient outcome. The predicted changes in expression of a subset of RNAs involved in IFN-γ signalling were confirmed in vitro. Our data show that different members of the TP53 family can drive transcription of genes involved in IFN-γ signalling in different breast cancer subgroups.
INTRODUCTION
The TP53 family consists of three sets of transcription factors TP53, TP63 and TP73, which are involved in cell development, homeostasis and response to stress (reviewed in [1]). TP53 plays a central role in maintaining the integrity of the genome, therefore it is not surprising that TP53 is frequently mutated in most human cancers [2, 3]. Unlike TP53, mutations are uncommon in TP63, but it is overexpressed in a subset of basal cell and squamous cell carcinomas of the head and neck, due
to chromosomal amplification, and elevated levels of TP63 RNA have been reported in a number of different tumour types (reviewed in [4]). Similarly, mutations are uncommon in TP73 but it is overexpressed in high grade breast cancers [5]. All three genes use alternative promoters and RNA splicing resulting in expression of multiple RNA variants and protein isoforms [1, 6]. This results in a complex array of isoforms encoding proteins containing an intact N-terminal transactivation domain that are capable of activating p53 target genes (TAp53, TAp63 and TAp73) [1, 6] and N-terminally truncated www.oncotarget.com Oncotarget, 2018, Vol. 9, (No. 49), pp: 29146-29161
proteins including ΔNp53, ΔNp63, ΔNp73 that may serve as antagonists of their TA counterparts [1, 6]. To add to the complexity, all three family members encode C-terminal variants [1, 6].
Clinically, breast cancers are categorised into three groups including oestrogen receptor positive (ER+), HER2 amplified, and Triple Negatives (TNBC, lacking expression of ER, progesterone receptor (PR) and HER2) [7]. Around 25-30% of breast cancers harbour a somatic mutation in the TP53 gene [8]. Prevalence of TP53 mutations is subtype dependent and are more frequent in TNBCs compared to other subtypes [7, 9]. In general, breast cancers with TP53 mutations are known to have a poor clinical outcome [7, 9]. In addition to mutations, expression of TP53 isoforms and other family members have been associated with poor patient outcome. Examples include: (1) elevated levels of Δ40TP53 RNA in TNBCs [10]; (2) elevated levels of Δ133TP53 RNA in other breast cancers [11]; and (3) elevated ΔNTP63 RNA levels in high risk breast cancers [12]. Additionally it has been shown that Δ133p53 promotes invasion of breast cancer cell lines [11] and ΔNp63 promotes a cancer stem-like cell in TNBCs [12]. Conversely TAp63 suppresses metastasis in breast cancer [13] and loss of TAp73 or upregulation of ΔNp73 has been associated with increased angiogenesis in breast cancer [14]. This complex transcriptional pattern and potential interplay among TP53 family members makes translating TP53 mutation status into clinical utility difficult.
In this paper we investigated associations between TP53 mutations, TP53 isoform expression and gene expression of other family members in 3 breast cancer cohorts using bioinformatics. Analyses of the data show that interferon-gamma (IFN-γ) signalling is associated with TP63 RNA expression in ER negative (ER-) tumours without TP53 mutations and with expression of Δ133TP53 isoform in ER+ tumours with TP53 mutations. These results suggest that TAp63 regulates IFN-γ signalling in ER- wtTP53 tumours and that Δ133p53 regulates this pathway in ER+ mTP53 tumours. This prediction was confirmed by in vitro experiments. Thus, TAp63 and Δ133p53 can carry out similar functions in different breast cancer subtypes depending on TP53 and ER status. Our analyses also demonstrate that low expression of interferon-gamma (IFN-γ) signalling is associated with poor patient outcome independent of subtype.
RESULTS
TP53 RNA expression associates with the
regulation of cell proliferation and immune response processes only in ER- wtTP53 breast cancers
Three breast cancer cohorts were analysed for TP53 mutation frequency, type and distribution. TP53 was mutated in 24% (n=421) of the invasive breast cancer
cohort from The Cancer Genome Atlas (TCGA), 23% (n=251) from GSE3494 and 36% (n=61) from GSE61725 (Supplementary Figure 1A). Missense mutations were most common across the 3 cohorts (50 – 64%), followed by frameshift mutations (14 – 27%) and nonsense mutations (12 – 32%) respectively. The cohorts were further divided into ER+ and ER- groups. Consistent with previous reports [7, 9], TP53 mutations were significantly more frequent in ER- tumours (P < 0.05, chi-square test), (Supplementary Figure 1A-1B). The majority of the missense mutations were clustered in the DNA binding domain (DBD, codons 95-289, Supplementary Figure 1C) whereas the frameshift and nonsense mutations tended to be scattered throughout the coding sequence [15] (Supplementary Figure 1C). These 3 cohorts were selected for further analyses as they are representative of frequency, type and distribution of TP53 mutations generally found in breast cancer.
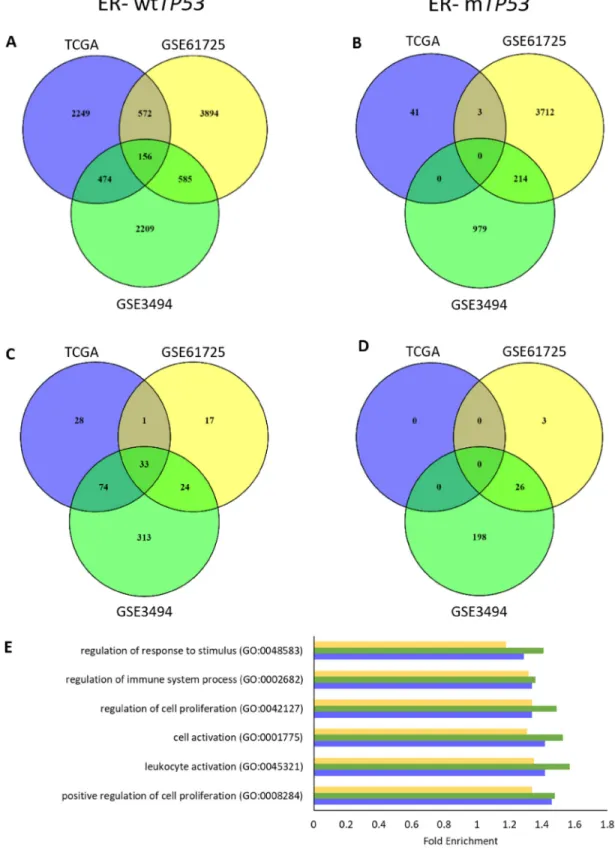
To determine if expression of specific gene sets varied with TP53 gene expression, each cohort was divided into 4 subgroups, based on ER status and TP53 mutation: ER+ wtTP53, ER+ mTP53, ER- wtTP53 and ER- mTP53. RNAs associated with TP53 RNA expression in each of the subgroups across the three cohorts were determined using Spearman’s correlation (ρ = ± 0.4). In ER- wtTP53 tumours, there was an overlap of 156 RNAs associated with wtTP53 (Figure 1A). However, there were essentially no common RNAs associated with TP53 in any of the other subgroups (Figure 1B, Supplementary Figure 2A and 2B). Lack of common RNAs associated with TP53 RNA expression in these subgroups was not due to lack of variation or low RNA expression of TP53 (Supplementary Figures 3 and 4).
To identify gene ontology (GO) in the RNAs associated with TP53 RNA expression, a statistical overrepresentation test using PANTHER [16] was performed. Results showed that there were 33 common GO biological processes associated with TP53 RNA expression in ER- wtTP53 tumours (Figure 1C). Of these, the top 5 are involved in the regulation of cell proliferation and immune system processes (Figure 1E and Supplementary Table 2). On the other hand, there were no common GO biological processes associated with TP53 RNA expression in the other subgroups (Figure 1D and Supplementary Figure 2C and 2D).
TP53 transcript level variation cannot account
for loss of geneset association in mutant TP53 breast tumours
Mutations in TP53 can affect gene transcription and transcript stability, which could explain the lack of common GO biological processes associated with TP53 RNA expression in mTP53 tumours. To test this, the tumours were divided into 4 groups based on TP53 mutation status. The amount of TP53 RNA in each of the 4 groups was quantitated. TP53 RNA expression in
Figure 1: TP53 RNA expression associates with cell proliferation and immune response in ER- wtTP53 tumours.
(A-B) Number of overlapping RNAs associated (ρ = ± 0.4) with TP53 RNA expression in the 3 cohorts (TCGA, GSE61725 and GSE3494).
(A) ER- wtTP53 (TCGA – n = 24, GSE61275 – n = 11 and GSE3494 – n = 15). (B) ER- mTP53 (TCGA – n = 51, GSE61275 – n = 14 and GSE3494 – n = 19). (C-D) Number of overlapping over-represented GO biological processes associated with TP53 RNA expression (Bonferroni corrected P<0.05) in the 3 cohorts (TCGA, GSE61725 and GSE3494). (C) ER- wtTP53. (D) ER- mTP53. (E) List of Top 5 enriched common GO biological processes associated with TP53 RNA expression in ER- wtTP53 tumours between the three cohorts.
the GSE61725 cohort was combined for tumours with FS and nonsense mutations due to limited numbers (FS tumours = 3). Results showed that tumours with missense mutations had increased levels of TP53 RNA (P < 0.05, two-sided Kolmogorov-Smirnov test) (Figures 2A – 2C) whereas tumours with nonsense mutations had noticeably decreased levels of TP53 RNA (Figure 2). Tumours with FS mutations also had substantially decreased levels of TP53 RNA in the TCGA and GSE61725 cohorts and a similar trend was observed in the GSE3494 cohort (Figure 2). Reduction in TP53 RNA expression in the presence of nonsense or FS mutations in TP53 may be explained by nonsense mediated decay [17]. Thus, loss of expression of mTP53 RNA cannot account for the loss of association of the GO biological processes except in cases of tumours with FS or nonsense mutations.
Overlap in GO biological processes associated with wtTP53 RNA expression in ER- wtTP53 and ER- tumours with frameshift and nonsense mutations
To explain the loss of association of the GO biological processes with TP53 RNA expression in the presence of missense TP53 mutations, 2 other possibilities were considered: (1) the GO biological processes are directly associated with TP53 RNA expression (i.e. driven by wtp53), which is lost when TP53 is mutated or (2) they are indirectly associated with TP53 (i.e. driven by something else) but blocked by a ‘gain-of-function’ (GOF) activity of mp53. To test which of these hypotheses better explains the data, we took advantage of the loss of TP53 RNA levels in tumours with FS and nonsense (fsn) mutations from the large TCGA cohort. For the purpose of the analysis we consider these fsn mutations to be “functionally” null. Spearman’s correlation (ρ = ± 0.4) followed by a statistical overrepresentation test [16] was performed and GO biological processes were compared from tumours with wtTP53, mTP53 and fsnTP53. Results showed that there was an overlap of 37 GO biological processes between ER- wtTP53 and ER- fsnTP53 tumours, again involved mainly in regulation of cell proliferation and immune system processes (Supplementary Figure 5 and Supplementary Table 3), but there were no common GO processes in the ER- mTP53 subgroups (Supplementary Figure 5). These results suggest that the GO biological processes involved in regulation of cell proliferation and immune response are indirectly associated with TP53 RNA expression, but inhibited by GOF missense p53 mutants.
TP63 RNA expression is associated with immune
response processes in ER- wtTP53 tumours One GOF mechanism that has been described is the ability of missense p53 mutants to physically interact
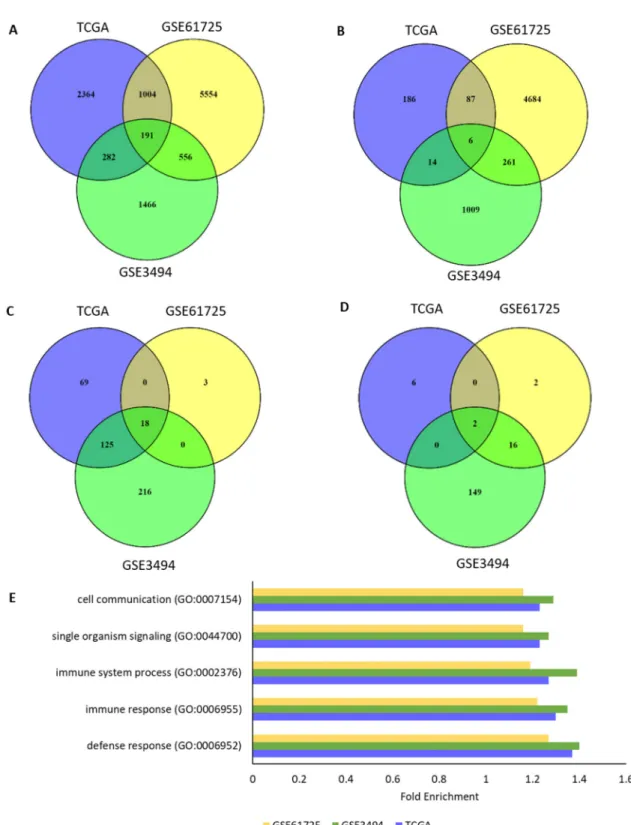
with, and inactivate, TAp63 and TAp73 [18–22]. Thus we investigated whether the genes involved in immune response in the ER- wtTP53 tumours could be driven by TAp63 or TAp73. RNAs associated with TP63 and TP73 RNA expression in the 4 subgroups were determined using Spearman’s correlation (ρ = ± 0.4). In the ER- wtTP53 tumours, there were 191 common genes (Figure 3A) and 18 over-represented GO biological processes (Figure 3B, Supplementary Table 4) associated with TP63 RNA expression, but this association was not observed in the other subgroups (Figures 3B and 3D, Supplementary Figure 6). The top 5 over-represented GO biological processes are associated with immune system processes (Figure 3E, Supplementary Table 4) including the interferon-gamma (IFN-γ) mediated signalling pathway and cell communication (Supplementary Table 5). In the ER- mTP53 tumours there were only 6 common RNAs associated with TP63 RNA (Figure 4B) and these were not representative of immune gene sets (Figure 3D). Lack of common genes across the 3 subsets was not due to lack of variation or low expression of TP63 RNA (Supplementary Figure 7). There were no common GO biological processes associated with TP73 RNA expression in all the 4 subgroups (Supplementary Figures 8 and 9) which is likely due to low levels of TP73 RNA in the GSE3494 cohort (Supplementary Figure 10). Taken together, these results suggest that in ER- wtTP53 tumours, TP63 is associated with IFN-γ signalling, which is lost in tumours with mTP53.
Δ133TP53 RNA is inversely correlated with the
RNA expression of TP63 and its associated genes in ER- wtTP53 tumours
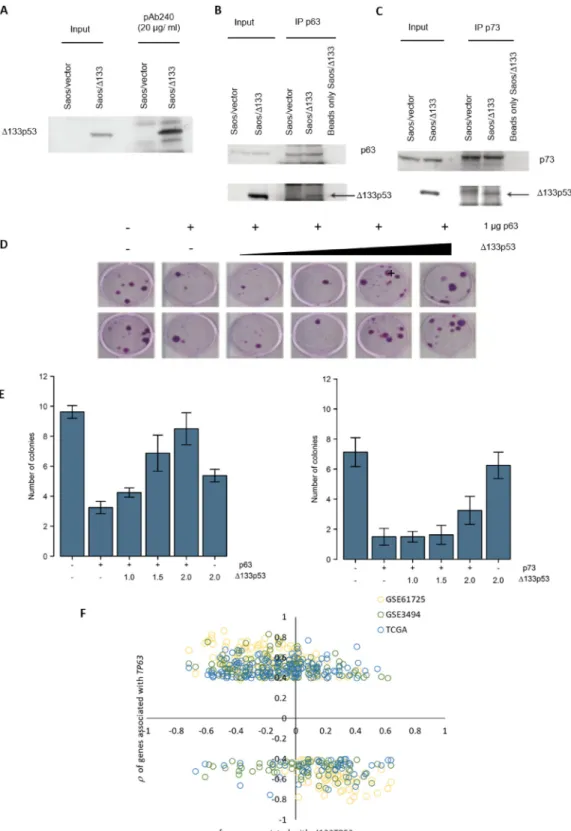
As well as mutant p53, several p53 isoforms are associated with cancer progression, particularly Δ133p53 which promotes proliferation, invasion, angiogenesis, and induces inflammatory gene transcription, including genes involved in IFN-γ signalling [23–25]. Thus, it seems possible that Δ133p53 might behave like missense p53 mutants. In support of this, Δ133p53 was immunoprecipitated with the conformation specific antibody pAb240, indicating that Δ133p53 has a mutant-like conformation (Figure 4A) and in co-immunoprecipitation experiments Δ133p53 was found in complex with TAp63 and TAp73 (Figure 4B - 4C). To test whether Δ133p53 inhibits TAp63 and TAp73 functions, colony forming assays were done. TP53 null H1299 cells were transfected with TAp63 or TAp73 along with a plasmid conferring resistance to the G418 antibiotic and increasing amounts of a Δ133p53 expression plasmid. Cells were incubated in the presence of G418 and the number of surviving colonies counted. Results showed that TAp63 and TAp73 repressed colony formation by approximately 3 fold compared to the control (Figure 4D-4E), which
is rescued by co-expression of Δ133p53. These results suggest that, like missense mutant p53, Δ133p53 can inhibit TAp63 and TAp73 functions. Thus, in some contexts, Δ133TP53 may inhibit TAp63 activity and therefore its expression might be negatively correlated with TAp63 regulated transcripts (e.g. those in the IFN-γ signalling pathway).
To investigate this, we combined Δ133TP53 RNA expression determined by RT-qPCR with gene expression from microarray data for the tumours in GSE61725. This analysis was limited to the tumours in the GSE61725 cohort, since RNA-seq is unable to detect expression of individual TP53 RNA variants [26] (TCGA cohort) and the Affymetrix U133 A and B microarrays do not have probe-sets in the region unique to Δ133TP53 (GSE3494) [26]. Consistent with the hypothesis, results showed that genes positively correlated with TP63 RNA expression in ER- wtTP53 tumours in all 3 cohorts, were negatively correlated with Δ133TP53 RNA expression in GSE61725 (Figure 4F).
Δ133TP53 RNA regulates genes involved
in cytokine mediated signalling in ER+ mTP53 tumours
We next asked whether expression of Δ133TP53 RNA was associated with immune response genes in any of the other subgroups by carrying out correlation analyses in the GSE61725 cohort. There were 80 GO biological processes associated with Δ133TP53 RNA expression (Supplementary Figure 11A) irrespective of TP53 mutation status. However, there were 18 unique GO biological processes associated with Δ133TP53 RNA expression in ER+ mTP53 tumours (Supplementary Figure 11A). These were involved in the regulation of cell adhesion, cell communication and regulation of immune system processes (Supplementary Table 6). Moreover, there were 69 RNAs common among the three cohorts that were associated with TP63 RNA expression in ER- wtTP53 tumours and Δ133TP53 RNA expression in ER+ mTP53 tumours from GSE61725 (Supplementary Figure
Figure 2: Impact of TP53 mutation on TP53 RNA expression in different breast cancer cohorts. Density plots showing the levels of mean centered TP53 RNA levels in (A) TCGA. (B) GSE3494. (C) GSE61725. The grey line shows the density of the mean centered TP53 RNA levels of all the tumours in individual cohorts. The red line shows the density of the mean centered TP53 RNA levels in breast tumours with either wild type TP53 or missense, frameshift and nonsense mutations, in individual cohorts. Significant shift in the distributions of TP53 RNA levels if P < 0.05 determined using two-sided Kolmogorov-Smirnov test.
Figure 3: TP63 RNA expression associates with regulation of immune response processes in ER- wtTP53 tumours.
(A-B) Number of overlapping RNAs associated (ρ = ± 0.4) with TP63 RNA expression between the 3 cohorts (TCGA, GSE61725 and
GSE3494). (A) ER- wtTP53 (TCGA – n = 24, GSE61275 – n = 11 and GSE3494 – n = 15). (B) ER- mTP53 (TCGA – n = 51, GSE61275 – n = 14 and GSE3494 – n = 19). (C-D) Number of overlapping over-represented GO biological processes associated with TP63 RNA expression (Bonferroni corrected P<0.05) between the 3 cohorts (TCGA, GSE61725 and GSE3494). (C) ER- wtTP53. (D) ER- mTP53. (E) List of Top 5 enriched GO biological processes associated with TP63 RNA expression in ER- wtTP53 tumours.
Figure 4: Δ133p53 inhibits TAp63 and TAp73 and Δ133TP53 RNA expression is inversely correlated with TP63 associated genes in ER- wtTP53 tumours. (A) Δ133p53 was immunoprecipitated with the p53 conformation specific antibody pAb240 and immunoblotted with the same antibody. (B-C) TAp63 and TAp73 were immunoprecipated and immunoblotted with pAB240.
(D) An example of the colony formation assay carried out in H1299 cells, co-transfected with a TAp63 expression construct and increasing
amounts of a Δ133p53 expressing plasmid, along with the CMVNeo plasmid. (E) Quantification of G418 resistant colonies after transfection with TAp63 and Δ133p53 (left graph) and TAp73 and Δ133p53 (right graph). The bars represent the mean and error bars are ± S.D. of 8 biological replicates. (F) Association of the 191 genes associated with TP63 RNA expression in ER- wtTP53 tumours from TCGA, GSE61725 and GSE3494 and with Δ133TP53 RNA expression in ER- wtTP53 tumours from GSE61725.
11B). These 69 RNAs were involved in IFN-γ mediated and cytokine mediated signalling (Supplementary Table 7). These results suggest that in the presence of ER signalling and mutant TP53, Δ133TP53 is involved in positively regulating cytokine mediated signalling, especially the IFN-γ signalling pathway.
Regulation of IFN-γ signalling genes by TP63 or
Δ133TP53 in vitro
Our bioinformatic results suggest that TP63 drives expression of cytokine mediated genes in ER- wtTP53 tumours and Δ133TP53 drives these in ER+ mTP53 tumours. To test this in vitro, we selected 8 genes known to be involved in IFN-γ signalling and which were associated with either the expression of TP63 or Δ133TP53 in the respective subgroups (Supplementary Figure 11B). These include STAT6, GBP2, IRF2, IL6ST, CXCR6, IL13RA1, JAK2 and PIK3R3.
To confirm that oestrogen signalling is important for altering the expression of the selected genes, two cell lines were used, MCF7 that are ER+ wtTP53 and T47D that are ER+ mTP53. The cell lines were transfected with an siRNA to ESR1, RNA collected and RT-qPCR performed. Expression of 4/8 and 5/8 genes (p < 0.05, student’s t-test) significantly increased in MCF7 and T47D cells relative to the control siRNA (Supplementary Figure 12A and 12B). Next, cells were starved of estradiol for 72h, followed by addition of 100 nM β-estradiol, RNA collected 24h later, and RT-qPCR performed. Expression of 7/8 and 5/8 genes were significantly altered (p < 0.05, student’s t-test) in both cell lines (Supplementary Figure 12A and 12B). Furthermore, ESR1 knock down and β-estradiol addition largely showed inverse patterns (Supplementary Figure 12A and 12B). In addition, oestrogen signalling also significantly altered expression of TP63 and Δ133TP53 (Supplementary Figure 12A and 12B).
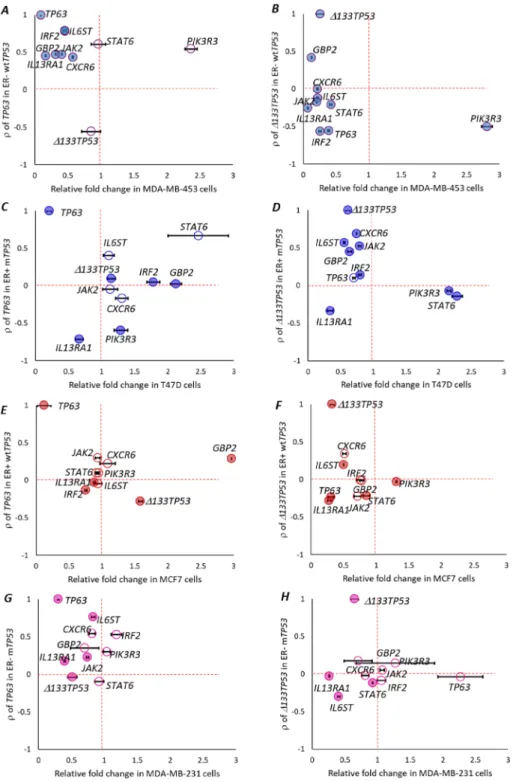
To test if the levels of the 8 selected genes changed by altering the levels of Δ133TP53 or TP63, we transfected MB-453 (ER- wtTP53), MCF7, T47D and MDA-MB-231 (ER- mTP53) cells, with siRNAs targeted to TP63 or Δ133TP53, collected RNA and performed RT-qPCR. In the MDA-MB-453 cells, expression of genes that were positively correlated with TP63 expression in ER- wtTP53 tumours (IL6ST, IRF2, GBP2, JAK2, IL13RA1, CXCR6 – above the horizontal dotted line in Figure 5A) were reduced post TP63 knockdown (left side of the vertical dotted line in Figure 5A, p <0.05, student’s t-test), STAT6 did not change, and PIK3R3 did not follow the predicted trend. Δ133TP53 expression did not change. Thus, 6/8 genes were altered by TP63 knockdown in the MDA-MB-453 cells. Although not predicted from the tumour analyses, knockdown of Δ133TP53 also resulted in reduced expression of 7/8 genes as was TP63 (Figure 5B).
In confirmation of these results, MCF7 cells were starved of estradiol for 72h, to create an ER- wtTP53
environment. These cells were treated 24h post estradiol starvation with siRNAs targeted to TP63 or Δ133TP53 either individually or in combination with siRNA targeted to ESR1. RNA was collected 48h post transfection, and RT-qPCR performed. In the estradiol starved MCF7 cells, in line with our bioinformatic predictions, 6/8 genes were significantly altered upon TP63 knockdown (Supplementary Figure 13A). As predicted, knockdown of Δ133TP53 in the estradiol starved MCF7 cells had much less effect (Supplementary Figure 13B). Similarly, in estradiol starved MCF7 cells, when ESR1 and TP63 were knocked down in combination, the predicted bioinformatic trend was followed, where 6/8 genes were significantly altered (Supplementary Figure 13C). However, knockdown of ESR1 and Δ133TP53 altered expression of all genes, unlike what was observed in the tumour analyses (Supplementary Figure 13D).
In the T47D cells, expression of genes that were positively correlated with Δ133TP53 expression in ER+ mTP53 tumours, 5/8 genes (IL6ST, CXCR6, GBP2, IRF2 and JAK2) were reduced post Δ133TP53 knockdown (Figure 5D), whilst STAT6 and PIK3R3 that were negatively correlated with Δ133TP53 expression in ER+ mTP53 were increased after Δ133TP53 knockdown (Figure 5D). IL13RA1 did not follow the predicted trend and TP63 did not change. By contrast, knockdown of TP63 had no effect on expression of these genes (Figure 5C). Also in line with our bioinformatic predictions, expression of the 8 selected genes was not significantly altered after knockdown of either TP63 or Δ133TP53 in the MCF7 cells (Figure 5E-5F) or in MDA-MB-231 cells (Figure 5G-5H).
Thus in conclusion, the in vitro results mostly support the bioinformatic predictions providing evidence that in ER- wtTP53 tumours, TP63 regulates expression of IFN-γ signalling genes and Δ133TP53 does so in ER+ mTP53 tumours.
Reduced IFN-γ-mediated signalling is associated with poor survival outcome
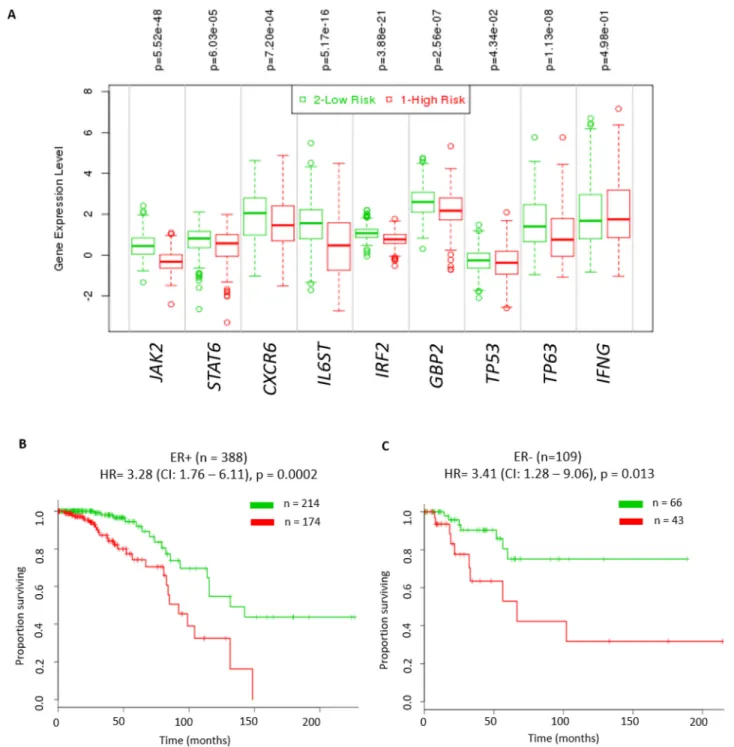
Effective IFN-γ signalling is critical for activation, clonal expansion, memory development and for efficient natural killer (NK)-cell-mediated cytotoxicity [27]. Thus, it is possible that patients with tumours that have reduced IFN-γ signalling are likely to be associated with poor clinical outcome. In order to test the prognostic value of IFN-γ mediated signalling, we performed survival analyses using RNA expression data for IFNG, TP63, TP53 independently and in combination with the 6 validated genes (JAK2, STAT6, CXCR6, IL6ST, IRF2, and GBP2). These analyses were performed using the Breast Invasive Carcinoma TCGA cohort in the SurvExpress database [28] since this dataset had the largest number of tumours (n = 502). Initially we assessed if expression of IFNG alone or in combination with expression of TP53
Figure 5: TP63 or Δ133TP53 regulates IFN-γ signalling in vitro. Relative fold change in the expression of candidate IFN-γ signaling pathway genes, TP63 and Δ133TP53, 48h post treatment with siRNA targeting either TP63 or Δ133TP53 in (A-B) MDA-MB-453 cells that are ER- wtTP53. (C-D) T47D cells that are ER+ mTP53. (E-F) MCF7 cells that are ER+ wtTP53. (G-H) MDA-MB-231 cells that are ER- mTP53. A-H. (A) Relative fold change after si-TP63 treatment in MDA-MB-453 cells. (B) Relative fold change after si-Δ133TP53 treatment in MDA-MB-453 cells. (C) Relative fold change after si-TP63 treatment in T47D cells. (D) Relative fold change after si-Δ133TP53 treatment in T47D cells. (E) Relative fold change after si-TP63 treatment in MCF7 cells. (F) Relative fold change after si-Δ133TP53 treatment in MCF7 cells. (G) Relative fold change after si-TP63 treatment in MDA-MB-231 cells. (H) Relative fold change after si-Δ133TP53 treatment in MDA-MB-231 cells. (A-H) Association of RNA expression of candidate IFN-γ signaling pathway genes on the y-axis and relative fold change 72h post transfection on the x-axis. Genes with positive correlation are above the horizontal dotted line and those that are negatively correlated are below the horizontal dotted line. Genes that are upregulated relative to the si-Ctrl are to the right of the vertical dotted line and downregulated genes are to the left of the vertical dotted line. Genes that are changed significantly are represented with filled colored circles, ● = significant, ○ = not significant (student’s t-test, p < 0.05). Levels were measured in three biological replicates for each treatment.
and TP63 was able to identify patients with poor outcome. We found that despite there being significantly lower log2 RNA expression of IFNG and TP63 and higher log2 RNA expression of TP53 (P ≤0.05) in the high risk group, these molecules did not have prognostic value in either ER+ or ER- tumours (Supplementary Figure 14). Next,
we assessed the ability of these 3 genes in combination with the 6 genes above to identify patients with poor outcome. Irrespective of the ER status, tumours in the high-risk group had significantly lower expression levels of JAK2, CXCR6, STAT6, IL6ST, IRF2, GBP2, TP53 and TP63 (P ≤0.05, Figure 6A). Moreover, the results showed
Figure 6: Significant prognostic value of IFN-γ mediated signalling in breast cancer patients. Kaplan – Meier plot of high risk versus low risk tumours stratified by expression of IFN-γ, TP63, TP53 and in combination with the 6 candidate genes (JAK2, STAT6,
CXCR6, IL6ST, IRF2, and GBP2) representative of IFN-γ signalling from the TCGA cohort. (A) Log2RNA expression levels of these 9 genes in high risk and low risk breast tumours from the TCGA cohort using t-test (* - p<0.05 was considered significant). High risk groups were those patients that had reduced disease free survival compared to low risk group patients. (B) ER positive tumours (hazard ratio (HR) = 3.28 (CI: 1.76 – 6.11), p = 0.0002). (C) ER negative tumours (hazard ratio (HR) = 3.41 (CI: 1.28 – 9.06), p = 0.013). All analyses were done using SurvExpress web resource [28].
this 9 RNA classifier has a significant prognostic value for both ER+ (hazard ratio (HR) = 3.28 (CI: 1.76 – 6.11), p = 0.0002, Figure 6B) and ER- tumours (hazard ratio (HR) = 3.41 (CI: 1.28 – 9.06), p = 0.013, Figure 6C). We also found this 9 RNA classifer to have significant prognostic value for both ER+ (HR = 1.75 (CI: 1.44 – 2.13), p = 2.15E-08) and ER- tumours (HR = 2.04 (CI: 1.33 – 3.12), p = 0.001) in the Breast Cancer Meta-base: 10 cohorts 22K gene data on 1888 samples from the SurvExpress database [28]. These results suggest that IFN-γ signalling plays an important role in breast tumour prognosis.
DISCUSSION
In this paper we investigated interactions between TP53 mutation, expression of TP53 isoforms and family members (TP63 and TP73) in breast cancer. To do this,
initially we used bioinformatic analyses that combined ER status, TP53 mutation and RNA expression data from 3 breast cancer cohorts (TCGA, GSE3494 and GSE61725). Our results showed marked differences in signalling pathways depending on ER and TP53 status. In ER- wtTP53 tumours, TP53 RNA expression was associated with cell proliferation and immune response genesets. The association was also observed with TP53 RNA expression in the presence of frameshift and nonsense mutations (ie effectively a p53 null environment), but was lost in the presence of GOF TP53 missense mutants. These data suggest that something other than wild type p53 is regulating these signalling pathways. One possibility we considered is the p53 family members, TAp63 and/or TAp73, as both can function as transcription factors and missense p53 mutants inactivate TAp63 and TAp73 by direct protein interaction [18, 20–22]. This is supported
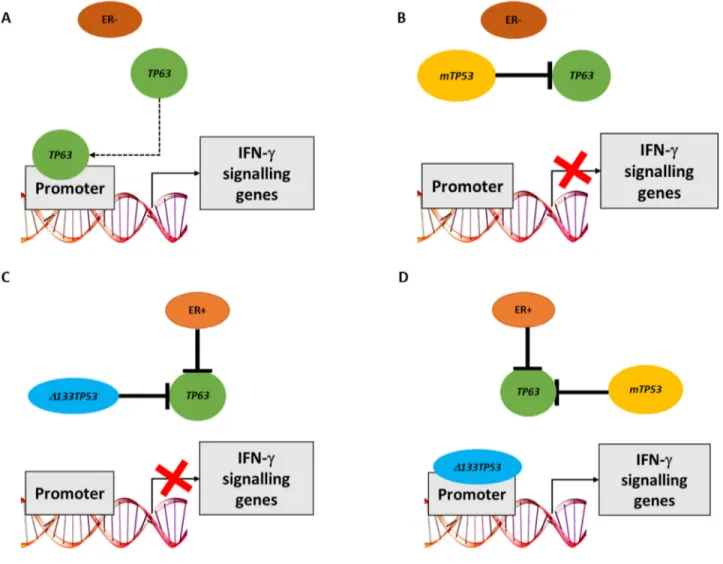
Figure 7: Model of how either TP63 or Δ133TP53 may regulate expression of IFN-γ signalling genes in different breast cancer subsets. (A) In the absence of ER signalling and wtTP53, TAp63 can bind the promoter of genes involved in IFN-γ signalling.
(B) In the absence of ER signalling and presence of mTP53, TAp63 is blocked by mp53 and hence cannot bind gene promoters. (C) In the
presence of ER signalling and wtTP53, TAp63 transcriptional activity is blocked by binding Δ133p53. (D) In the presence of ER signalling and mTP53, mp53 can bind and inhibit TAp63. Mp53 however can no longer bind to gene promoters, thus allowing Δ133p53 to access the promoter and turn on the expression of these genes.
by our findings, where the immune response genesets are associated with TP63 RNA expression in ER- wtTP53 tumours, but not in the presence of mTP53. No association was observed with TP73 RNA due to low expression in the tumours. Interestingly, the dominant transcriptional signature associated with TP63 RNA expression in ER- wtTP53 tumours was IFN-γ mediated signalling. Consistent with the bioinformatic predictions knocking down TP63 in MDA-MB-453 (ER- wtTP53) cells and in MCF7 cells starved of estradiol (mimic of ER- wtTP53) significantly altered the expression of the candidate genes representing IFN-γ signalling but failed to alter the expression of these genes in non-starved MCF7 cells that are ER+ wtTP53, T47D cells that are ER+ mTP53 or in MDA-MB-231 cells that are ER- mTP53. Taken together, these results suggest that TAp63 directly regulates expression of genes in the IFN-γ pathway in the ER- wtTP53 tumour subtype (Figure 7A) but not in subtypes with mTP53 where TAp63 is (presumably) inactivated by complexing with mp53 (Figure 7B and 7D). A limitation of this study is an inability to distinguish between the expression of TA-TP63 or ΔN-TP63 using current methodologies [26]. Thus, the transcriptional driver of IFN-γ signalling could be any of the TP63 isoform family.
In contrast, in ER+ mTP53 tumours the Δ133TP53 isoform is positively associated with IFN-γ signalling suggesting that Δ133p53 is regulating expression of these genes. This was confirmed in vitro where an siRNA to Δ133TP53 altered expression of 7/8 genes that correlated with Δ133TP53 RNA in an ER+ mTP53 cell line (T47D), but not ER+ wtTP53 (MCF7) or ER- mTP53 (MDA-MB-231) cell lines. In contrast to the bioinformatic predictions of the tumour analyses, in ER- wtTP53 cell lines (MDA-MB-453 and MCF7 cells starved of estradiol and targeted with si-ESR1) knockdown of Δ133TP53 resulted in reduced expression of IFN-γ signalling genes. This could be due to Δ133p53 binding to TAp63 and inhibiting it's activity as we showed in Figure 4, but as a consequence of being sequestered in this manner, there is insufficient Δ133p53 to drive transcription in ER+ wtTP53 and ER- wtTP53 tumours (Figure 7C). However, in the ER+ mTP53 tumours, mp53 blocks TAp63 activity freeing up Δ133p53 to drive transcription (Figure 7D). This raises the paradox of how Δ133p53 can transactivate genes when it would also harbour mutations, and it is known that DNA binding domain mutants of Δ133p53 are defective for transactivation [29]. A possible explanation is that as the mutations in this tumour set are all heterozygous, there is one wild type Δ133TP53 in each tumour encoding a functional, transactivation competent Δ133p53 protein.
Our results show that transcriptional upregulation of IFN-γ pathway genes is accomplished in different tumour subtypes by a distinct mechanism - either by TAp63 or Δ133p53 - with ER and TP53 status determining which mechanism is utilized. Of significance, our data show that patients with reduced IFN-γ signalling have a shorter
progression free survival. But of importance from a clinical perspective, it may be appropriate to treat these different tumour subtypes (ER- wtTP53 and ER+ mTP53) with the same therapeutic strategy using for example, IFN-γ directly, or with an agonist of the pathway.
MATERIALS AND METHODS
Patient cohorts
Three breast cancer cohorts were used for this study. These include the Invasive Breast Cancer cohort from The Cancer Genome Atlas (TCGA), GSE3494 and GSE61725. ER status was reported based on immunohistochemistry staining and was used to stratify the tumours in ER+ and ER- groups for all three cohorts. The provisional TCGA cohort was accessed using cBioPortal for clinico-pathological data [30, 31]. Of the 1000 breast cancer patients, there was unambiguous data on the ER status determined by IHC for 421 tumours which were used for this analyses. TP53 mutation data and Spearman’s correlation data was also accessed using cBioPortal [30, 31] for these 421 tumours. Data used for further analyses was downloaded in December 2016.
For the GSE3494 cohort, normalized gene expression data from Affymetrix U133 A and B arrays, TP53 mutation status and the clinical data for 215 primary breast tumours was downloaded from the gene expression omnibus (GEO) database [32]. This microarray study was approved by the ethical committee at the Karolinska Institute, Stockholm, Sweden [33].
For the GSE61725 cohort, normalized gene expression data from Affymetrix HumanGene 1.0 ST arrays, TP53 mutation status and the clinical data for 64 invasive ductal carcinomas was downloaded from the GEO database [32]. In this cohort there were 8 tumours that were ER+ and had mutations in TP53. These tumours were heterozygous for TP53 mutations. The mutations observed in these tumours were: 742C>T - R248W, 991C>T - Q331X, 615T>A - Y205X, 602T>A - L201X, 903_904 - insC, 659A>G - Y220C, 824G>A - C275Y and 1024C>T - R342X. This study complies with the Helsinki Declaration with ethical approval from the Hunter New England Human Research Ethics Committee (approval number: 09/05/20/5.02). All patients have consented to their tissue and clinical information being used in this study [10]. Cell culture
MCF7 and MDA-MB-231 cells (American Type Culture Collection, ATCC) were cultured in Phenol free Dulbecco's Modified Eagle Medium (DMEM, Life Technologies or Sigma) supplemented with 10% fetal bovine serum (FBS) in a 37 °C humidified incubator at 5% CO2. T47D cells (ATCC) were cultured in Phenol free RPMI-1640 media containing insulin (5 μg/ml) and 10%
FBS in a 37 °C incubator at 10% CO2. MDA-MB-453 cells were cultured in Leibovitz L-15 media containing 10% FBS, 1% GlutaMax in a 37 °C incubator at 10% CO2. The SaOS2 and H1299 cells were obtained from Cell Bank Australia and were maintained in DMEM supplemented with 10% FBS in a humidified incubator at 5% CO2 and 37°C. For hormone depletion, cells were cultured for 3 days in phenol-free media supplemented with 10% charcoal dextran (Sigma)-treated FBS. Hormone-depleted cells were treated with 17-β-estradiol (Sigma) at a final concentration of 100 nM for 24 hours. All cell lines were validated for authenticity by CellBank Australia using STR profiling (http://www.cellbankaustralia.com). siRNA transfection
Cells were reverse transfected with stealth modified 25bp duplex siRNAs targeted to TP63 (HSS112631), Δ133TP53 (5′-UGUUCACUUGUGC CCUGACUUUCAA-3′) [34] and ESR1 (HSS103377) [35] and a scrambled control siRNA (si-Ctrl 5’ - CCACACGAGUCUUACCAAGUUGCUU-3′) [36] from Invitrogen. The control siRNA has no known human mRNA targets and has been used in previous studies as a control [36]. Stealth siRNAs were transfected at a final concentration of 10 nM using Lipofectamine RNAiMax (Invitrogen). Both siRNAs and RNAiMax were diluted in medium without serum. After 10 minutes at room temperature, the diluted RNAiMax was added to the siRNAs, and the mixture was incubated for a further 15 minutes. The lipoplexes formed were added to cells. After overnight transfection, the culture medium was replaced with phenol-free media supplemented with 10% FBS until the cells were harvested at 72h. All transfections were performed in triplicate.
Co-immunoprecipitation
Co-immunoprecipitation experiments were carried out using either SaOS2 cells stably expressing Δ133p53 (SaOS2/Δ133) [24] or the vector control (SaOs2/vector) cells. Cells were grown to 80% confluence, before being lysed in non-denaturing conditions. An agarose conjugated pAb240 antibody was added to the lysate and incubated for 1 h at 4°C, and the immunoprecipitates were collected using a microspin column. After electrophoresis on 10% SDS-PAGE and transfer, Δ133p53 was detected with the same antibody. To determine whether Δ133p53 interacted with TAp63 or TAp73, the lysates were incubated with either p63 (4A4, Abcam) or p73 (E-4, Santa Cruz) agarose conjugated antibodies, immunoprecipitated as above and immunoblotted with pAb240 (Santa Cruz).
Colony forming assays
H1299 cells were co-transfected with expression plasmids for TAp63 or TAp73, along with increasing
concentrations of a Δ133p53 plasmid, and a plasmid expressing the G418 antibiotic resistance marker (1/10th of the total amount of DNA) using FuGENE6 (Promega, USA). Twenty four hours post transfection cells were trypsinised and seeded into 12 well plates at low density and after 24h of further incubation, 1 mg/ml G418 was added to the media and the cells were cultivated for 10 days. Surviving colonies were then stained with 3% crystal violet and counted.
RNA extraction, cDNA synthesis and reverse transcriptase – quantitative PCR (RT-qPCR)
Total RNA was isolated using either the Nucleospin RNA Isolation kit (Machery Nagel) or the RNeasy Mini Kit (Qiagen). For tumour samples, the expression of the Δ133TP53 was determined by reverse-transcribing 660 ng of total RNA into first strand cDNA using the High Capacity cDNA Reverse Transcription Kit (Life Technologies). Real-time PCR analysis was performed in triplicate using TaqMan® Universal PCR mix (Life Technologies) on 20 ng (tumour samples) of cDNA, with results quantified on a 7500 real-time PCR system (Life Technologies). Reference assays used included the Taqman Gene Expression Assays for β-actin (Human ACTB Endogenous Control, assay ID: Hs99999903_m1) and β2-microglobulin (assay ID: Hs99999907_m1). The primer/probes have been previously reported [10].
For cell line experiments 0.5 μg of total RNA was reverse-transcribed into first strand cDNA using the Superscript III first strand synthesis system (Life Technologies) or qScript cDNA SuperMix (Quanta Biosciences). RT-qPCR was performed as follows: 100 ng of cDNA was added to 10 μl of SYBR Premix Ex Taq II (Ti RNase H Plus) (Takara Bio) and 200 nM of each primer, in a final volume of 20 μl; the PCR product was run on the Roche LightCycler® 480 (Roche); and RT-qPCR was performed for each sample with each primer pair in triplicate. Primer sequences for each primer pair has been provided in Supplementary Table 1. Reference genes used were human ACTB and GAPDH. Relative transcript abundance from RT-qPCR was calculated using the equation:
Amplification Efficiency^ −(geometric mean reference gene Threshold Ct−gene Threshold Ct) Correlation and survival analyses
Breast tumours from each cohort were divided into 4 subgroups based on ER status and TP53 mutations: ER+ wild type (wt)TP53, ER+ mutant(m)TP53, ER- wtTP53 and ER- mTP53. Spearman’s correlation analysis was then performed to identify the RNAs associated with TP53 (201746_at – GSE3494; 8012257 – GSE61725), TP63 (207382_at – GSE3494; 8084766 – GSE61725) and TP73 (220804_s_at – GSE3494; 7897179 – GSE61725) RNA expression using the cor.test() function in R with the
method set to “spearman” [37], unless specified otherwise. Correlation coefficient cutoff of ± 0.4 in each of the subgroups was used for gene set enrichment analyses. To overcome the difference in the number of genes that passed this cut off in the three cohorts, we took an intersection of the results between these cohorts, each assayed using different methods. Enrichment of gene sets within the input list was determined using the overrepresentation test with default settings and Bonferroni correction in the PANTHER database [16]. The number of overlapping genes between the three cohorts was determined using Venny, an online tool used to draw Venn diagrams [38].
RNA-sequencing analyses of 502 breast cancer patients from the TCGA cohort were collected from the SurvExpress web resource (http://bioinformatica.mty. itesm.mx/SurvExpress) which includes datasets from GEO [32] and TCGA [28]. Level 3, log2 transformed RNA-seq counts obtained from TCGA were used as RNA expression level of the selected 6 candidate genes representing IFN-γ signalling. 6 RNA candidates that were representative IFN-γ signalling, associated with TP63 or Δ133TP53 RNA expression and validated in vitro (Figure 5) were used to assess clinical outcome along with RNA expression of TP53, TP63 and IFN-γ. These 6 candidates included JAK2, STAT6, IRF2, CXCR6, IL6ST and GBP2. The samples were stratified by ER status and then split into two risk groups of the same size and the prognostic index estimated using the Cox model whereby the beta coefficients were multiplied by gene expression values. Significance in the differences of the RNA expression values across the high and low risk groups was determined using the t-test (P < 0.05 was considered significant). Disease free survival was assessed for each risk group using Cox proportional hazards regression and Kaplan–Meier method. The difference between the risk groups was determined using log-rank test (P < 0.05 was considered significant). Abbreviations
Oestrogen Receptor: ER, Tumour protein p53: TP53, Interferon-gamma: IFN-γ, Oestrogen receptor positive: ER+, Oestrogen receptor negative: ER-, Mutant tumour protein p53: mTP53, Triple negative breast cancer: TNBC, The Cancer Genome Atlas: TCGA, Gene expression omnibus: GEO, Dulbecco's Modified Eagle Medium: DMEM, American Type Culture Collection: ATCC, Reverse transcriptase – quantitative PCR: RT-qPCR, DNA binding domain: DBD, Gene ontology: GO, Wild type: wt, Frameshift: FS, Frameshift and nonsense: fsn, Gain of function: GOF, Natural killer cell: NK cell Author contributions
S.Y. Mehta was involved in the conception and design of this study, acquisition of data, analyses and interpretation of data and writing and reviewing of the
manuscript. B.C. Morten, L. Henderson, were involved in performing experiments and data acquisition and writing and reviewing the manuscript. A. Lasham analysed data. H. Campbell was involved in conception of this study. J. Antony, J.A. Horsfield and H. Cunliffe provided cell lines and material for this study. K. Avery-Kiejda provided samples. K. Avery-Kiejda, J.A. Horsfield, R. R. Reddel, C.G. Print and A.W. Braithwaite are group leaders involved in the project. All authours contributed towards writing and reviewing the manuscript. C.G. Print and A.W. Braithwaite provided supervison for this study.
ACKNOWLEDGMENTS
We are grateful for the support provided by The University of Auckland, New Zealand, University of Otago, New Zealand and Children’s Medical Research Institute, Sydney, Australia. We would also like to thank Michael A Black for critically reading the paper prior to submission.
CONFLICTS OF INTEREST
The authors declare that they have no competing interests.
FUNDING
This work was supported by the Health Research Council of New Zealand awarded to A.W. Braithwaite (#15-500) and J.A Horsfield (#10-873); Maurice Wilkins Centre for Biodiscovery, New Zealand awarded to S.Y. Mehta, C.G. Print and A.W. Braithwaite; Breast Cancer Research Trust, New Zealand awarded to J.A. Horsfield; The Cancer society of New Zealand awarded to J.A. Horsfield; Royal Society of New Zealand (#15-003) awarded to A.W. Braithwaite; Hunter Medical Research Institute through Pink Frangipani Ball and Bloomfield Group Foundation grants awarded to K. Avery-Kiejda, Australia; National Breast Cancer Foundation, Australia awarded to K. Avery-Kiejda; Hunter Translational Cancer Research Unit Fellowship from the Cancer Institute New South Wales Australia awarded to K. Avery-Kiejda; Australian Postgraduate Award and Hunter Medical Research Institute Sawyer Scholarship awarded to B.C. Morten, Australia and Cancer Council New South Wales (Program Grant PG11-08), Australia awarded to R.R.Reddel.
Editorial note
This paper has been accepted based in part on peer-review conducted by another journal and the authors’ response and revisions as well as expedited peer-review in Oncotarget.
REFERENCES
1. Murray-Zmijewski F, Lane DP, Bourdon JC. p53/p63/ p73 isoforms: an orchestra of isoforms to harmonise cell differentiation and response to stress. Cell Death Differ. 2006; 13:962–72. https://doi.org/10.1038/sj.cdd.4401914. 2. Braithwaite AW, Royds JA, Jackson P. The p53 story: layers
of complexity. Carcinogenesis. 2005; 26:1161–69. https:// doi.org/10.1093/carcin/bgi091.
3. Lane DP. Cancer. p53, guardian of the genome. Nature. 1992; 358:15–16. https://doi.org/10.1038/358015a0. 4. Candi E, Agostini M, Melino G, Bernassola F. How
the TP53 family proteins TP63 and TP73 contribute to tumorigenesis: regulators and effectors. Hum Mutat. 2014; 35:702–14. https://doi.org/10.1002/humu.22523.
5. Dominguez G, Silva JM, Silva J, Garcia JM, Sanchez A, Navarro A, Gallego I, Provencio M, España P, Bonilla F. Wild type p73 overexpression and high-grade malignancy in breast cancer. Breast Cancer Res Treat. 2001; 66:183–90. https://doi.org/10.1023/A:1010624717311.
6. Bourdon JC. p53 and its isoforms in cancer. Br J Cancer. 2007; 97:277–82. https://doi.org/10.1038/sj.bjc.6603886. 7. Network CG, and Cancer Genome Atlas Network.
Comprehensive molecular portraits of human breast tumours. Nature. 2012; 490:61–70. https://doi.org/10.1038/ nature11412.
8. Børresen-Dale AL. TP53 and breast cancer. Hum Mutat. 2003; 21:292–300. https://doi.org/10.1002/humu.10174. 9. Olivier M, Langerød A, Carrieri P, Bergh J, Klaar S, Eyfjord
J, Theillet C, Rodriguez C, Lidereau R, Bièche I, Varley J, Bignon Y, Uhrhammer N, et al. The clinical value of somatic TP53 gene mutations in 1,794 patients with breast cancer. Clin Cancer Res. 2006; 12:1157–67. https://doi. org/10.1158/1078-0432.CCR-05-1029.
10. Avery-Kiejda KA, Morten B, Wong-Brown MW, Mathe A, Scott RJ. The relative mRNA expression of p53 isoforms in breast cancer is associated with clinical features and outcome. Carcinogenesis. 2014; 35:586–96. https://doi. org/10.1093/carcin/bgt411.
11. Gadea G, Arsic N, Fernandes K, Diot A, Joruiz SM, Abdallah S, Meuray V, Vinot S, Anguille C, Remenyi J, Khoury MP, Quinlan PR, Purdie CA, et al. TP53 drives invasion through expression of its Δ133p53β variant. eLife. 2016; 5:e14734. https://doi.org/10.7554/eLife.14734. 12. Buckley NE, Conlon SJ, Jirstrom K, Kay EW, Crawford
NT, O’Grady A, Sheehan K, Mc Dade SS, Wang CW, McCance DJ, Johnston PG, Kennedy RD, Harkin DP, Mullan PB. The DeltaNp63 proteins are key allies of BRCA1 in the prevention of basal-like breast cancer. Cancer Res. 2011; 71:1933–44. https://doi.org/10.1158/0008-5472. CAN-10-2717.
13. Su X, Chakravarti D, Cho MS, Liu L, Gi YJ, Lin YL, Leung ML, El-Naggar A, Creighton CJ, Suraokar MB, Wistuba I, Flores ER. TAp63 suppresses metastasis through coordinate
regulation of Dicer and miRNAs. Nature. 2010; 467:986– 90. https://doi.org/10.1038/nature09459.
14. Stantic M, Sakil HA, Zirath H, Fang T, Sanz G, Fernandez-Woodbridge A, Marin A, Susanto E, Mak TW, Arsenian Henriksson M, Wilhelm MT. TAp73 suppresses tumor angiogenesis through repression of proangiogenic cytokines and HIF-1α activity. Proc Natl Acad Sci U S A. 2015; 112:220–25. https://doi.org/10.1073/pnas.1421697112. 15. Silwal-Pandit L, Vollan HK, Chin SF, Rueda OM,
McKinney S, Osako T, Quigley DA, Kristensen VN, Aparicio S, Børresen-Dale AL, Caldas C, Langerød A. TP53 mutation spectrum in breast cancer is subtype specific and has distinct prognostic relevance. Clin Cancer Res. 2014; 20:3569–80. https://doi.org/10.1158/1078-0432. CCR-13-2943.
16. Mi H, Muruganujan A, Casagrande JT, Thomas PD. Large-scale gene function analysis with the PANTHER classification system. Nat Protoc. 2013; 8:1551–66. https:// doi.org/10.1038/nprot.2013.092.
17. Cowen LE, Tang Y. Identification of nonsense-mediated mRNA decay pathway as a critical regulator of p53 isoform β. Sci Rep. 2017; 7:17535. https://doi.org/10.1038/ s41598-017-17283-4.
18. Adorno M, Cordenonsi M, Montagner M, Dupont S, Wong C, Hann B, Solari A, Bobisse S, Rondina MB, Guzzardo V, Parenti AR, Rosato A, Bicciato S, et al. A Mutant-p53/ Smad complex opposes p63 to empower TGFbeta-induced metastasis. Cell. 2009; 137:87–98. https://doi.org/10.1016/j. cell.2009.01.039.
19. Keyes WM, Vogel H, Koster MI, Guo X, Qi Y, Petherbridge KM, Roop DR, Bradley A, Mills AA. p63 heterozygous mutant mice are not prone to spontaneous or chemically induced tumors. Proc Natl Acad Sci U S A. 2006; 103:8435–40. https://doi.org/10.1073/pnas.0602477103. 20. Melino G, De Laurenzi V, Vousden KH. p73: Friend or foe
in tumorigenesis. Nat Rev Cancer. 2002; 2:605–15. https:// doi.org/10.1038/nrc861.
21. Neilsen PM, Noll JE, Suetani RJ, Schulz RB, Al-Ejeh F, Evdokiou A, Lane DP, Callen DF. Mutant p53 uses p63 as a molecular chaperone to alter gene expression and induce a pro-invasive secretome. Oncotarget. 2011; 2:1203–17. https://doi.org/10.18632/oncotarget.382.
22. Li Y, Prives C. Are interactions with p63 and p73 involved in mutant p53 gain of oncogenic function? Oncogene. 2007; 26:2220–25. https://doi.org/10.1038/sj.onc.1210311. 23. Campbell H, Fleming N, Roth I, Mehta S, Wiles A,
Williams G, Vennin C, Arsic N, Parkin A, Pajic M, Munro F, McNoe L, Black M, et al. ∆133p53 isoform promotes tumour invasion and metastasis via interleukin-6 activation of JAK-STAT and RhoA-ROCK signalling. Nat Commun. 2018; 9:254. https://doi.org/10.1038/s41467-017-02408-0. 24. Roth I, Campbell H, Rubio C, Vennin C, Wilson M,
Wiles A, Williams G, Woolley A, Timpson P, Berridge MV, Fleming N, Baird M, Braithwaite AW. The Δ133p53
isoform and its mouse analogue Δ122p53 promote invasion and metastasis involving pro-inflammatory molecules interleukin-6 and CCL2. Oncogene. 2016; 35:4981–89. https://doi.org/10.1038/onc.2016.45.
25. Slatter TL, Hung N, Campbell H, Rubio C, Mehta R, Renshaw P, Williams G, Wilson M, Engelmann A, Jeffs A, Royds JA, Baird MA, Braithwaite AW. Hyperproliferation, cancer, and inflammation in mice expressing a Δ133p53-like isoform. Blood. 2011; 117:5166–77. https://doi. org/10.1182/blood-2010-11-321851.
26. Mehta S, Tsai P, Lasham A, Campbell H, Reddel R, Braithwaite A, Print C. A study of TP53 RNA splicing illustrates pitfalls of RNA-seq methodology. Cancer Res. 2016; 76:7151–59. https://doi.org/10.1158/0008-5472. CAN-16-1624.
27. Critchley-Thorne RJ, Simons DL, Yan N, Miyahira AK, Dirbas FM, Johnson DL, Swetter SM, Carlson RW, Fisher GA, Koong A, Holmes S, Lee PP. Impaired interferon signaling is a common immune defect in human cancer. Proc Natl Acad Sci U S A. 2009; 106:9010–15. https://doi. org/10.1073/pnas.0901329106.
28. Aguirre-Gamboa R, Gomez-Rueda H, Martínez-Ledesma E, Martínez-Torteya A, Chacolla-Huaringa R, Rodriguez-Barrientos A, Tamez-Peña JG, Treviño V. SurvExpress: an online biomarker validation tool and database for cancer gene expression data using survival analysis. PLoS One. 2013; 8:e74250. https://doi.org/10.1371/journal. pone.0074250.
29. Gong L, Pan X, Lim CB, de Polo A, Little JB, Yuan ZM. A functional interplay between Δ133p53 and ΔNp63 in promoting glycolytic metabolism to fuel cancer cell proliferation. Oncogene. 2018; 37:2150–64. https://doi. org/10.1038/s41388-017-0117-8
30. Cerami E, Gao J, Dogrusoz U, Gross BE, Sumer SO, Aksoy BA, Jacobsen A, Byrne CJ, Heuer ML, Larsson E, Antipin Y, Reva B, Goldberg AP, et al. The cBio cancer genomics portal: an open platform for exploring multidimensional cancer genomics data. Cancer Discov. 2012; 2:401–4. https://doi.org/10.1158/2159-8290.CD-12-0095.
31. Gao J, Aksoy BA, Dogrusoz U, Dresdner G, Gross B, Sumer SO, Sun Y, Jacobsen A, Sinha R, Larsson E, Cerami E, Sander C, Schultz N. Integrative analysis of complex cancer genomics and clinical profiles using the cBioPortal. Sci Signal. 2013; 6:pl1. https://doi.org/10.1126/ scisignal.2004088.
32. Barrett T, Edgar R. Gene expression omnibus: microarray data storage, submission, retrieval, and analysis. Methods Enzymol. 2006; 411:352–69. https://doi.org/10.1016/ S0076-6879(06)11019-8.
33. Miller LD, Smeds J, George J, Vega VB, Vergara L, Ploner A, Pawitan Y, Hall P, Klaar S, Liu ET, Bergh J. An expression signature for p53 status in human breast cancer predicts mutation status, transcriptional effects, and patient survival. Proc Natl Acad Sci U S A. 2005; 102:13550–55. https://doi.org/10.1073/pnas.0506230102. Erratum in: Proc Natl Acad Sci U S A. 2005; 102:17882.
34. Fujita K, Mondal AM, Horikawa I, Nguyen GH, Kumamoto K, Sohn JJ, Bowman ED, Mathe EA, Schetter AJ, Pine SR, Ji H, Vojtesek B, Bourdon JC, et al. p53 isoforms Δ133p53 and p53β are endogenous regulators of replicative cellular senescence. Nat Cell Biol. 2009; 11:1135–42. https://doi. org/10.1038/ncb1928.
35. McEwan MV, Eccles MR, Horsfield JA. Cohesin is required for activation of MYC by estradiol. PLoS One. 2012; 7:e49160. https://doi.org/10.1371/journal.pone.0049160. 36. Reid G, Wallant NC, Patel R, Antonic A, Saxon-Aliifaalogo
F, Cao H, Webster G, Watson JD. Potent subunit-specific effects on cell growth and drug sensitivity from optimised siRNA-mediated silencing of ribonucleotide reductase. J RNAi Gene Silencing. 2009; 5:321–30.
37. R Core Team. R: A language and environment for statistical computing. R Foundation for Statistical Computing, Vienna, Austria (2015). https://www.R-project.org/.
38. Oliveros JC. (2007). VENNY. An interactive tool for comparing lists with Venn Diagrams.