1
MARCH 2013
O
N THEE
XTERNALV
ALIDITY OFL
ABORATORYP
OLICYE
XPERIMENTSJames Alm, Kim M. Bloomquist, and Michael McKee
*Abstract
Laboratory experiments have increasingly been used to examine policy questions. An essential issue for using laboratory results to inform policy debates is the “external validity” of the
experimental results; that is, does behavior in the laboratory apply more broadly to behavior that occurs in the naturally occurring world? In this regard, laboratory studies are sometimes viewed with skepticism, in large part because the student subjects that are typically used are not seen as representative of the population. Undergraduates may have little experience with the policy initiative being investigated, and their socio-economic backgrounds may differ from that of the general population. We examine the issue of external validity, focusing specifically on laboratory policy experiments on tax compliance behavior. We compare reporting tax compliance behavior of student versus non-student subject pools in identical laboratory experiments. We also compare the behavior of subjects in the laboratory with individuals in the field who must make similar decisions, using proprietary individual-level data derived from income tax audits. Our results largely confirm that observed behavior in the laboratory generalizes beyond the laboratory. In particular, the behavioral responses of students to policy innovations are largely the same as non-students. Also, the behavior of subjects in the laboratory is the same as individuals in naturally occurring settings.
Key Words:
Experimental methods, external validity, tax complianceJEL Codes:
C9, H0, H3* Portions of this research were funded by the US IRS (TIRNO – 07 – P – 00683). The views expressed here are those of the authors and should not be interpreted as those of the U.S. Internal Revenue Service.
James Alm: Department of Economics, Tulane University, 6823 St. Charles Avenue, 206 Tilton Hall, New Orleans, LA 70118 (phone 504 862 8344; fax 504 865 5869; email [email protected]). Kim M. Bloomquist: National Headquarters Office of Research, U.S. Internal Revenue Service, Washington, D.C. ([email protected]). Michael McKee: Department of Economics, Walker College of Business, Appalachian State University, Boone, NC 28608 (phone 828 262 6080; fax 828 262 6105; email [email protected]). Previous versions of this paper have been presented at the November 2010 National Tax Association Annual Conference in Chicago, IL and at the June 2011 Internal Revenue Service – Tax Policy Center Research Conference in Washington, D.C.. We are grateful to Charles Christian, John Deskins, Brian Erard, Elaine Maag, Rosemary Marcus, and Alan Plumley for helpful comments and discussions. Please address all correspondence to James Alm.
2
1. Introduction
Laboratory methods are now widely accepted as a methodological approach in economics. Increasingly, laboratory experiments have been used to examine specific public policy issues. There is much to be gained from careful laboratory experiments. Experiments offer a low cost means of testing (and replicating) policy innovations, and they generate precise data on individual behavior, thereby allowing estimation of behavioral responses. Importantly, they allow many policy innovations to be introduced singly and exogenously in a controlled
environment, and as a result experiments are typically seen as having a high degree of “internal validity” (Campbell and Stanley, 1966; Brewer, 2000; Shadish, Cook, and Campbell, 2002) because the causal relation between variables can be properly demonstrated. However, as emphasized by Plott (1987), using laboratory experiments to make more general statements about human behavior requires that what we observe in the laboratory be a close parallel to what we would observe if the same experiment could be conducted in the naturally occurring world; that is, policy experiments must satisfy “external validity”, so that behavior in the laboratory applies more broadly to behavior that occurs in the naturally occurring world. Internal validity can be demonstrated through the evaluation of the design. However, external validity can only be verified empirically.1
As discussed later, there have been a number of attempts to verify the external validity of laboratory experiments. Our purpose in this paper is a detailed evaluation of external validity of experiments investigating tax compliance behavior. Tax evasion is central to many important policy questions. Current estimates report the “tax gap” (or difference between taxes owed and
1
Of course, it is sometimes forgotten that the issue of external validity is one that any applied work must address. For example, field experiments do not fully control subject valuations of commodities used in the field, they cannot generalize beyond the specific subject pool that is investigated, and they face significant difficulties in conducting replications. Empirical analyses with naturally occurring field data face even more serious issues in external validity.
3
taxes paid) in the United States to be $450 billion annually (Internal Revenue Service, 2012). Beyond these massive revenue losses, evasion creates major misallocations in resource use when individuals alter their behavior to cheat on their taxes. Its presence requires that government expend resources to detect noncompliance, to measure its magnitude, and to penalize its practitioners. Evasion alters the distribution of income in arbitrary, unpredictable, and unfair ways, and it may contribute to feelings of unjust treatment and disrespect for the law. More broadly, it is not possible to understand the true impact of taxation without recognizing the existence and the effects of tax evasion.
Laboratory methods have been used to examine a wide range of policies that affect the compliance decision, policies that have not always proven amenable to either theoretical analyses or empirical analyses with field data.2 However, laboratory studies of compliance are sometimes viewed with skepticism. The most common criticism is that the student subjects typically used in experiments may not be representative of taxpayers. Undergraduates may have little experience with filing tax returns, and their economic and demographic backgrounds may differ from that of taxpayers. As a result, there is a concern that experimental results on policy innovations that rely upon student subjects cannot generalize to the larger population.
It is this issue that we examine here. Building on previous research, we present several types of evidence on the external validity of experiments designed to test alternative policy actions to increase voluntary tax reporting. A first question asks: do students behave differently
than non-students in identical laboratory experiments? We are able to answer this question by
2
As one example of the usefulness of experimental methods, consider the role of taxpayer audits. The magnitude of any deterrent effect depends critically on the taxpayer being informed of any enforcement efforts. However, how do taxpayers become informed about enforcement intensity? Further, how do individuals react to advance information on audit rates and audit productivity? Answers to both questions have proven somewhat elusive using either naturally occurring field data or controlled field experiments, but experimental analyses have provided some useful insights. See Alm, Jackson, and McKee (2009) for an analysis of the former question (e.g., enforcement information dissemination), and Alm and McKee (2006) for an analysis of the latter question (e.g., advance information on audit rates and audit productivity).
4
comparing the decisions of a population of adults with that of undergraduate students, both of whom participate in the identical laboratory experiment. A second and different aspect of external validity examines whether behavior by laboratory participants is replicated by behavior of individuals making a similar decision in the naturally occurring world; that is, do participants
in laboratory experiments behave differently than individuals in a naturally occurring setting?
To answer this question, we utilize a data set from the U.S. Internal Revenue Service (IRS) assembled as part of its National Research Program (NRP). These data allow us to compare actual taxpayer behavior with data generated by laboratory subjects, where everyone is engaged in a similar tax reporting decision.
Our analysis indicates that students and non-students respond to the treatment effects in the same way for the same laboratory task. Our analysis also suggests that the behavior of individual taxpayers in the field is congruent with that of subjects making similar decisions in a laboratory experiment. These results confirm that behavior in the laboratory generalizes beyond the laboratory.
2. The Promise and the Pitfalls of Laboratory Experiments
The use of experimental methods derives from a fundamental problem with research in economics. Like other sciences, economics is based on the development of theory and on the ability of that theory to explain observed activities. However, unlike some other sciences, economics faces difficulties in empirically testing the predictive power of its theories using data from the naturally occurring world. Given the dizzying array and complexity of forces that operate in market (and non-market) systems, economists can never be quite certain that they are “holding constant” the many factors driving individual choices, so that they can focus on the
5
“true” driving factors that are the object of empirical testing. Methods for achieving such identification have become increasingly sophisticated over time, including the use of naturally occurring field data, survey methods eliciting hypothetical choices, natural experiments, and controlled field experiments. Each has advantages and disadvantages. For example, field data are readily available; however, as argued by Manski (2000), it is almost impossible to ensure the independence required to conduct econometric research using field data.3 Similarly, controlled field experiments often use participants who are representative of the larger population of interest; however, they require simplified procedures, and they are costly to implement.
Regardless, investigators can feel more assured in methods that are robust to the data generating methodology and that meet the conditions for internal and external validity.4 Despite the many methodological advances in recent years, there are few instances in which identification is uncontroversial and easily achieved.5
Experimental economics represents one methodology for achieving this identification.6 Experimental methods involve the creation of a real microeconomic system in the laboratory, one that parallels the naturally occurring world that is the subject of investigation and one in which subjects (usually students) make decisions that yield individual financial payoffs whose magnitude depends on their decisions. The essence of this system is control over the
environment, the institutions, the incentives, and the preferences that subjects face. Control over
3
See also the alternative perspectives of Leamer (1983), Heckman and Smith (1995), and Harrison and List (2004).
4
For example, there is an extensive literature reporting the results of field trials in economic policy. The 1960s was a period of intense use of field trials in a variety of policy endeavors, including the provision of education services and income support programs. For many reasons, especially the costs of undertaking these field trials and their potential for irreversible damages, the use of field trials has largely been abandoned (Ferber and Hirsch, 1982; Gramlich, 1997). More recently, there is a large literature on field experiments (Harrison and List, 2004; List, 2006). These exercises have tended to focus on settings that elicit observations of behavior that test hypotheses derived from basic theory, so that external validity is not a central concern. The institutional features of these settings are also simplified; indeed, in most cases the intent is less to establish external validity of an experimental design than to provide a substitute for the laboratory by introducing social settings to the decision tasks.
5
For an especially provocative perspective on the difficulties of achieving identification, written for a non-technical audience, see Scheiber (2007).
6
6
preferences is particularly crucial, and is achieved via the method of “induced values”. As
described by Smith (1976), “[s]uch control can be achieved by using a reward structure to induce prescribed monetary value on actions.”7
Economics generally and public policy economics specifically have profited from the use of laboratory experiments.8 Experiments are a relatively low cost means of testing theories and policies, thereby making replication easy and cheap. Experiments permit accurate observation of – and collection of precise data on – individual level decisions when the decision settings have been manipulated, via treatments, in ways that are often not possible with field data; indeed, experiments are not as constrained by the degrees of simplification often necessary to make theoretical and empirical models tractable. Finally, experiments generate data under settings in which there is control over extraneous influences, which allow causal factors to be introduced singly and so make cause-and-effect more readily identified.
Tax compliance is an area that seems especially amenable to laboratory experiments. Theoretical models yield ambiguous results when asked to incorporate many of the factors deemed relevant to the individual compliance decision. Empirical studies of tax compliance using field data are plagued by the absence of reliable information on individual compliance decisions: it is difficult to measure – and measure accurately – something that by its very nature people want to conceal, and it is difficult to control in econometric work for the resulting errors in variables and the many unobservable factors that affect the compliance decision.9 Controlled
7
Smith (1976) goes on to write that a maintained assumption in experimental economics is the following: “[g]iven a costless choice between two alternatives, identical except that the first yields more of the reward medium… than the second, the first will always be chosen (preferred) over the second”. It is in this sense that Smith (1976) refers to experimental economics as “induced value theory”. See also Smith (1982).
8
See Alm and Jacobson (2007) for a survey.
9
There is also the issue of data confidentiality in the case of tax compliance. In most cases, it is difficult for independent researchers to obtain reliable evidence of compliance data. Some exceptions include: Alm, Blackwell, and McKee (2004) who report results for business compliance with New Mexico’s Gross Receipts Tax; Bloomquist (2012) who reports results for U.S. personal income tax reporting for Schedule C (self-employment) income; Erard
7
field experiments face many of these same problems. Laboratory methods allow many factors suggested by theory to be introduced orthogonally via experimental settings, and experiments generate precise data on individual compliance decisions, which allow econometric estimation of individual responses in ways that are simply not possible with field data. Indeed, laboratory methods have been used to examine a wide range of factors in the compliance decision, factors that have not proven amenable to either theoretical or empirical analyses with field data.
Of course, there are some obvious limitations of laboratory experiments, especially if the intention is to use the results for informing public policy. Perhaps the most compelling critique comes from Levitt and List (2007). They caution researchers about making the “parallelism” assumption necessary to use laboratory experiments to make general statements about behavior outside the laboratory. Their chief concern is the excessive amount of pro-social behavior exhibited by human subjects in laboratory experiments compared to the level of such behavior observed in the naturally occurring world. They contend that this type of pro-social behavior reduces the ability of experiments to develop quantitative estimates for “deep” structural
parameters that might apply outside the laboratory, so that laboratory experiments do not exhibit the external validity needed for applying the results to policy issues.
Levitt and List (2007) identify several factors that they believe reduce the external validity of laboratory experiments, including greater scrutiny in the lab than outside it, a lack of anonymity in the lab, the “context” in which lab decisions are made, the size of the stakes in the
and Ho (2004) who study the behavior of non-filers; and Clotfelter (1983) who investigates personal income tax reporting using the U.S. IRS individual level data. Even when such data on reporting behavior are made available, only a tiny fraction of the tax returns are audited, so little is known of the behavior of the non-audited taxpayers.
8
lab, and the limited range of decisions that laboratory subjects are asked to make (and the time that they have to make these decisions).10
Of most relevance to our analysis here is the pool of experimental subjects. It is typically the case that laboratory subjects are drawn from student populations. Levitt and List (2007) argue that student responses are unlikely to be the same as non-student responses in large part because students are younger, better educated, less representative, and less experienced in the decisions being examined than non-students. These concerns are especially germane for compliance experiments. Indeed, a common comment on experimental analysis of tax compliance is that “undergraduate volunteers differ from the taxpayer population in very important ways”, and so cannot “tell us something” about typical taxpayer behavior (Gravelle, 2009).
The general critique of Levitt and List (2007) has itself been the subject of numerous and energetic responses (Falk and Heckman, 2009; Camerer, 2011; Kagel, forthcoming; Harrison, Lau, and Rutström, forthcoming; Frechette, forthcoming). One response has been to point out limitations of other empirical approaches. Indeed, it is sometimes forgotten that the issue of
10
These factors seem unlikely to affect the external validity of well-designed compliance experiments, at least those that adhere to the precepts of Smith (1982). Consider for example the issues of greater degree of scrutiny and lack of anonymity in the laboratory than outside the lab. Indeed, List, Berrens, Bohara, and Kervleit (2004) found that, as decisions became less anonymous, a greater number of subjects contributed to the public good in a one-shot game. However, experiments can take measures to reduce scrutiny of subjects and also to maintain the anonymity of subjects’ responses (e.g., a “double-blind” approach). Indeed, the conditions in most laboratory investigations of tax reporting behavior, including those reported here, implement this double-blind approach, and real-world taxpayers generally believe that they are under significant scrutiny anyway. Similarly, the size of stakes involved in many real-world transactions greatly exceeds what can be reasonably simulated in an experimental setting, including compliance experiments. However, Smith and Walker (1993) present extensive evidence that the size of subject payoffs in laboratory experiments does not significantly affect the central tendency of subject responses, but rather serves mainly to affect its variance around the mean response. “Context” relates to the complex combination of individuals’ perceptions and past experiences that influence how individuals respond in a laboratory setting designed to mimic the naturally occurring setting. While many of the early compliance experiments utilized neutral language, the more recent approaches stress the use of tax filing imagery to achieve parallels with the naturally occurring setting. Finally, the types of decisions that participants in laboratory compliance experiments are asked to make closely parallels those of real-world taxpayers, including the choice of non-filing versus filing and
9
external validity is one that any applied work must address. For example, field experiments do not fully control subject valuations of commodities used in the field, they cannot generalize beyond the specific subject pool that is investigated, and they face significant difficulties in conducting replications. Empirical analyses with naturally occurring field data face even more serious issues in external validity beyond the specific data sample that is examined.
Another response has been to focus specifically on subject pool effects in laboratory and field experiments. This issue of subject pool effects can be examined in several ways. One way is to compare the responses of student subjects with non-student subjects in more-or-less identical laboratory experiments. There are relatively few such studies, but the available evidence is that the experimental responses of students are often similar to the responses of other subject pools in similar laboratory experiments (Plott, 1987; Ball and Cech, 1996).
Another way is to compare student responses in laboratory experiments to the responses of participants in similarly constructed controlled field experiments, in which the same basic choice is examined in both settings. For example, Brookshire, Coursey, and Schulze (1987) compare prices obtained by buyers of strawberries in a laboratory setting versus those in a field setting. The field setting in their study mimicked the laboratory market institution, but
implemented it with non-students making purchase decisions in their homes rather than in the lab. They find equivalent bidding behavior in both settings. In another investigation, Plott (1987) reports comparisons of behavior of student subjects with those of corporate executives in the same policy decision setting, and he observes similar decisions among the student subjects and the executives.11 Dyer, Kagel, and Levin (1989) study bidding behavior in auctions using
11
To provide executives the necessary incentives for the decision setting, each was assigned a student “assistant” to manage the computerized interface and who would be paid the executive’s earnings. These executives tend to be competitive, and each apparently wished to maximize the earnings of his/her assistant. This application emphasizes a key issue when conducting laboratory experiments with different subject pools: the financial rewards to decisions
10
experienced traders and students as subjects, and find similar results; Shogren, Fox, Hayes, and Roosen (1999) conduct a similar study with similar results. A range of other studies is
summarized by Camerer (2011), in which student responses in laboratory experiments are compared to responses of participants in controlled field experiments in such areas as sports card trading, open-air flea markets, donations to student funds, soccer, communal fishing ponds, proofreading/exam grading, and restaurant spending. In most – although not all – cases, these many comparisons have shown no significant differences in behavior.12
However, few of these studies focus on the external validity of policy innovations; of note, none of this work addresses the external validity of compliance experiments. It is this issue that we examine. Specifically, do student subjects in tax compliance laboratory experiments
behave differently than non-student subjects in identical laboratory experiments, whether these differences are due to pro-social behavior or other factors?13 Also, do subjects in laboratory
experiments behave differently than individuals in non-experimental settings, all of whom are making a similar reporting decision?We examine these two specific questions next.
3. Test (1): Students versus Non-students in Identical Experiments
In this section we consider the responses of student subjects versus non-student subjects in identical experiments. These comparisons are based on previously unreported data derived from laboratory experiments conducted by Alm, Cherry, Jones, and McKee (2010, 2012). In both studies the subject pool consisted of students and non-students (i.e., university staff and faculty),
must be salient (Smith, 1982). As the subjects’ opportunity costs increase, so must the laboratory payoffs, and in some cases there may be no feasible monetary reward that sufficiently compensates for decision effort.
12
See Camerer (2011) for a detailed discussion, with references.
13
Note that tax compliance has been the subject of several controlled field experiments. One of the first is by Slemrod, Blumenthal, and Christian (2001); a more recent example is by Kleven, Knudsen, Kreiner, Pedersen, and Saez (2011).
11
who were presented the identical experimental setting. The earlier paper investigates the effects on tax reporting of the provision of information services by the tax agency in an environment in which subjects may not know with certainty their true tax liability. The latter introduces social programs as positive inducements to truthful reporting of tax liabilities; these social programs include an income tax credit (in which receipt requires that the subject must file a tax return) and unemployment benefits (in which benefits are a positive function of past reported taxes). We emphasize here the previously unreported results from these two studies in we compare student versus non-student responses. We begin by briefly discussing the experimental designs, and we then present the comparison of student versus non-student responses in order to answer the question of whether students behave differently than non-students in identical experiments. 3.1. The Experimental Designs
The basic experimental setting implements the fundamental elements of the voluntary filing and reporting system of the individual income tax in most countries. The setting is “context rich”, in that tax language is used throughout. Participants earn income by performing a task, they choose whether to file a tax return, and (conditional upon filing) they self-report tax liability to the tax authority. At the time of filing and reporting decisions, only the individual knows his or her true level of tax liability, and can choose to file and then to report any amount from zero on up. Audits occur with an announced probability, and any nonfiling and underreporting are discovered. If the participant has not paid the appropriate tax liability, then both the unpaid taxes and penalties are collected. This process is repeated over a number of rounds each representing a tax period. Participants are informed that they will be paid their after-tax earnings at the end of the experiment, converted from lab dollars to U.S. dollars at a fixed and announced conversion rate.
12
Participants are told, with certainty, of the audit probability, the penalty rate, and the tax rate. The tax rate is set at 35 percent for all sessions; the penalty rate is also fixed for all sessions at 150 percent (i.e., the participants must pay unpaid taxes plus a penalty of 50 percent of unpaid taxes if audited). The audit probability for filed tax returns is varied once within the session, and the participants are also told that there is zero probability of audit if no tax form is filed. There is no public good financed by the tax payments in order to focus subject attention on the tax setting.
Into this setting, various policy innovations are introduced. A first set of experiments investigates the effects of taxpayer information services on compliance decisions. Here the basic tax reporting decision is “complicated” through the introduction of uncertainty regarding true tax liability, and then information services are provided by the “tax administration” that partially or fully resolve the uncertainty, thereby allowing subjects to compute more easily their tax
liabilities. Further complicating factors include both a tax deduction and a tax credit (comparable to the U.S. Earned Income Tax Credit), each of which is conditional upon filing. The tax
deduction is set at 15 percent of income, and the tax credit begins at a given level and declines at a stated rate as income increases. As a treatment, the exact levels of the deduction and credit are uncertain to the taxpayer at the time of filing. Uncertainty is implemented via mean-preserving spreads (with a uniform distribution) in each, where the participants are informed of the means of the allowed credit and deduction and the ranges for each. As a second treatment, information services are provided that resolve the uncertainty. The information is complete, accurate, and costless to the participant.
A more direct set of positive inducements is also investigated. In one treatment tax credits are introduced that are available to participants but only to those who file a tax return. In a second treatment a “social safety net” (e.g., unemployment replacement income) is present in
13
which individuals face some probability of unemployment and replacement income may be provided, with the benefits conditional upon past filing behavior. There is a known probability of unemployment, and, if the individual becomes unemployed and earns no income, then he or she is unemployed for two periods. Unemployment replacement income is received only if the individual has filed a tax return in each of the two previous periods, the level of which is based on reported taxable income.
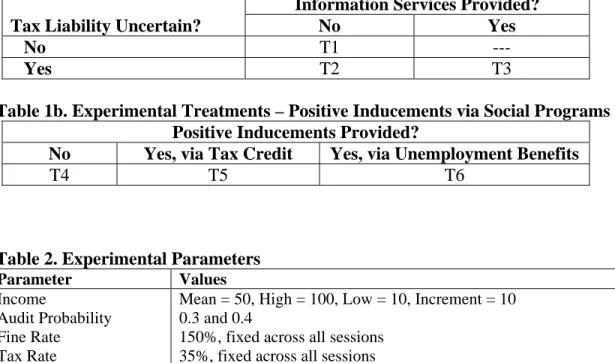
Table 1a summarizes the basic information services design, and Table 1b shows the positive inducements design. In Table 1a, treatment T1 provides a baseline setting that entails no uncertainty and no tax authority information. The second treatment (T2) introduces tax liability uncertainty, in which participants face uncertainty regarding their allowed deduction and tax credit. The third treatment (T3) entails the same uncertainty as in the second treatment, but introduces the option of resolving the uncertainty by receiving information from the tax authority; that is, participants in this treatment are able to click on a button to reveal the true levels of the deduction and the tax credit. In Table 1b, treatment T4 establishes a baseline with no positive inducements, in T5 a tax credit is introduced, and in T6 an unemployment benefit is introduced. The parameters used for the different treatments are reported in Table 2.
The experimental setting is very contextual, in order to provide the necessary degree of “parallelism” to the naturally occurring world that is crucial for the applicability of experimental results (Smith, 1982; Plott, 1987).14 The experimental interface and instructions use tax language throughout, the participants decide whether or not to file a tax return, and they disclose tax
14
Note that a major issue raised by Levitt and List (2007) germane to policy experiments is the role of context in the experimental setting. With respect to tax compliance experiments, the context issue is double edged. While many of the early compliance experiments utilized neutral language, more recent approaches (including the experiments reported here) stress the use of tax filing imagery to achieve parallels with the naturally occurring setting. However, subject heterogeneity may then be a factor as prior experience can affect behavior in the lab. The tax compliance experiments we report here address this latter issue through large sample sizes comparable to some of those used in field experiments on tax compliance. Note that Alm, McCelland, and Schulze (1992) conduct experiments that compare neutral versus non-neutral instructions, and find identical behavior.
14
liability in the same manner as on the typical tax form (e.g., entering income, deductions, and credits on a tax form). There is a time limit on the filing of income, and the individual is automatically audited if he or she fails to file on time. A timer is shown on the screen; when 15 seconds remain, the timer changes color to red, and the clock begins to flash as a reminder that the filing period is about to end.
The dedicated experimental laboratory consists of 25 networked computers, a server, and software designed for this series of experiments. Sessions were conducted at a major state university, using both students and staff as participants.15 Recruiting was conducted using the Online Recruiting System for Experimental Economics (ORSEE) developed by Greiner (2004). The participant database was built using announcements sent via email to all students and staff. Participants were invited to a session via email, and were permitted to participate in only one tax experiment, although other experimental projects are ongoing at the time and participants may have participated in other types of experiments. Only participants recruited specifically for a session were allowed to participate, and no participant had prior experience in this experimental setting. Methods adhere to all guidelines concerning the ethical treatment of human subjects.
Of most importance, participants included both students and non-students, thereby allowing one aspect of the external validity of experiments to be examined: do students behave
differently than non-students in identical experiments? Students were recruited from the pool of undergraduate students at a U.S. public university. Non-students were recruited from faculty and staff at this same university. Also, the compensation varied for students versus non-students. For students the rate was 80 lab dollars to 1 U.S. dollar; faculty and staff participants received a higher exchange rate to reflect their higher outside earnings, with a conversion rate of 50 lab
15
The student portion of the subject pool covered a very broad range of year in studies and major, and no single major exceeded 8 percent of the pool. The staff pool was similarly diverse, covering all levels of support staff, non-academic professional staff, and faculty.
15
dollars to 1 U.S. dollar. Earnings averaged $18 for student subjects. The average payoffs for faculty and staff were $28.16
3.2. Experimental Results
Four hundred and forty nine individuals participated in a session in one of the two sets of experiments. In the sessions designed to investigate the role of tax information services on reporting (T1 through T3), there were 131 subjects, 54 percent of whom were students. In the sessions designed to investigate the effects of positive inducements (T4 through T6), there were 318 subjects (68 percent were students). Table 3 reports the aggregate figures for reporting behavior only by treatment and by subject group.17
Treatments T1 – T3 concern the taxpayer information services design. Looking first at all subjects, the aggregate numbers indicate that uncertainty concerning tax liability results in lower reporting compliance rates but that providing information that resolves the uncertainty increases reporting. With tax liability uncertainty, the overall reporting compliance rate is 0.621 (T2), which is statistically lower than the 0.673 rate without uncertainty (T1) (p=0.025). Further, reporting compliance significantly increases when information services are provided in the uncertain setting (T3), or 0.704 versus 0.621 (p=0.001).
16
The experiments are conducted in such a way as to implement a single- and double-blind setting. Upon arrival at the laboratory each participant is randomly assigned a computer located in a cubicle, and communication with other participants is prohibited. The instructions are conveyed by a series of computer screens that the participants read at their own pace. Clarification questions are addressed after the participants complete the instructions and participate in three practice rounds. Participants are informed that all decisions will be private; the experimenter is unable to observe the decisions and does not know the individual earnings from the income earning task. The experimenter does not move about the room once the session starts, in order to emphasize that the experimenter is not observing participants’ compliance decisions. These features reduce, as much as possible, both peer and experimenter effects that could influence participant decisions. Also, the participants are informed via the consent sheet that all responses are anonymous, that no individual identification will be collected, and that the only record of participation will be the receipt form signed to receive payment at the end of the session. Subjects do not sign consent forms to further increase their anonymity. Participants are told via the instructions that payments will be made in private at the end of the session and that all responses are anonymous.
17
Results for filing behavior are not presented here. The filing results are similar to the reporting results; that is, the mean responses of students and non-students differ slightly, but the changes in the mean responses are largely the same for students and non-students.
16
When these aggregate levels of compliance are broken down by subject type, we see some differences by subject type in reporting compliance rates. In T1, the mean reporting compliance rate of staff is higher (0.795) than the reporting compliance rate of students (0.618), a difference that is statistically different (p < 0.01). Similarly, the mean compliance rates of staff versus students are also different for the other two treatments, T2 and T3, although in these latter two treatments students report at higher rates than staff.
However, despite the somewhat different levels of compliance of the two subject pools, the changes in compliance rates in response to the treatment effects are similar in both pools of subjects. Comparing T2 and T3, we observe that the changes in compliance rates in response to the information services treatments are similar in magnitude and sign. For both subject pools, the provision of information that resolves tax liability uncertainty leads to an increase in the mean reporting rate, by 8.6 percentage points for staff and by 7.9 percentage points for students (or T3 versus T2). The introduction of uncertainty has different effects on these responses by subject pool (or T2 versus T1), reducing reported income for staff and increasing reported income for students; even so, the change in mean compliance rates for students is not statistically significant in these two treatments.
Treatment T4 provides the baseline setting for the investigation of the tax reporting effects of positive inducements. When looking at all subjects combined, the provision of the tax credit (T5) and unemployment benefits (T6) leads in both cases to higher tax reporting relative to T4. Also, both the student subjects and the staff subjects respond positively to the positive
inducements. From the results in Table 3, it appears the staff responses to these inducements are greater than for the student subjects, but the qualitative treatment effects results are again similar.
17
It should be noted that there are several significant differences between the subject pools, and a simple comparison of means does not hold these differences constant. For example, the different pools are compensated at different rates, with staff compensated at roughly twice the rate of student subjects. Also, the average ages of the two groups are different, with the average age of staff exceeding 30 years and the average age of students slightly exceeding 20 years. There are other differences between the pools as well.
Accordingly, we use a conditional analysis at the individual level to re-examine the initial impressions from the aggregate data. For the entire sample, staff only, and students only, we estimate the effects of various design parameters on reporting behavior, while holding other factors constant. We estimate these responses separately for the two experimental designs, using the basic specifications of:
Information Services
Yi,t= 0+ 1Incomei,t+ 2Wealthi,t + 3AuditProbabilityi,t
4TaxLiabilityUncertaintyi+5TaxAgencyInformationt+ 6Xi +ψt+ ui + εi,t Positive Inducements
Yi,t= 0+ 1Incomei,t+ 2Wealthi,t + 3AuditProbabilityi,t+ 4TaxCrediti +5UnemploymentBenefitt+ 6Xi +ψt+ ui + εi,t
where the dependent variable Yi,t denotes subject i’s decision to report income in period t;
Incomei,tis subject i’s earned income in period t; Wealthi,tis subject i’s accumulated earnings (or
Wealth) in period t; AuditProbablityi,tis the audit rate for subject i in period t;
TaxLiabilityUncertaintytis an indicator variable that signifies the presence of uncertainty about tax features in period t; TaxAgencyInformationtis an indicator variable that signifies the presence of agency-provided in period t; TaxCrediti, is an indicator variable that signifies the presence of a tax credit that the subject can claim on filing a tax report; UnemploymentBenefitt, is an indicator variable that signifies the presence of a safety net that (partially) makes up for income lost due to
18
unemployment; Xiis a vector of demographic variables (e.g., subject age, subject sex, subject own preparation of tax returns, subject claimed as a dependent on parental tax returns); ψtis a set of T-1 dummies that capture potential non-linear period effects (T denotes the number of time periods); ui are random effects that control for unobservable individual characteristics; εi,tis the contemporaneous additive error term; and kis the coefficient for variable k. We also include a
dummy variable for whether the individual is audited in the previous period (LagAuditit). As
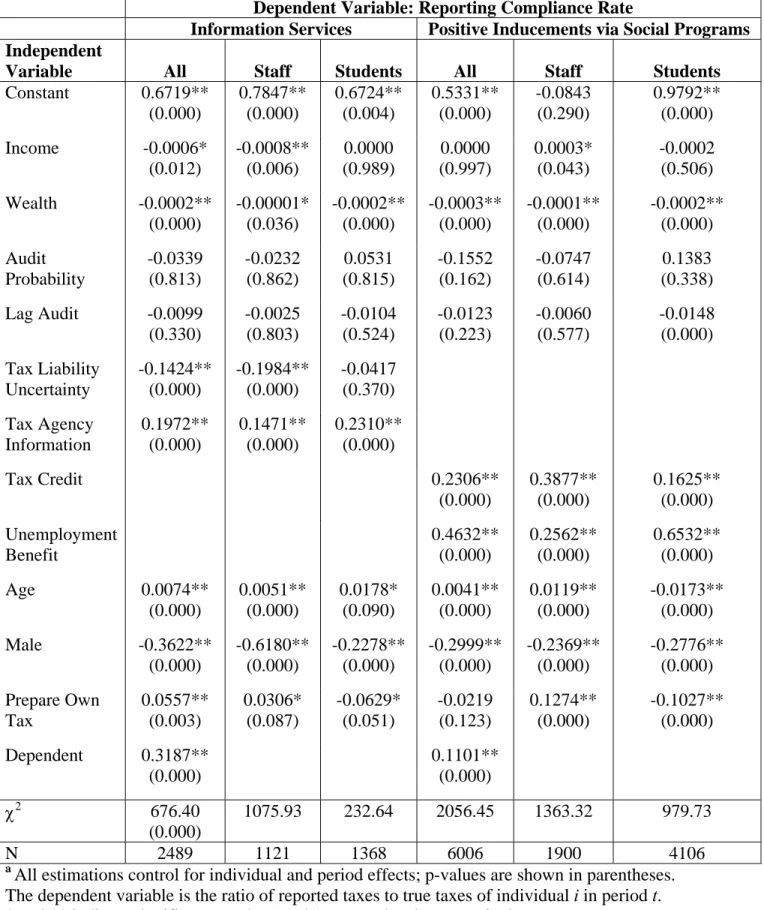
noted, we estimate this specification separately for all subjects, staff only, and students only, for each of the two experimental designs. We report results for a Tobit model with the dependent variable defined as the reporting compliance rate of individual i in period t, where Yi,tequals reported tax paid divided by true tax owed of individual i in period t.18 In all cases, we employ panel methods to control for subject heterogeneity and time period effects. Estimates are presented in Table 4.19
The conditional estimates for the entire subject pool largely confirm our initial
impressions. Estimated coefficients indicate that the presence of uncertainty lowers the reporting compliance rate (significant at the 0.000 level), but that the provision of information services that resolve the uncertainty increases tax reporting to more than offset the uncertainty effect
(significant at the 0.000 level). Thus, taxpayers underreport their liabilities in the face of uncertainty; when this uncertainty is resolved, taxpayers respond by increasing their tax reporting. Similarly, the provision of positive inducements for reporting via a tax credit or unemployment benefits has a positive impact (significant at the 0.000 level) on the reporting compliance rate for all subjects. Also, wealth has a consistently negative impact on reported
18
For the uncertainty treatment with no information services, we use the midpoint of the deduction and credit to compute the tax owed. Thus, we model intended compliance, not final compliance.
19
Note that coefficient estimates for Dependent are only reported for the combined students and staff (denoted “All”) estimations because only students are dependents.
19
income, perhaps because greater wealth decreases risk aversion, males have lower compliance than females, and neither AuditProbability or LagAudit have a significant deterrent effect. The estimated coefficient on the constant term varies significantly across the various specifications, suggesting that the presence of TaxCredit and UnemploymentBenefit in the positive inducements sessions is picking up much of the variance previously contained in Constant in the information services sessions.
Of note, when we look at the separate estimates for staff and students in Table 4, we see that the changes in compliance behavior of the two groups are quite similar, as measured by the estimated coefficients on the policy innovations, even if the average levels of compliance differ in Table 3. For example, after controlling for other possible influences on reporting behavior,
TaxLiabilityUncertainty always has a negative impact on compliance for students and staff, and the provision of TaxAgencyInformation always has a positive impact on compliance for students and staff. Similarly, both types of positive inducements (TaxCredit and UnemploymentBenefit) have the same impacts on reported income for students and staff. The impact of other control variables is often, although not always, the same for the two subject pools.
4. Test (2): Experimental Results versus Non-experimental Results
The comparison of student and non-student subjects in the same experiment setting addresses one aspect of external validity. A second type of evidence compares experimental behavior with that observed in naturally occurring settings (the field). For this evaluation we compare the behavior of student subjects in experiments with that of individuals subjected to random taxpayer audits conduced at part of the National Research Program (NRP) of the Internal
20
Revenue Service (IRS). We first discuss the data, and we then present several comparisons of student behavior in experiments versus non-student responses in NRP data.
4.1. Data: Taxpayer Sample versus Experimental Sample
The comparisons here involve two separate data sets: taxpayer (field) data sets and experimental (lab) data sets. Field results are based on a “Taxpayer Sample”, which represents a sub-sample of randomly audited U.S. individual income tax returns from tax year (TY) 2001, based on NRP (Bennett, 2005). The final NRP sample consists of 44,768 cases representing 125,790,958 taxpayers who filed timely tax returns in TY 2001. Our sub-sample consists of taxpayers whose sole source of income (pre and post-audit) is from a Schedule C sole proprietorship. This group consists of 1,673 records representing 1,101,977 taxpayers.
The field sample of taxpayers was selected by the criteria that their tax reporting task is similar to that faced by the laboratory subjects. Specifically, the field and laboratory settings are comparable in that both emphasize the role of self-reporting of tax liabilities. Schedule C income has a lower incidence of payer reporting (e.g.., W2, 1099INT) to the IRS and this mimics our laboratory setting in which there is no matched information on the taxpayer earnings. The field sub-sample was further narrowed to those Schedule C filers having positive taxable income as determined by the examiner which ensures that taxpayers selected for comparison share similar circumstances with experimental subjects whose reporting decision is such that they must report none, some, or all of a positive amount of income. The final sample of taxpayers has 1,101 cases representing 559,555 individuals. Within this data set there were 29 cases where reported taxable income exceeded the amount of taxable income following examination; these cases (representing 13,131 taxpayers) were assumed to have 100 percent reporting compliance.
21
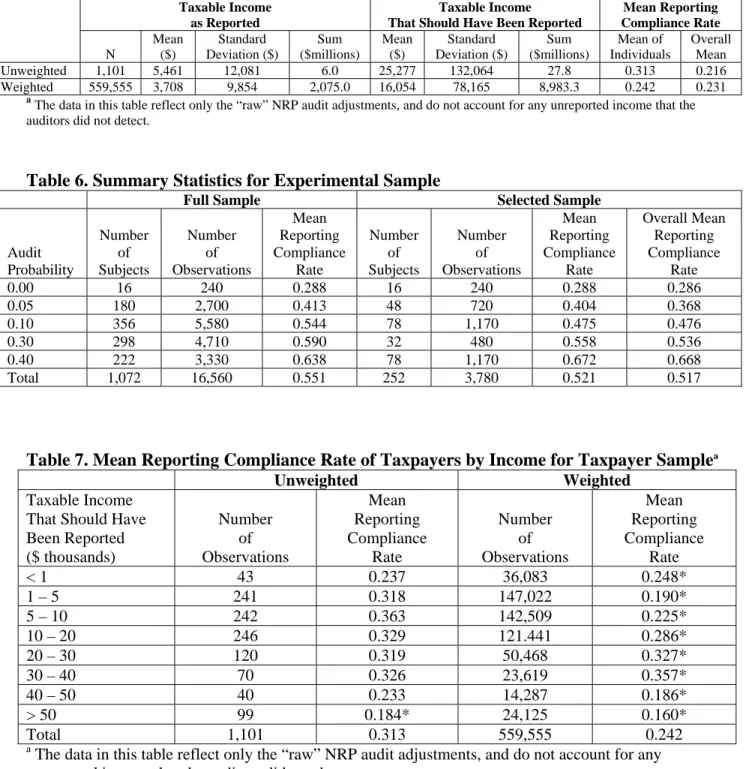
Table 5 displays summary statistics for the Taxpayer Sample. The figures in the two rightmost columns refer to the mean of the individual reporting compliance rates and the overall mean reporting compliance rate, defined as the amount of taxable income reported divided by the amount of taxable income per exam.20 The range of taxable income per exam for this sample spans five orders of magnitude from less than $40 to more than $4 million. The probability of audit for individual taxpayers as a whole in calendar year 2002 was 0.57 percent and 1.72 percent for all Schedule C filers (IRS, 2002).
The experimental data (“Experimental Sample”) were collected from college-age subjects using an experimental design reported elsewhere (Alm and McKee, 2006; McKee, Alm, Cherry, and Jones, 2008; Alm, Jackson, and McKee, 2009; Alm, Deskins, and McKee, 2009; Alm, Cherry, Jones, and McKee, 2010, 2012).21 The data set used for comparison is a sub-sample of the full data set of 16,560 observations from 1,072 individual subjects. The full data set contains observations for “base case” or “no treatment” scenarios and several treatment scenarios
including the existence of a public good, unofficial communication among participants and “official” communication from the tax authority. Data from the base case scenarios are used for our “Experimental Sample” here. In these sessions participants were informed of the number of audits performed (including zero if no audits were performed) following each round. This is similar to IRS policy that makes publicly available the number of audits it performs each fiscal year. The selected subset has 3,780 observations from 252 individuals. The income earned by each subject in each round ranged from a low of 20 to a high of 100 lab dollars. Each subject’s total earnings were converted into currency at the completion of the experiment.
20
The term “income per exam” refers to the income that should have been reported based on the judgment of NRP examiners, and reflects population weights, as appropriate.
21
The experimental data used here are drawn from a wider set of laboratory experiments than we compare above. The additional studies included only student participants, and thus are excluded from the student versus non-student comparisons reported here.
22
Descriptive statistics for the full sample and the selected sample of the Experimental Sample data set are shown in Table 6, which displays summary statistics for the five different audit probabilities used in the experiments.
4.2. Mean Reporting Compliance Rates
A comparison of Tables 5 and 6 shows that mean reporting compliance rates (computed as the average of individual compliance rates) for the lowest two audit rate categories in the Experimental Sample are roughly comparable to but slightly higher than the mean compliance rate in the Taxpayer Sample.22 The mean reporting compliance rate in the Experimental Sample is 0.288 when the audit rate is zero and 0.404 when the audit rate is 0.05, compared to 0.313 (unweighted) and 0.242 (weighted) for the Taxpayer Sample. Recall that the applicable audit rate in the Taxpayer Sample is less than 0.02. Averaging the above two experimental observations we obtain an average compliance rate of 0.346, which is still slightly higher than the unweighted mean for the Taxpayer Sample and considerably higher than the weighted taxpayer mean.23
Is the higher compliance rate in the Experimental Sample due to excessive pro-social behavior produced by a laboratory environment, as would be argued by Levitt and List (2007)? To shed light on this question, we break out compliance rates by income to determine if
reporting compliance varies with level of income in the Taxpayer Sample. If self-interested behavior increases with the size of stakes, then we should expect to see less compliance as
22
An individual’s compliance rate is computed for each subject after each round in the Experimental Sample and for each individual in the NRP-based Taxpayer Sample.
23
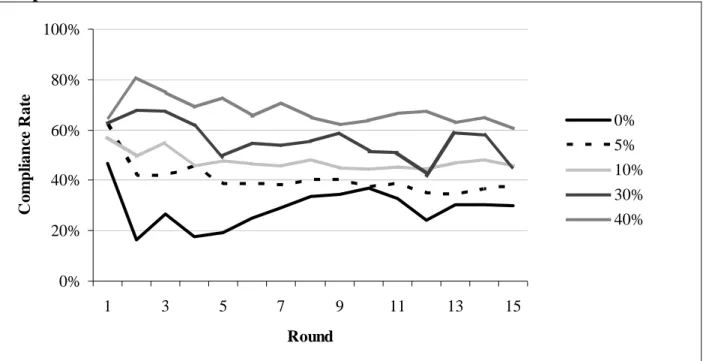
A factor that may have contributed to the higher than expected mean reporting compliance among laboratory subjects subject to an announced audit rate of zero is the uncertainty concerning the true state of the audit
environment. The subjects involved in this session may have expected that audits could be performed even though none ever was. Therefore, the zero audit rate session might indicate the minimum level of compliance when taxpayers are aware of the possibility of audits but do not know the true audit probability. Evidence of this
uncertainty is found in the progression of compliance behavior during the 15 rounds of reporting in the Experimental Sample. Figure 1 displays the mean reporting compliance rate by audit probability and round for the Experimental Sample. The highest reporting compliance occurs in the initial few rounds, gradually falling during the middle rounds and then leveling off in the later rounds. It is also clear from Figure 1 that higher audit rates produce higher reporting compliance.
23
income increases. These results are shown in Table 7 along with results of a difference of means t-test where the mean reporting compliance rate of each income category is compared to the mean reporting compliance rate of taxpayers in all other income categories.
Table 7 shows that in the weighted Taxpayer Sample reporting compliance falls (except in the lowest income group) in both directions away from incomes in the $20,000 to $40,000 range. The apparent non-linear relationship between reporting compliance and income in the weighted sample would seem to indicate that size of stakes alone does not account for the pattern of compliance behavior among actual taxpayers. An alternative hypothesis for the pattern of reporting compliance among high income taxpayers shown in Table 7 is strategic behavior on the part of taxpayers trying to make their tax situation appear similar to the majority in an attempt to minimize IRS scrutiny (Alm and McKee, 2004).
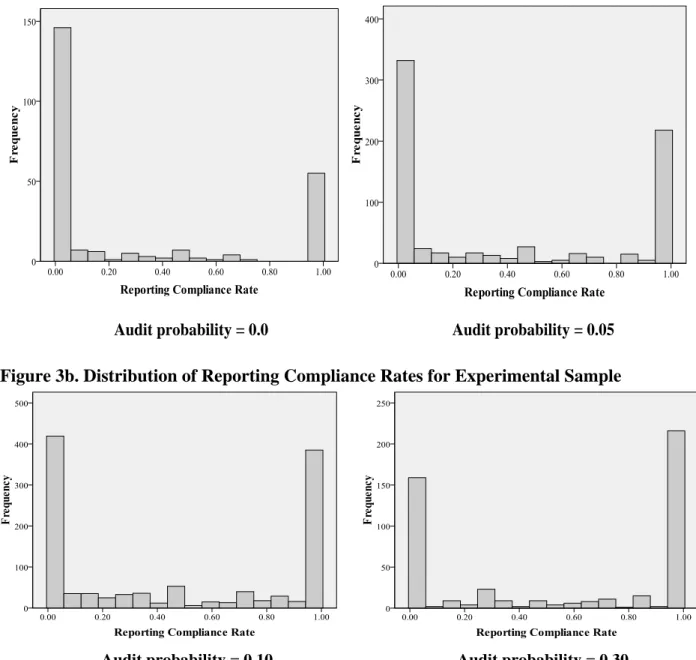
4.3. Distribution of Reporting Compliance Rates
If a laboratory environment induces more pro-social behavior among participants compared to their real world cohorts, then perhaps this behavior manifests itself as a change in the distribution of responses and not just in the measure of central tendency. To explore this possibility, we plot the distribution of reporting compliance rates for the Taxpayer Sample (unweighted and weighted) in Figure 2 and for the Experimental Sample in Figures 3a and 3b. We omit the situation in the experimental sample where the audit probability is 0.40 for brevity.
Visual inspection of these plots reveals that both the Taxpayer Sample and the Experimental Sample have a bi-modal distribution and an apparently random distribution of observations between these two modes. It is also evident from Figures 3a and 3b that, as audit probabilities increase, the primary response of subjects is to switch from being in either full or partial noncompliance to 100 percent compliance. Another feature displayed in these figures is
24
the presence of a small group of individuals who exhibit 100 percent compliance even though the rational choice (from a purely economic standpoint) is to underreport income. Erard and Ho (2004) refer to such individuals as “pathologically honest”. Therefore, laboratory experiments can reliably replicate the existence of this phenomenon in the naturally occurring world.
5. Conclusions
Our analysis suggests two main conclusions. First, the experimental responses of students are similar to the experimental responses of other non-student subject pools. Although the levels of compliance may differ between student and non-student subjects in identical experiments, the changes in compliance behavior in response to institutional changes of these pools largely parallel each other, especially when potentially confounding influences are controlled in a regression framework.
Second, experimental data versus non-experimental (NRP) data indicate largely similar patterns. The comparison of the Taxpayer and Experimental Samples finds that the experimental data can reliably replicate known features of taxpayer compliance behavior for similar decisions in the naturally occurring world, including a bi-modal distribution of reporting compliance rates and the existence of a group of “pathologically honest” individuals who report 100 percent of income. The Taxpayer and Experimental Samples appear to differ largely with respect to a point estimate of the levels of reporting compliance, with the Taxpayer Sample having a lower overall estimate of reporting compliance; 0.242 weighted versus 0.288 and 0.404 for the Experimental Sample (for audit probabilities at 0.0 and 0.05, respectively). This difference in levels could be due to excessive pro-social behavior induced by laboratory conditions, as argued by Levitt and List (2007) or, alternatively, to an incomplete understanding of the audit probabilities in the
25
field, as argued by Alm, Jackson, and McKee (2009). More generally, results from the Taxpayer and Experimental Samples on changes in behavior are very similar to each other, a result that comports with our comparison of student versus non-student behavior in identical laboratory experiments, in which changes in behavior were similar even if levels of compliance were different.24
In sum, our results are consistent with other studies that demonstrate that student and non-student subjects behave and, especially, respond similarly and that laboratory behaviors largely parallel real-world behaviors in settings that compare similar types of decisions. Concerns with the “external validity” of experimental results, at least in the context of tax compliance and in the comparison of changes in behavior, seem largely unwarranted.
Even so, we recognize that one must use the results from laboratory experiments with some care. However, such use depends largely upon the purpose of the experiment. According to Roth (1987), experiments can be classified into three broad categories that depend upon the dialogue in which they are meant to participate. “Speaking to Theorists” includes those experiments designed to test well-articulated theories. “Searching for Facts” involves
experiments that examine the effects of variables about which existing theory has little to say. “Whispering in the Ears of Princes” identifies those experiments motivated by specific policy issues. To date, most experiments in behavioral public economics have fallen into the first two categories. However, this is now changing, and experiments are being increasingly used to illuminate public policy, especially in the area of tax compliance.
In sum, we believe that these results demonstrate that laboratory experiments in the area of tax compliance behavior satisfy several aspects of external validity. This is an important result
24
Preliminary analysis of NRP data for similarly defined Schedule C filers for tax years 2006 and 2007 is largely consistent with these reported results for tax year 2001 NRP data.
26
in policy analysis, especially since empirical analyses of compliance behavior is limited and field experiments of compliance are inevitably very costly to implement. We do not argue that
laboratory experiments can be used to calibrate field results. The stakes are obviously smaller in the lab, and the decision settings are necessarily less rich. Thus, the magnitudes of the responses to the external stimuli will be different in the two environments. Even so, we have shown that the behavioral patterns are sufficiently similar that we can safely predict the effects that would arise from a policy based on the results observed in the laboratory.
We find this result both comforting and plausible. Indeed, in a fundamental sense, there seems little reason to believe that the cognitive processes of students are different from those of “real” people. Our results provide evidence that these student/non-student cognitive processes are in fact similar. We believe that these results suggest that the burden should now be on skeptics to prove that these processes – and the resulting behaviors – actually do differ.
References
Alm, James, Calvin Blackwell, and Michael McKee (2004). “Audit Selection and Firm Compliance with a Broad-Based Sales Tax,” National Tax Journal 57 (2): 209 - 227, Alm, James, Todd Cherry, Michael Jones, Michael McKee (2010). “Taxpayer Information
Assistance Services and Tax Reporting Behavior.” Journal of Economic Psychology 31 (4): 577-586.
Alm, James, Todd Cherry, Michael Jones, Michael McKee (2012). “Social Programs as Positive Inducements for Tax Participation.” Journal of Economic Behavior and Organization 84 (1): 85-96.
Alm, James, John Deskins, and Michael McKee (2009). “Do Individuals Comply on Income Not Reported by Their Employer?” Public Finance Review 37 (2): 120-141.
Alm, James, Betty R. Jackson, and Michael McKee (2009). “Getting the Word Out: Increased Enforcement, Audit Information Dissemination, and Compliance Behavior.” Journal of
Public Economics 93 (3-4): 392-402.
Alm, James and Sarah Jacobson (2007). “Using Laboratory Experiments in Public Economics.”
National Tax Journal 60 (1): 129-152.
Alm, James, Gary H. McClelland, and William D. Schulze (1992). “Why Do People Pay Taxes?” Journal of Public Economics 48 (1): 21-38.
27
Alm, James and Michael McKee (2006). “Audit Certainty, Audit Productivity, and Taxpayer Compliance.” National Tax Journal 59 (4): 801-816.
Alm, James and Michael McKee (2004). “Tax Compliance as a Coordination Game.” Journal of
Economic Behavior and Organization 54 (3): 297-312.
Ball, Sheryl B. and Paula-Ann Cech (1996). “Subject Pool Choice and Treatment Effects in Economic Laboratory Research.” Research in Experimental Economics 60: 239-292. Bennett, Charles (2005). “Preliminary Results of the National Research Program’s Reporting
Compliance Study of Tax Year 2001 Individual Returns.” Paper presented at the Annual eIRS Research Conference (Washington, D.C.), available online at
http://www.irs.gov/pub/irs-soi/05bennett.pdf.
Bloomquist, Kim M. (2011). “Tax Compliance as an Evolutionary Coordination Game: An Agent-Based Approach.” Public Finance Review 39 (1): 25-49.
Brewer, M. (2000). “Research Design and Issues of Validity.” In Handbook of Research
Methods in Social and Personality Psychology, Harry T. Reis and Charles M. Judd (eds.). Cambridge, UK: Cambridge University Press.
Brookshire, David, Donald Coursey, and William D. Schulze (1987). “The External Validity of Experimental Economics Techniques: Analysis of Demand Behavior.” Economic Inquiry 25 (2): 239-50.
Cadsby, C. Bram, Elizabeth Maynes, and Viswanath Umashanker Trivedi (2006). “Tax
Compliance and Obedience to Authority at Home and in the Lab: A New Experimental Approach.” Experimental Economics 9 (4): 343-359.
Camerer, Colin F. (2011). “The Promise and Success of Lab-field Generalizability in
Experimental Economics: A Critical Reply to Levitt and List.” California Institute of Technology – Division of the Humanities and Social Sciences Working Paper, available online at http://papers.ssrn.com/sol3/papers.cfm?abstract_id=1977749.
Campbell, Donald T. and Julian C. Stanley (1966). Experimental and Quasi-experimental
Designs for Research. Chicago, IL: Rand McNally College Publishing, Co.
Carpenter, Jeffrey and Seki, Erika, 2011. “Do social preferences increase productivity? Field experimental evidence from fisherman in Toyama Bay.” Economic Inquiry 49(2): 612-630.
Davis, Douglas D. and Charles A. Holt (1993). Experimental Economics. Princeton, NJ: Princeton University Press.
Dyer, Douglas, John H. Kagel, and Daniel Levin (1989). “A Comparison of Naïve and Experienced Bidders in Common Value Offer Auctions: A laboratory analysis.”
Economic Journal 99: 108-115.
Kagel, John H. and Alvin E. Roth (eds.) (1995). The Handbook of Experimental Economics. Princeton, NJ: Princeton University Press.
Eckel, Catherine C. and Philip J. Grossman (2000). “Volunteers and Pseudo-Volunteers: The Effect of Recruitment Method in Dictator Experiments.” Experimental Economics 3 (2): 107-120.
Erard, Brian and Chih-Chin Ho (2004). “Mapping the Compliance Continuum: From
Pathologically Honest to Flagrantly Defiant.” In Taxing the Hard-to-tax: Lessons from
Theory and Practice, James Alm, Jorge Martinez-Vazquez, and Sally Wallace (eds.). Amsterdam, The Netherlands: Elsevier B. V. – North Holland Publishers, 142-177. Falk, Armin and Ernst Fehr (2003), “Why Labour Market Experiments,” Labour Economics,
28
Falk, Armin and James J. Heckman (2009). “Lab Experiments Are a Major Source of Knowledge in the Social Sciences.” Science 326 (5952): 535-538.
Ferber, Robert and Werner Z. Hirsch (1982). Social Experimentation and Public Policy. Cambridge, MA: Cambridge University Press.
Frechette, Guillaume R. (forthcoming). “Laboratory Experiments: Professionals versus
Students.” In The Methods of Modern Experimental Economics, Guillaume Frechette and Andrew Schotter (eds.). Oxford, UK: Oxford University Press.
Gramlich, Edward M. (1997). “Reflections of a Policy Economist.” The American Economist 41(1): 22-30.
Gravelle, Jane (2009). “Comments on Innovative Approaches to Improving Tax Compliance.”
The IRS Research Bulletin, Recent Research on Tax Administration and Compliance, Selected Papers Given at the 2008 IRS Research Conference, 59-60. Washington, D.C. Greiner, Ben (2004). “The Online Recruitment System ORSEE 2.0 - A Guide for the
Organization of Experiments in Economics.” Working Paper Series in Economics 10, Department of Economics, University of Cologne. Cologne, Germany.
Harrison, Glenn W., Morten Lau, and E. Elisabet Rutström (forthcoming). “Theory,
Experimental Design and Econometrics Are Complementary (And So Are Lab and Field Experiments).” In The Methods of Modern Experimental Economics, Guillaume
Frechette and Andrew Schotter (eds.). Oxford, UK: Oxford University Press.
Harrison, Glenn W. and John A. List (2004). “Field Experiments.” The Journal of Economic
Literature 42 (2): 1009-1055.
Heckman, James J. and Jeffrey A. Smith (1995). “Assessing the Case for Social Experiments.”
The Journal of Economic Perspectives 9 (2): 85-110.
Internal Revenue Service (2002). IRS Data Book 2002, Publication 55B, available online at
http://www.irs.gov/pub/irs-soi/02databk.pdf. Washington, D.C.
Internal Revenue Service (2012). “Tax Gap for Tax Year 2006”, available online at
http://www.irs.gov/pub/newsroom/overview_tax_gap_2006.pdf. Washington, D.C.
Kagel, John H. (forthcoming). “Laboratory Experiments.” In The Methods of Modern
Experimental Economics, Guillaume Frechette and Andrew Schotter (eds.). Oxford, UK: Oxford University Press.
Kleven, Henrik J. Martin B. Knudsen, Claus T. Kreiner, Soren Pedersen, and Emmanuel Saez (2011). “Unwilling or Unable to Cheat? Evidence from a Randomized Tax Audit Experiment in Denmark.” Econometrica 79 (3): 651-692.
Leamer, Edward E. (1983). “Let’s Take the Con out of Econometrics.” The American Economic
Review 73 (1), 31-43.
List, John A. (2006). “The Behavioralist Meets the Market: Measuring Social Preferences and Reputation Effects in Actual Transactions.” The Journal of Political Economy 114 (1): 1-37.
List, John A., Robert Berrens, Alok Bohara, and Joe Kerkvliet (2004). “Examining the Role of Social Isolation on Stated Preferences.” The American Economic Review 94 (3): 741-752. Levitt, Steven D. and John A. List (2007). “What Do Laboratory Experiments Measuring Social
Preferences Reveal About the Real World?” The Journal of Economic Perspectives 21 (2): 153-174.
Manski, Charles F. (2000). “Economic Analysis of Social Interactions.” The Journal of
29
McKee, Michael, James Alm, Todd Cherry, and Michael Jones (2008). Final Report for
TIRNO–07–P–00683 on “Behavioral Tax Research.” Washington, D.C.
Plott, Charles R. (1987). “Dimensions of Parallelism: Some Policy Applications of Experimental Methods.” In Laboratory Experimentation in Economics: Six Points of View, Alvin E. Roth (ed.). New York, NY: Cambridge University Press, 193-229.
Roth, Alvin E. (1987). “Laboratory Experimentation in Economics.” In Advances in Economic
Theory, Fifth World Congress, Truman Bewley (ed.). Cambridge, UK: Cambridge University Press, 269-299.
Scheiber, Noam (2007). “Freaks and Geeks.” The New Republic 2 April 2007: 27-31. Shadish, William R., Thomas D. Cook, and Donald T. Campbell (2002). Experimental and
Quasi-Experimental Designs for Generalized Causal Inference. Boston, MA: Houghton Mifflin.
Shogren, Jason, James Fox, Dermot Hayes, and John Roosen (1999). “Observed Choices for Food Safety in Retail, Survey, and Auction Markets.” American Journal of Agricultural
Economics 81 (5): 1192-9.
Slemrod, Joel, Marsha Blumenthal, and Charles Christian (2001). “Taxpayer Response to an Increased Probability of Audit: Evidence from a Controlled Experiment in Minnesota.”
Journal of Public Economics 79 (3): 455-483.
Smith, Vernon L. (1976). “Experimental Economics: Induced Value Theory.” The American
Economic Review Papers and Proceedings 66 (2): 274-279.
Smith, Vernon L. (1982). “Microeconomic Systems as an Experimental Science.” The American
Economic Review 72 (5): 923–955.
Smith, Vernon L. and James Walker (1993). “Monetary Rewards and Decision Cost in Experimental Economics.” Economic Inquiry 31 (2): 245-261.
30
Table 1a. Experimental Treatments – Information Services
Information Services Provided?
Tax Liability Uncertain? No Yes
No T1 ---
Yes T2 T3
Table 1b. Experimental Treatments – Positive Inducements via Social Programs Positive Inducements Provided?
No Yes, via Tax Credit Yes, via Unemployment Benefits
T4 T5 T6
Table 2. Experimental Parameters
Parameter Values
Income Mean = 50, High = 100, Low = 10, Increment = 10
Audit Probability 0.3 and 0.4
Fine Rate 150%, fixed across all sessions
Tax Rate 35%, fixed across all sessions
Tax Deduction 20%, with uncertainty (when present) via a uniform distribution
Tax Credit Credit=30–0.6*Income, with uncertainty (when present) via a uniform distribution
Unemployment Benefits Benefits = 0.5 or 0.6 times reported income average in the past 2 periods
Table 3. Aggregate Results by Experimental Treatment by Subject Pool a
Treatment
Reporting Compliance Rate
All Staff Students
No Uncertainty (T1) 0.673 (0.476) 0.795 0.618 Uncertainty – No Information (T2) 0.621 (0.499) 0.571 0.689 Uncertainty – Information (T3) 0.704 (0.498) 0.657 0.768 No Positive Inducements (T4) 0.483 (0.502) 0.444 0.504 Tax Credit (T5) 0.599 (0.491) 0.678 0.487 Unemployment Benefits (T6) 0.681 (0.473) 0.709 0.655 a