GRSM-2015-00014.R2 1
Abstract—The knowledge we gain from research in climate science depends on the generation, dissemination, and analysis of high-quality data. This work comprises technical practice as well as social practice, both of which are distinguished by their massive scale and global reach. As a result, the amount of data involved in climate research is growing at an unprecedented rate. Climate model intercomparison (CMIP) experiments, the integration of observational data and climate reanalysis data with climate model outputs, as seen in the Obs4MIPs, Ana4MIPs, and CREATE-IP activities, and the collaborative work of the Intergovernmental Panel on Climate Change (IPCC) provide examples of the types of activities that increasingly require an improved cyberinfrastructure for dealing with large amounts of critical scientific data. This paper provides an overview of some of climate science's big data problems and the technical solutions being developed to advance data publication, climate analytics as a service, and interoperability within the Earth System Grid Federation (ESGF), the primary cyberinfrastructure currently supporting global climate research activities.
Index Terms—IPCC, CMIP, ESGF, Obs4MIPs, Ana4MIPs, CREATE-IP, OCW, CAaaS, ESGF-CWT, WPS.
I. INTRODUCTION
HE term ‘‘big data’’ is used to describe data sets that are too large or complex to be worked with using commonly-available tools [1]. Climate science represents a big data domain that is experiencing unprecedented growth [2]. Some of the major big data technical challenges facing climate science are easy to understand: large repositories mean that the data sets themselves cannot easily be moved—instead, analytical operations must migrate to where the data reside; complex analyses over large repositories require high-
This work has been funded by the NASA Computational Modeling Algorithms and Cyberinfrastructure (CMAC) program through grants to the authors’ collaborating institutions.
J. L. Schnase, C. S. Lynnes, W. P. Webster, D. Q. Duffy, M. A. McInerney, G. S. Tamkin, G. L. Potter, and L. Carrier are with NASA Goddard Space Flight Center, Greenbelt, MD 20771 USA (email: (john.l.schnase, christopher.s.lynnes, phil.webser, daniel.q.duffy, mark.mcincerney, glenn.s.tamkin, gerald.l.potter, laura.carriere)@nasa.gov).
T. J. Lee is with NASA Headquarters, Washington, DC 20546 USA (email: [email protected]).
C. A. Mattmann, L. Cinquini, P. M. Ramirez, A. F. Hart, and D. Waliser are with the NASA Jet Propulsion Laboratory, Pasadena, CA 91109 USA (email: (chris.a.mattmann, luca.cinauini, paul.m.ramirez, andrew.f.hart, duane.walier(@jpl.nasa.gov).
D. Williams is with Lawrence Livermore National Laboratory, Livermore, CA 94550 USA (email: [email protected]).
P. L. Rinsland is with NASA Langley Research Center, Hampton, VA 23681 USA (email: [email protected]).
performance computing; large amounts of information increase the importance of metadata, provenance management, and discovery; migrating codes and analytic products within a growing network of storage and computational resources creates a need for fast networks, intermediation, and resource balancing; and, importantly, the ability to respond quickly to customer demands for new and often unanticipated uses for climate data requires greater agility in building and deploying applications [3].
In addressing these challenges, it is important to recognize that the work of climate science comprises social practice as well as technical practice [4, 5]. There are established human processes for creating, sharing, and analyzing scientific data sets, often in a highly collaborative mode. The work is both valued by society and subject to intense critical scrutiny. It informs national and international policy decisions. Collectively, these social factors add urgency and complexity to our efforts to build an effective cyberinfrastructure to support climate science.
This paper provides an overview of some of climate science's big data problems and the technical solutions being developed to improve data publication, analysis, and accessibility. This material combines the contributions of those who participated in the 2014 Big Data From Space Conference (BiDS '14) session titled "Big Data Challenges in Climate Science" [6–8]. We use the work being done by the Intergovernmental Panel on Climate Change as the context for our presentation, with particular focus on the global climate research community's Earth System Grid Federation collaborative infrastructure and the community’s Climate Model Intercomparison efforts.
II. BACKGROUND
Our understanding of the Earth’s processes is based on a combination of observational data records and mathematical models. The size of our space-based observational data sets is growing dramatically as new missions come online. However, a potentially bigger data challenge is posed by the work of climate scientists, whose models are producing data sets of hundreds of terabytes or more [9].
There are two major challenges posed by the data intensive nature of climate science. There is the need to provide effective means for publishing large-scale scientific data collections. This capability is the foundation upon which a variety of data services can be provided, from supporting active research to large-scale data federation, data distribution,
Big Data Challenges in Climate Science
John L. Schnase, Tsengdar J. Lee, Chris A. Mattmann, Christopher S. Lynnes, Luca Cinquini, Paul M.
Ramire
z
, Andre F. Hart, Dean N. Williams, Duane Waliser, Pamela Rinsland, W. Philip Webster,
Daniel Q. Duffy, Mark A. McInerney, Glenn S. Tamkin, Gerald L. Potter, and Laura Carrier
and archival storage.
The other data intensive challenge has to do with how these large datasets are used: data analytics—the capacity to perform useful scientific analyses over large quantities of data in reasonable amounts of time. In many respects this is the biggest challenge, for without effective means for transforming large scientific data collections into meaningful scientific knowledge, our climate science mission fails.
In order to gain a perspective on the big data challenges in climate science and the efforts that are underway to address those challenges, it is helpful to examine four elements operating at the core of global-scale climate research: (1) the Intergovernmental Panel on Climate change, which has responsibility for integrating scientific results and presenting them in meaningful ways to policy makers throughout the world; (2) climate model intercomparison experiments that coordinate research on general circulation models, arguably the most important tools available to scientists who study the climate; (3) the Earth System Grid Federation, which provides the distributed infrastructure for publishing climate model outputs, sharing scientific knowledge, and supporting global-scale collaboration; and (4) a new wave of data publication activities aimed at integrating observational data and reanalysis data into the Earth System Grid Federation. In this section, we take a closer look at each of these elements.
A. Intergovernmental Panel on Climate Change
The Intergovernmental Panel on Climate Change (IPCC) is the leading international body for the assessment of climate change [10]. It was established by the United Nations Environment Program (UNEP) and the World Meteorological Organization (WMO) in 1988 to provide the world with a clear scientific view on the current state of scientific knowledge about climate change and its potential environmental and socio-economic impacts.
The IPCC is open to all member countries of the UN and WMO. Currently 195 countries are members of the IPCC. Governments participate in the review process and the plenary sessions, where main decisions about the IPCC work program are taken and reports are accepted, adopted, and approved. Thousands of scientists from all over the world contribute to the work of the IPCC on a voluntary basis. Review is an essential part of the IPCC process, to ensure an objective and complete assessment of current information. IPCC aims to reflect a range of views and expertise. The IPCC Secretariat coordinates all the IPCC work and liaises with Governments.
Because of its scientific and intergovernmental nature, the IPCC embodies a unique opportunity to provide rigorous and balanced scientific information to decision makers. By endorsing the IPCC reports, governments acknowledge the authority of their scientific content. The work of the organization is therefore relevant and yet policy-neutral, never policy-prescriptive.
B. Climate Model Intercomparison
Climate model intercomparison is one of the most important lines of research contributing to our understanding of the
climate, and it contributes significantly to the work of the IPCC [11, 12]. The World Climate Research Programme's (WCRP) Working Group on Coupled Modelling (WGCM) established the Coupled Model Intercomparison Project (CMIP) as a standard experimental protocol for studying the output of coupled atmosphere-ocean general circulation models (GCMs). CMIP provides a community-based infrastructure in support of climate model diagnosis, validation, intercomparison, documentation, and data access. This framework enables a diverse community of scientists to analyze GCMs in a systematic fashion, a process that serves to facilitate model improvement. Virtually the entire international climate modeling community has participated in this project since its inception in 1995. The Program for Climate Model Diagnosis and Intercomparison (PCMDI) archives much of the CMIP data and is one of a number of international climate data repositories that provide support for CMIP. PCMDI's CMIP effort is funded by the Regional and Global Climate Modeling (RGCM) Program of the Climate and Environmental Sciences Division of the US Department of Energy's Office of Science, Biological, and Environmental Research (BER) program.
Coupled atmosphere-ocean general circulation models allow the simulated climate to adjust to changes in climate forcing, such as increasing atmospheric carbon dioxide. CMIP began in 1995 by collecting output from model "control runs" in which climate forcing is held constant. Later versions of CMIP collected output from an idealized scenario of global warming, with atmospheric CO2 increasing at the rate of 1% per year until it doubles at about Year 70. CMIP output is available for study by diagnostic sub-projects, academic users, and the public.
Climate model intercomparison has proven to be an effective method to both improve climate models in general and to provide the basis for preparing ensembles to improve climate prediction. In the past, preparation of the data for such activities was the responsibility of the individual researcher. Recently, however, large international collaborative projects such as the CMIP3 and CMIP5 projects have agreed to share model output through the Earth System Grid Federation.
C. Earth System Grid Federation
The climate research community uses the Earth System Grid Federation (ESGF) as the primary mechanism for publishing and sharing IPCC data as well as the ancillary observational and reanalysis products described below [13, 14]. ESGF is an international collaboration with a focus on serving the coupled model intercomparison projects and supporting climate and environmental science in general. The ESGF grew out of the larger Global Organization for Earth System Science Portals (GO-ESSP) community and reflects a broad array of contributions from its collaborating partners.
ESGF combines features found in a variety of grid computing approaches. ESGF is a peer-to-peer content distribution network in which geographically distributed collections can be accessed by the climate research community through a certificate authority mechanism.
Published ESGF data, regardless of source, conforms to the community-defined CMIP5 Data Reference Syntax and Controlled Vocabularies standard. The trust relationship set up by the authority mechanism essentially creates a virtual organization of producers and consumers of ESGF products.
Reformatting the model output to a common standard and distributing the data though a common portal has proven to be an innovative approach allowing thousands of additional researchers access to data previously limited to a much more sophisticated technical audience [6, 7]. For example, IPCC Working Group Two, which focused on climate change impacts, adaptations, and vulnerabilities, and Working Group Three, which dealt with the mitigation of climate change, made extensive use of the CMIP3 and CMIP5 archives in the preparation of recent IPCC Assessment Reports. This approach to data distribution has proven to be so successful that other climate related projects have emerged to provide CMIP-relevant observations and reanalysis. More than 1300 scientific papers have been written using these data. Distributing satellite observations and reanalysis products for use by the climate research community is the next step.
D. Obs4MIPs, Ana4MIPs, and CREATE-IP
Observations tailored for use by the climate science community has long been a dream of many climate modeling scientists and their graduate students [15]. When science teams associated with Earth observational missions produced new level three products in the 1980’s—the Earth Radiation Budget Experiment (ERBE), for example—it was a challenge for climate researchers to customize the data so that they could be used to validate the model’s Top Of Atmosphere (TOA) energy balance and cloud radiative properties. Once they mastered the format, each scientist obtained their own copy of the data and used it for model evaluation. This process has been repeated over and over by individual scientists, even today. As the processing of satellite data became more sophisticated, accessing the data became more onerous because of the proliferation of versions, levels of processing, and other features. As a result, the IPCC's Third Assessment Report, released in 2001, only dedicated a minimal amount of discussion to model validation using observations.
By 2013, IPCC's Fifth Assessment Report included more extensive use of observational data, facilitated in part by the efforts to make satellite data more accessible in the intervening years. This was accompanied by a growing interest in the use of reanalysis data, another application of observational data of particular value to climate monitoring and research. Reanalyses assimilate historical observational data spanning an extended period of time using a single, constant assimilation scheme. They ingest all available observational data every 6–12 hours over the period being analyzed and produce a dynamically consistent estimate of the climate state at each time interval. Reanalysis data sets can span decades, going as far back as the beginning of the satellite era [2].
Because of this growing need to use observations in the IPCC process, the Observations for Model Intercomparison
Projects (Obs4MIPs), Analysis for Model Intercomparison Projects (Ana4MIPs), and the Collaborative REAnalysis Technical Environment–Intercomparison Project (CREATE-IP) [7] have been created to provide a new way to distribute observational data and reanalyses for use by climate scientists. The objective of these projects is to prepare observational data (currently mostly satellite data) and selected reanalysis products in the same way as the CMIP model data have been reformatted and tagged for inclusion into ESGF. The preparation involves ensuring the data files are in NetCDF (https://www.unidata.ucar.edu/software/netcdf/docs/) format and the data adhere to the Climate and Forecast (CF) metadata conventions in addition to other formatting procedures that have been agreed upon by the World Climate Research Program (WCRP) Working group on Coupled Modeling (WGCM). To aid with the formatting procedures, a software utility, Climate Model Output Rewriter (CMOR), is available that ensures adherence to the standard formatting. Software is also available to display and analyze the data in 2D and 3D.
Data entered into the projects must have a history of peer reviewed publications, be version controlled, and reside in a long-term archive. For example, a WCRP Data Advisory Council (WDAC) Obs4MIPs task team has been established to govern the data inclusion process. For inclusion into the Obs4MIPs archive, a data producer proposes to the WDAC task team with the detailed information required above. The first step in preparation of the data is generally done in consultation with the individual science teams, who identify specifics about the data, including the appropriate processing version, citations, and other details. Documentation and error estimates are also required.
Table 1 shows a current list of the observational data products available through ESGF. Because of the strict NetCDF file format and CF-compliance requirement, one limitation that is still being resolved is the desire by some climate modeling researchers to include data that does not have a corresponding variable in the CMIP archive but has significant value to the climate research community. For instance, the Moderate Resolution Imaging Spectroradiometer (MODIS) produces several dozen products, yet only a few variables have a corresponding CMIP variable and are thus eligible for publication under the present guidelines. Another limitation is the limited capability of including uncertainty information in the Obs4MIPs formatted files.
Reanalysis is extremely useful for many issues relating to climate models [16, 17]. The Ana4MIPs effort focuses on providing a select set of reanalysis variables to climate model intercomparison efforts. This project provides only variables that are a match for the CMIP5 protocol and of particular use to researchers who need reanalysis data as a baseline for model and model ensemble evaluation. It has become apparent, however, that there is strong interest in making a more expansive set of atmospheric reanalysis data available to the community via the ESGF. In response, NASA has initiated the CREATE-IP project. CREATE-IP includes reanalysis products from the European Center for Medium-Range Weather Forecasts (ECMWF), National Oceanic and
Atmospheric Administration (NOAA)/National Center for Environmental Prediction (NCEP), NOAA/Earth system Research Laboratory (ESRL), NASA, and the Japanese Meteorological Agency (JMA). Each reanalysis has been repackaged in a form similar to the CMIP and Obs4MIPs projects. Table 1 shows the current CREATE-IP variables.
III. NEXT GENERATION CYBERINFRASTRUCTURE FOR CLIMATE DATA PUBLICATION
Because of the fundamental importance of high-quality, readily-accessible data, an effective cyberinfrastructure for
climate science requires improved ways to generate and disseminate data. Institutions that host ESGF servers have responsibility for correctly formatting and registering their data contributions. IPCC data are produced in forms that are directly compatible with the ESGF CMIP5 standard. As described above, data products from other sources—such as Obs4MIPs, generally require reformatting. This alignment— moving from the frame of reference defined by the observational community to that used by the climate community—is often a mixed process of automatic and manual conversion and contributes significantly to the data preparation overhead of the Obs4MIPs activities. It is at the TABLE I
OBS4MIPS AND CREATE-IP VARIABLES AVAILABLE IN ESGF
Obs4MIPs Variables
Air Temperature Standard Error Northward Wind
Ambient Aerosol Optical Thickness at 550 nm Number of CloudSat Profiles Contributing to the Calculation Ambient Aerosol Optical Thickness at 550nm Observations Number of MISR Samples
Ambient Aerosol Optical Thickness at 550nm Standard Deviation PARASOL Reflectance CALIPSO 3D Clear fraction Precipitation - monthly and 3h CALIPSO 3D Undefined fraction Precipitation Standard Error CALIPSO Clear Cloud Fraction Sea Surface Height Above Geoid
CALIPSO Cloud Fraction Sea Surface Height Above Geoid Observations CALIPSO High Level Cloud Fraction Sea Surface Height Above Geoid Standard Error CALIPSO Low Level Cloud Fraction Sea Surface Temperature
CALIPSO Mid Level Cloud Fraction Sea Surface Temperature Number of Observations CALIPSO Scattering Ratio Sea Surface Temperature Standard Error
CALIPSO Total Cloud Fraction Specific Humidity
Cloud Fraction retrieved by MISR Specific Humidity Number of Observations CloudSat 94GHz radar Total Cloud Fraction Specific Humidity Standard Error
CloudSat Radar Reflectivity CFAD Surface Downwelling Clear-Sky Longwave Radiation Eastward Near-Surface Wind Surface Downwelling Clear-Sky Shortwave Radiation Eastward Near-Surface Wind Number of Observations Surface Downwelling Longwave Radiation
Eastward Near-Surface Wind Standard Error Surface Downwelling Shortwave Radiation
Eastward Wind Surface Upwelling Clear-Sky Shortwave Radiation
Fraction of Absorbed Photosynthetically Active Radiation Surface Upwelling Longwave Radiation ISCCP Cloud Area Fraction Surface Upwelling Shortwave Radiation ISCCP Mean Cloud Albedo (day) TOA Incident Shortwave Radiation
ISCCP Mean Cloud Top Pressure (day) TOA Outgoing Clear-Sky Longwave Radiation ISCCP Mean Cloud Top Temperature (day) TOA Outgoing Clear-Sky Shortwave Radiation ISCCP Total Cloud Fraction (daytime only) TOA Outgoing Longwave Radiation
Leaf Area Index TOA Outgoing Shortwave Radiation
Mole Fraction of O3 Total Cloud Fraction
Mole Fraction of O3 Number of Observations Total Cloud Fraction Number of Observations Mole Fraction of O3 Standard Error Total Cloud Fraction Standard Deviation
Near-Surface Wind Speed Water Vapor Path
Near-Surface Wind Speed Number of Observations Sea Surface Temperature Near-Surface Wind Speed Standard Error Solar Zenith Angle
CREATE-IP Variables
Air Temperature Specific Humidity
Condensed Water Path Surface Air Pressure
Convective Precipitation Surface Downward Eastward Wind Stress Eastward Near-Surface Wind Surface Downward Northward Wind Stress
Eastward Wind Surface Downwelling Longwave Radiation
Evaporation Surface Downwelling Shortwave Radiation
Geopotential Height Surface Temperature
Ice Water Path Surface Upward Latent Heat Flux
Near-Surface Air Temperature Surface Upward Sensible Heat Flux Near-Surface Wind Speed Surface Upwelling Longwave Radiation Northward Near-Surface Wind Surface Upwelling Shortwave Radiation
Northward Wind TOA Incident Shortwave Radiation
Precipitation TOA Outgoing Clear-Sky Longwave Radiation
Relative Humidity TOA Outgoing Longwave Radiation
Sea Level Pressure Total Cloud Fraction
Snowfall Flux Water Vapor Path
heart of the Obs4MIPs, Ana4MIPs, and CREATE-IP data challenge [18].
Efforts are underway to develop a cyberinfrastructure that overcomes these challenges [6]. The new capabilities will provide automatic conversion of NASA HDF-EOS/HDF datasets into NetCDF/CF datasets compatible with the ESGF, the ability to perform model checking on those converted datasets using the Climate Model Output Rewriter, and the ability to automatically publish remote sensing data into the ESGF.
We are working with three NASA Distributed Active Archive Centers (DAACs) to identify requirements for various ad-hoc data publication pipelines used in the Obs4MIPs projects and then standardize them into a toolkit. The publication infrastructure is now part of a core project called Open Climate Workbench (OCW) [19] stewarded at the open source Apache Software Foundation (ASF), the world’s largest open source organization and home to some of the Web’s most widely-used software systems. For example, its flagship HTTPD web server services 53% of the Web requests on the Internet.
A. Architecture
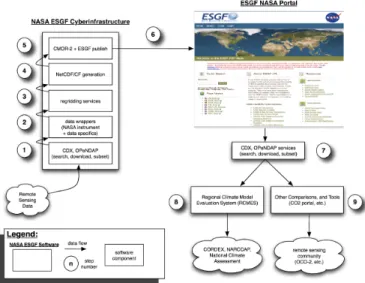
A notional architecture for a next generation publishing cyberinfrastructure is shown in Fig. 1. As originally conceived, remote sensing data would enter the system from the bottom left of the figure. Remote sensing data used for comparison with climate models are generally gridded, though the system could handle swath information through its transformation process as described below.
In an initial step (Fig. 1, Step 1), the architecture would leverage a technology such as OPeNDAP (http://www. opendap.org/) to access and subset the data, which provides input to the next step (Fig. 1, Step 2) where data wrappers encapsulate mission-specific transformations needed to yield a variable (e.g., sea ice), along with its latitude and longitude in WGS84 format, time in ISO6801 format, and an optional height value. This five-tuple of (variable value, latitude, longitude, time, height) would then be passed to a regridding step (Fig. 1, Step 3) where the data would be spatially and temporally aligned with the desired climate model output and written to a NetCDF/CF-compliant file with the necessary metadata information (Fig. 1, Step 4). Finally, the data would be validated using the Climate Model Output Rewriter (Fig. 1, Step 5) and published to the ESGF (Fig.1, Step 6).
The right side of Fig. 1 shows what a user would do once the remote sensing data are available in the ESGF. Here again OPeNDAP provides user and application access to published ESGF data (Fig. 1, Step 7). In this case, the architecture creates leveraged opportunities to combine OPeNDAP with other community-oriented tools, such as the Regional Climate Model Evaluation System (RCMES; https://rcmes. jpl.nasa.gov/), a Web-accessible database of remote sensing observations and analytical toolkit for computing climate metrics (Fig. 1, Steps 8–9).
B. Technologies and Implementation
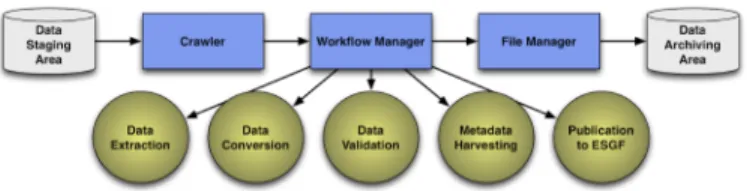
Fig. 2 shows how we have implemented the notional architecture described above. We standardized on the use of a few technologies to implement the architecture, and we simplified the process by collapsing Steps 1–4 into Data
Extraction and Data Conversion steps. The extraction steps
are provided by OPeNDAP and Apache's Object Oriented Data Technology (OODT) framework via the framework’s core services and three of its client tools, the Crawler, Workflow Manager, and File Manager.
The Workflow Manager encapsulates control and data flow and allows a user to model a series of steps in the scientific process as well as the input and output passed between steps. The File Manager tracks a file’s key information, including its metadata, provenance, location, Multi-Purpose Internet Mail Extensions (MIME) type, etc., and it provides data movement capabilities. The Crawler provides automated methods for ingesting, locating, selecting, and interactively extracting files and metadata managed by the File Manager, while simultaneously notifying the Workflow Manager that pipelines need to be executed.
The Crawler is seeded with an initial data staging area or a non-local OPeNDAP directory of remote sensing data. The Crawler extracts file and HDF metadata, which it subsequently presents to the File Manager for ingestion. At the same time, the Crawler notifies the Workflow Manager that the conversion pipeline should be initiated for the variable of interest. Data Extraction is kicked off, and the required five-tuple of information is extracted. Any necessary conversion is performed in the Data Conversion step using the NetCDF Operators package, which then writes a new NetCDF file based on the extracted five-tuple. The resulting output is sent to the Data Validation step that in turn calls a Python Web service that applies the CMOR checker. If the validation is successful, Metadata Harvesting collects the NetCDF Fig. 1. The NASA ESGF cyberinfrastructure shown (upper left) is responsible for publishing remote sensing datasets to the ESGF portal (upper right). Automated data generation and dissemination workflows substantially improve the efficiency and accuracy of the data publication process.
information into a Thematic Real-Time Environmental Distributed Data Services (THREDDS) data server, publishes it to Apache Solr, and, ultimately, delivers it to the Earth System Grid Federation in the Publishing to ESGF step.
Publishing remote sensing data alongside climate model output enables better comparisons and understanding that, in turn, more completely inform those who study the climate and those who make crucial policy decisions affecting the climate. Our expectation is that using automated workflows to streamline the publication of high-quality data will significantly improve this crucial activity.
IV. NEXT GENERATION CYBERINFRASTRUCTURE FOR CLIMATE DATA ANALYTICS
Climate model input and output data provide the basis for intellectual work in climate science. As these data sets grow in size, new approaches to data analysis are needed. In efforts to address the big data challenges of climate science, some researchers are moving toward a notion of Climate Analytics-as-a-Service (CAaaS). CAaaS combines high-performance computing and server-side analytics with scalable data management, cloud computing, a notion of adaptive analytics, and domain-specific APIs to improve the accessibility and usability of large collections of climate data [3, 8]. In this section we take a closer look at these concepts and a specific implementation of CAaaS in NASA’s MERRA Analytic Services project.
A. High-performance server-side analytics
At its core, CAaaS must bring together data storage and high-performance computing in order to perform analyses over data where the data reside. MapReduce has been of particular interest, because it provides an approach to high-performance analytics that is proving to be useful in many data intensive domains [3]. MapReduce enables distributed computing over large data sets using high-end computer clusters. It is an analysis paradigm that combines distributed storage and retrieval with distributed, parallel computation, allocating to the data repository analytical operations that yield reduced outputs to applications and interfaces that may reside elsewhere. Since MapReduce implements repositories as storage clusters, data set size and system scalability are limited only by the number of nodes in the clusters.
MapReduce distributes computations across large data sets using a large number of computers (nodes). In a “map” operation a head node takes the input, partitions it into smaller
sub-problems, and distributes them to data nodes. A data node may do this again in turn, leading to a multi-level tree structure. The data node processes the smaller problem, and passes the answer back to a reducer node to perform the reduction operation. In a “reduce” step, the reducer node then collects the answers to all the sub-problems and combines them in some way to form the output—an answer to the problem it was originally trying to solve.
While MapReduce has proven effective for large repositories of textual data, its use in data intensive science applications has been limited, because many scientific data sets are inherently complex, have high dimensionality, and use binary formats. Adapting MapReduce to complex, binary data types has been a major advancement to these efforts. Due to the importance of MapReduce in large-scale analytics, and its widespread use, there has been significant private-sector investments in recent years aimed at improving the performance and applicability of the technology— improvements that benefit and leverage the efforts of science communities that are becoming more involved in analytics.
B. Workflow-stratified adaptive analytics
The relationship between data and workflows contributes to the way we think about data analytics. Data-intensive analysis workflows, in general, bridge between a largely unstructured mass of archived scientific data and the highly structured, tailored, reduced, and refined analytic products that are used by individual scientists and form the basis of intellectual work in the domain. In general, the initial steps of an analysis, those operations that first interact with a data repository, tend to be the most general, while data manipulations closer to the client tend to be the most tailored—specialized to the individual, to the domain, or to the science question under study. The amount of data being operated on also tends to be larger on the repository-side of the workflow, smaller toward the client-side end-products.
This stratification can be used to optimize data-intensive workflows. We believe that the first job of an analytics system is to implement a set of near-archive, early-stage operations that are a common starting point in many of these analysis workflows. For example, it is important that a system be able to compute maximum, minimum, sum, count, average, variance, and difference operations such as:
result <= average(variable, (t0, t1), ((x0, y0, z0), (x1, y1, z1))) that return, as in this example, the average value of a variable when given its name, a temporal extent, and a spatial extent. Because of their widespread use, these simple operations—
microservices, if you will—function as "canonical operations"
with which more complex opeations can be built. This is an active area of research with many analytic frameworks in development [20–22]. However, our work with its current focus on workflow stratification, microservices, and the client-side construction of complex operations using server-side microservices is distinctive [23]. And, by implementing basic descriptive statistics and other primitive operations over data Fig. 2. The as-implemented architecture of the NASA ESGF
cyber-infrastructure comprises a series of workflow stages that combine Apache OODT software, NetCDF operators, OPeNDAP, Apache Solr, and the ESGF publishing toolkit.
in a high-performance compute-storage environment using powerful analytical software, the system is able to support more complex analyses, such as the predictive modeling, machine learning, and neural networking approaches often associated with advanced analytics.
C. Domain-specific application programming interfaces
CAaaS capabilities are exposed to clients through a RESTful Web services interface. In order to make these capabilities easier to use, we are building a client-side Climate Data Services (CDS) application programming interface (API) that essentially wraps REST interface’s Web service endpoints and presents them to client applications through a library of Python-based methods. With this arrangement, application developers have the option of coding against the REST interface directly or using the CDS API Python’s library and with its more familiar method syntax.
APIs can take many forms, but the goal for all APIs is to make it easier to implement the abstract capabilities of a system. In building the CDS API, we are trying to provide for climate science a uniform semantic treatment of the combined functionalities of large-scale data management and server-side analytics. We do this by combining concepts from the Open Archive Information Systems (OAIS) reference model, highly dynamic object-oriented programming APIs, and Web 2.0 resource-oriented APIs.
The OAIS reference model, defined by the Consultative Committee on Space Data Systems, addresses a full range of archival information preservation functions including ingest, archival storage, data management, access, and dissemination—full information lifecycle management. OAIS provides examples and some "best practice" recommendations and defines a minimal set of responsibilities for an archive to be called an OAIS [25]. These high-level services provide a vocabulary that we have adopted for the CDS Reference Model and associated Library and API.
The CDS Reference Model is a logical specification that presents a single abstract data and analytic services model to calling applications. The Reference Model can be implemented using various technologies; in all cases, however, actions are based on the following six primitives:
Ingest Submit data to a service
Query Retrieve data from a service (synchronous)
Order Request data from a service (asynchronous)
Download Retrieve data from a service
Status Track progress of service activity
Execute Initiate a service-definable extension.
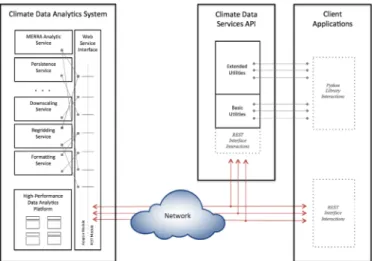
Within this OAIS-inspired framework, the Python-based CDS Library sits atop a RESTful Web services client that encapsulates inbound and outbound interactions with various climate data services (Fig. 3). These provide the foundation upon which we have also built a CDS command line interpreter (CLI) that supports interactive sessions. In addition, Python scripts and full Python applications can use methods imported from the API. The resulting client stack can be
distributed as a software package or used to build a cloud-based service (SaaS) or distributable cloud image (PaaS).
Unlike other APIs, our approach focuses on the specific analytic requirements of climate science and unites the language and abstractions of collections management with those of high-performance analytics. Doing so reflects at the application level the confluence of storage and computation that is driving big data architectures of the future.
D. MERRA Analytic Services
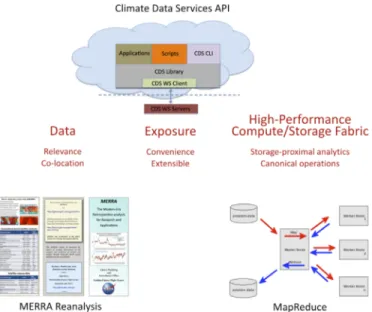
The MERRA Analytic Services (MERRA/AS) project brings these elements together in an end-to-end demonstration of CAaaS (Fig. 4). MERRA/AS enables MapReduce analytics over NASA’s Modern-Era Retrospective Analysis for Research and Applications (MERRA) data collection. The MERRA reanalysis integrates observational data with numerical models to produce a global temporally and spatially consistent synthesis of key climate variables [25]. The effectiveness of MERRA/AS has been demonstrated in several applications, and the work is contributing new ideas about how a next generation cyberinfrastructure for climate data analytics might be designed.
In simple terms, our vision for MERRA/AS is that it allows MERRA data to be stored in a Hadoop Distributed File System (HDFS) on a MERRA/AS cluster. Functionality is exposed through the CDS API. The API exposures enable a basic set of operations that can be used to build arbitrarily complex workflows and assembled into more complex operations (which can be folded back into the API and MERRA/AS service as further extensions). The complexities of the underlying mapper and reducer codes for the basic operations are encapsulated and abstracted away from the user, making these common operations easier to use.
The Apache Hadoop software library is the classic framework for MapReduce distributed analytics. We are using Cloudera, the 100% open source, enterprise-ready distribution of Apache Hadoop. Cloudera is integrated with configuration and administration tools and related open source packages. The total size of the MERRA/AS HDFS repository is Fig. 3. Notional architecture of a CAaaS system. Applications have the option of reaching services directly through the system’s Web service REST interface or through the CDS API’s Python libraries.
approximately 480 TB. Currently, MERRA/AS is running on a 36-node Dell cluster that has 576 Intel 2.6 GHz SandyBridge cores, 1300 TB of raw storage, 1250 GB of RAM, and a 11.7 TF theoretical peak compute capacity. Nodes communicate through a Fourteen Data Rate (FDR) Infiniband network having peak TCP/IP speeds in excess of 20 Gbps.
The canonical operations that implement MERRA/AS’s maximum, minimum, count, sum, difference, average, and variance calculations are Java MapReduce programs that are ultimately exposed as simple references to CDS Library methods or as Web services endpoints. There is a substantial code ecosystem behind these apparently simple operations, nearly 6000 lines of Java code being offloaded from the user to the MERRA/AS service.
E. MERRA/AS in use
MERRA/AS currently is in beta testing with about two dozen partners across a wide range of organizations and topic areas. It operates at a NASA Technology Readiness Level of seven (TRL 7) as a prototype deployed in an operational environment at or near scale of the production system, with most functions available for demonstration and test. While the system is not available for open beta testing to the general public, arrangements can be made to test the system through NASA’s Climate Model Data Services [27].
In one beta application, MERRA/AS's web service is providing data to the RECOVER wildfire decision support system, which is being used for post-fire rehabilitation planning by Burned Area Emergency Response (BAER) teams within the US Department of Interior and the US Forest Service [28]. This capability has lead to the development of new data products based on climate reanalysis data that until now were not available to the wildfire community.
In our largest deployment exercise to date, the CDS Client Distribution Package and the CDS API have been used by the iPlant Collaborative to integrate MERRA data and MERRA/AS functionality into the iPlant Discovery Environment. iPlant is a virtual organization created by a cooperative agreement funded by the US National Science Foundation (NSF) to create cyberinfrastructure for the plant sciences. The project develops computing systems and software that combine computing resources, like those of TeraGrid, and bioinformatics and computational biology software. Its goal is easier collaboration among researchers with improved data access and processing efficiency. Primarily centered in the US, it collaborates internationally and includes a wide range of governmental and private-sector partners [29].
Initial results have shown that analytic engine optimizations can yield near real-time performance of MERRA/AS's canonical operations and that the total time required to assemble relevant data for many applications can be significantly reduced, often by as much as two to three orders of magnitude [24].
V. NEXT GENERATION CYBERINFRASTRUCTURE FOR ENHANCED INTEROPERABILITY
Big data challenges are sometimes viewed as problems of large-scale data management where solutions are offered through an array of traditional storage and archive theories and technologies. These approaches tend to view big data as an issue of storing and managing large amounts of structured data for the purpose of finding subsets of interest. Alternatively, big data challenges can be viewed as knowledge management problems where solutions are offered through an array of analytic techniques and technologies. These approaches tend to view big data as an issue of extracting meaningful patterns from large amounts of unstructured data for the purpose of finding insights of interest.
As the ESGF community grapples with its scaling challenges, it seeks to find a balance between these competing views. This is evident in the charge that the ESGF Compute Working Team (ESGF-CWT)—the international team of collaborators responsible for designing ESGF's "next generation" architecture—has laid out for itself. The Team's overarching goal is to increase the analytical capabilities of the enterprise, primarily by exposing high-performance computing resources and analysis tools to the community through Web services [30]. Ideally, ESGF data from the Federation's distributed collections would be united with the Web-accessible tools and compute resources needed to perform advanced analytics at the scale needed for IPCC’s increasingly complex work.
However, integrating high-performance computing and high-performance analytics—finding an optimal storage-compute balance in ESGF's ecosystem of distributed resources—is not a trivial exercise. ESGF's technical heritage is that of a large-scale distributed archive. Its nodes basically store and distribute data. They typically support compute resources sufficient to stream data out of storage onto the Fig. 4. The MERRA Analytic Service provides an end-to-end demonstration
of the principals underlying Climate Analytics-as-a-Service: important data embedded in a high-performance storage-compute environment where analytic services are exposed via Web services to client-side applications through an easy-to-use client-side API tailored to the climate research community.
network for client consumption, and the behaviors implemented and exposed by ESGF's Web service interface are the basic discovery and download operations of an archive. Currently, the ESGF is looking to the geospatial community for ideas on how to strike a balance between data analytics and data storage. Improved access to distributed compute and storage resources has been achieved in the geographic information systems (GIS) community through a series of standards-making activities aimed at enhancing machine-to-machine interoperabity, one of the most notable being the work of the Open Geospatial Consortium (OGC). OGC is an international industry consortium of over five hundred companies, government agencies, and universities participating in a consensus process to develop publicly available interface standards. OGC’s abstract specifications and implementation standards are designed to support interoperable solutions that "geo-enable" a wide range of hardware platforms and software applications [31]. To see how improved machine-to-machine interoperability can lead to increased analytic capabilities across distributed storage systems, it is helpful to understand Web services and the role that Web APIs play in the discussion.
A. Web services and domain-specific API enhancements
As described above, in the world of Web services, there are two types of interfaces. On the service side, a system interface maps the methods, functions, and programs that implement the service's capabilities to Hypertext Transfer Protocol (HTTP) messages that expose the service's capabilities to the outside world. Client applications can consume these Web service endpoints to access services. The World Wide Web Consortium (W3C) views Web services as a way to insure machine-to-machine interoperability [32]. The precise messaging format can vary from community to community, often reflecting the specialized functions or audiences they serve. Significant standards activities have grown up around the design and implementation of such Web services.
There also are the classic client-side APIs familiar to application developers. Generally, these comprise local libraries that reside on the developer’s host computer and can be statically or dynamically referenced by client applications. They speed development, reduce error, and often implement abstractions that are specialized to the needs of the audiences they serve. They can be used to build applications, workflows, and domain-specific toolkits, workbenches, and integrated development environments (IDEs). Building on the concepts underlying CAaaS, the ESGF-CWT is working at both levels.
B. Implementation approach
The ESGF-CWT is adopting OGC’s Web Processing Service (WPS) interface standard for its next generation architecture [33]. WPS is essentially an xml-based remote procedure call (RPC) protocol for invoking processing capabilities as Web services. It has been used in the geospatial community for delivering low-level geospatial processing services. However, WPS can be generalized to other types of applications and data because of its simplicity: WPS uses a
single operation (Execute) to invoke remote services; its two other operations (GetCapabilities and DescribeProcess) are used for discovery and to query services for information necessary to build signatures needed by Execute operations.
ESGF can improve interoperability and accessibility by defining ESGF community standards at one or more places in its Web services architecture. First, ESGF can define an ESGF
Compute Node Service Specification—an agreed upon
capability and naming convention for each conformant compute node. Regardless of how the services are accessed, each node would have known capabilities implemented in known ways. Second, ESGF can define an ESGF WPS
Extension Specification—a specialization of the WPS standard
wherein the syntax and semantics of required and optional fields of WPS response documents are tailored to the needs of the ESGF. With this approach, regardless of how services are implemented or named, their means of access is commonly understood within the Federation. Finally, ESGF can define an
ESGF API—a client-side API that consumes the Web service
endpoints exposed by a WPS-compliant ESGF service and presents them to client applications as a library of easy-to-use function calls tailored to the needs of the ESGF community. Here, regardless of implementation and communication details, programmers could access node capabilities using a familiar programming library.
The ESGF-CWT is developing options two and three: an ESGF WPS Extension Specification and an accompanying client-side ESGF API along the lines of the CDS API (Fig.3). A reference implementation of an ESGF Multi-Model Averaging Service will be released soon. These enhancements will be of value to the ESGF community because they will improve interoperability at two levels within ESGF’s overall architecture. Greater system-to-system interoperability improves connectivity and, in the case of WPS, allows the ESGF community to avail itself of WPS-compliant capabilities that exist within the geospatial community; having an API makes it easier to create toolkits, workbenches, and plug-ins tailored to the ESGF that can improve efficiencies and communication within the community.
VI. CONCLUSION
The climate research activities that provided the basis for IPCC’s 2013 Fifth Assessment Report worked with about two petabytes of data. It is estimated that the research community’s collective work on the Sixth Assessment Report, which will probably be released around 2020, will generate as much as 100 petabytes of data [7]. The ESGF provides the primary cyberinfrastructure to support this global scientific collaboration. Clearly, IPCC’s success depends on our ability to scale ESGF capabilities to accommodate the big data challenges posed by this effort. The technology enhancements described here will not provide a comprehensive solution to the challenges facing the climate science community. But they do represent important threads of development that we believe are on the path to a significantly improved next generation cyberinfrastructure for climate science.
REFERENCES
[1] C. Snijders, U. Matzat, and U. D. Reips, “Big data: big gaps of knowledge in the field of Internet science,” Int. J. Internet Science, vol. 7, no. 1, pp. 1–5, 2012. Available: http://www. ijis.net/ijis7_1/ ijis7_1_editorial.pdf.
[2] P. N. Edwards, A Vast Machine: Computer Models, Climate Data, and the Politics of Global Warming. Cambridge, MA: MIT Press, 2010, 518 pp.
[3] J. L. Schnase, D. Q. Duffy, G. S. Tamkin, D. Nadeau, J. H. Thompson, C. M. Grieg, M. A. McInerney, and W. P. Webster, “MERRA Analytic Services: Meeting the Big Data challenges of Climate Science through Cloud-Enabled Climate Analytics-as-a-Service,” Computers, Environment and Urban Systems, 2014. [In Press]. doi: 10.1016/ j.compenvurbsys.2013.12.003.
[4] S. L. Star, “The politics of formal representations: Wizards, gurus and organizational complexity,” in Ecologies of Knowledge: Work and Politics in Science and Technology, S. L. Star, Ed., Albany, NY: SUNY Press, 1995, pp 88–118.
[5] J. L. Schnase, M. A. Lane, B. C. Bowker, S. L. Star, and A. Silberschatz, “Building the next generation biological information infrastructure,” in
Proc. 1997 National Academy of Sciences Forum on Biodiversity: The Quest for a Sustainable World, Washington, DC: National Academy Press, 1997, pp. 291–300. Available: http://www.nap.edu/read/6142/ chapter/6#291.
[6] C. A. Mattmann, C. S. Lynnes, L. Cinquini, P. M. Ramirez, A. F. Hart, D. Williams, D. Waliser, and P. Rinsland, “Next generation cyberinfrastructure to support comparison of satellite observations with climate models,” in Proc. 2014 Conf. on Big Data from Space (BiDS ’14), Frascati, Italy, 2014, pp. 82–85. doi:10.2788/1823.
[7] G. L. Potter, T. J. Lee, and L. Carriere, “Improving Access to Climate Model, Observational, and Reanalysis Data,” in Proc. 2014 Conf. on Big Data from Space (BiDS ’14), Frascati, Italy, 2014, pp. 86–89. doi:10.2788/1823.
[8] J. L. Schnase, D. Q. Duffy, M. A. McInerney, W. P. Webster, T. J. Lee, “Climate Analytics as a Service,” in Proc. 2014 Conf. on Big Data from Space (BiDS ’14), Frascati, Italy, 2014, pp. 90–94. doi:10.2788/1823. [9] J. T. Overpeck, G. A. Meehl, S. Bony, and D. R. Easterling, “Climate
data challenges in the 21st century,” Science, vol. 331, 2011, pp. 700– 702. doi:10.1126/science.1197869.
[10] Intergovernmental Panel on Climate Change (IPCC), http://www.ipcc.ch/organization/organization.shtml.
[11] Climate Model Intercomparison Project (CMIP), http://cmip-pcmdi. llnl.gov.
[12] K. E. Taylor, R. J. Stouffer, and G. A. Meehl, “An Overview of CMIP5 and the experimental design,” Bull. Amer. Meteor. Soc., 2012, vol. 93, no. 4, pp 485–498. doi:10.1175/BAMS-D-11-00094.1.
[13] Earth System Grid Federation (ESGF), http://pcmdi9.llnl.gov/esgf-web-fe/.
[14] L. Cinquini,, D. Crichton, C. Mattmann, J. Harney, G. Shipman, F. Wang, R. Ananthakrishnan, N. Miller, S. Denvil, M. Morgan, Z. Pobre, G. M. Bell, C. Doutriaux, R. Drach, D. Williams, P. Kershaw, S. Pascoe, and E. Gonzalez, “The Earth System Grid Federation: An open infrastructure for access to distributed geospatial data,” Futur. Gener. Comput. Syst., vol. 36, 2014, pp. 400–417. doi: 10.1016/ j.future.2013.07.002.
[15] P. Gleckler, R. Ferraro, and D. Waliser, “Improving use of satellite data in evaluating climate models,” EOS Trans. Am. Geophys. Union, vol. 92, no. 20, 2011, p. 172. doi: 10.1029/2011EO200005.
[16] M. G. Bosilovich, A. H. Chaudhuri, and M. Rixen, “Earth system reanalysis: Progress, challenges, and opportunities,” Bull. Am. Meteorol. Soc , vol. 94, no. 8, 2013, pp. 110–113. doi: 10.1175/BAMS-D-12-00191.1.
[17] K. H. Rosenlof, L. Terray, C. Deser, A. Clement, H Goosee, and S. Davis, “Changes in variability associated with climate change,” in
Climate Science for Serving Society, G. R. Asrar and J. W. Hurrell, Eds., New York: Springer, 2013, pp. 249–271. doi:10.1007/978-94-007-6692-1.
[18] C. Mattmann, A. Braverman, and D. Crichton, “Understanding architectural tradeoffs necessary to increase climate model intercomparison efficiency,” ACM SIGSOFT Soft. Eng. Notes, vol. 35, no. 3, 2010, pp. 1–6.
[19] C. Mattmann, D. Crichton, N. Medvidovic, and S. Hughes, “A software architecture-based framework for highly distributed and data intensive
scientific applications,” in Proc. Int. Conf. Soft. Eng. (ICSE), Shanghai, China, 2006, pp. 721–730.
[20] Analytics and Informatics Management Systems (AIMS), http://aims.llnl.gov/mission.html.
[21] C. Pagé, S. Joussaume, M. Juckes, W. S. de Cerff, M. Pleiger, E. de Vreede, L. Barring, M. Kolax, R. Hutjes, F. de Jong, E. Bucchignani, N. Tatarinova, and A. Cofiño, “Providing and facilitating climate model data access in Europe: IS-ENES and CLIPC initiatives,” presented at the 14th European. Meteorol. Soc. (EMS) Annual Meeting and 10th European Conf. on Applied Climatology (ECAC), Prague, Czech Republic, 2014. Available: http://presentations.copernicus.org/EMS2014-265_presen tation.pdf.
[22] S. Fiore, A. D’Anca, C. Palazzo, I. Foster, D. N. Williams, and G. Aloisio, “Ophidia: Toward big data analytics for eScience,” Procedia Computer Science, vol. 18, 2013, pp. 2376–285. doi: 10.1016/j.procs.2013.05.409
[23] J. L. Schnase, “Climate analytics as a service,” presented at the European Centre for Medium-Range Weather Forecasts (ECMWF) Copernicus Climate Change Service (C3S) Data Store Workshop, Reading, UK, 2014. Available: http://www.ecmwf.int/sites/default/ files/COP-CDS-WS-Schnase.pdf.
[24] J. L. Schnase, “Climate analytics as a service,” in Cloud Computing in the Ocean and Atmospheric Sciences, T. C. Vance, N. Merati, C. Yang, M. Yuan, Eds., New York: Elsevier. [In Press].
[25] Open Archive Information System (OAIS) Reference Model, http://public.ccsds.org/sites/cwe/rids/Lists/CCSDS%206500P11/Attach ments/650x0p11.pdf.
[26] M. M. Rienecker, M. J. Suarez, R. Gelaro, R. Todling, J. Bacmeister, E. Liu, M. G. Bosilovich, S. D. Schubert, L. Takacs, G-K. Kim, S. Bloom, J. Chen, D. Collins, A. Conaty, A. da Silva, W. Gu, J. Joiner, R. D. Koster, R. Lucchesi, A. Molod, R. Owens, S. Pawson, P. Pegion, C. R. Redder, R. Reichle, F. R. Robertson, A. G. Ruddick, M. Sienkiewicz, and J. Woollen, “MERRA: NASA’s Modern-Era Retrospective Analysis for Research and Applications,” J. Climate, vol. 24, no. 14, pp. 3624– 3648. doi: 10.1175/JCLI-D-11-00015.1.
[27] NASA Climate Model Data Services, https://cds.nccs.nasa.gov/wp-content/test/.
[28] J. L. Schnase, M. L. Carroll, K. T. Weber, M. E. Brown, R. L. Gill, M. Wooten, J. May, K. Serr, E. Smith, R. Goldsby, K. Newtoff, K. Bradford, C. Doyle, E. Volker, and S. Weber, “RECOVER: An automated cloud-based decision support system for post-fire rehabilitation planning,” in Proc. Int. Soc. Photogrammetry and Remote Sensing, C. Toth, T. Holm, and B. Jutzi, Eds., Denver, CO, 2014, pp. 17–20. doi: 10.5194/isprsarchives-XL-1-363-2014.
[29] iPlant Collaborative, http://www.iplantcollaborative.org. [30] Dan Duffy, private communication, Dec. 2015.
[31] Open Geospatical Consortium (OGC), http://www.opengeospatial.org. [32] World Wide Web Consortium (W3C), http://www.w3.org.
[33] Web Processing Service (WPS), http://www.opengeospatial.org/ standards/wps.
John L. Schnase, along with Tsengdar
Lee, co-chaired the 2014 Big Data in Space Conference (BiDS ’14) special session on “Big Data Challenges in Climate Science” upon which this article is based. Dr. Schnase attended Angelo State University, the University of Texas at Austin, Baylor College of Medicine, and Texas A&M University, where he received the Ph.D. degree in computer science in 1992.
Before joining NASA in 1999, his work on the natural history of Cassin’s Sparrow (Aimophila cassinii) resulted in an early application of computers in avian energetics modeling. Currently, he is the climate informatics focus area lead in NASA Goddard Space Flight Center's Office of Computational and Information Sciences and Technology, where his work focuses on the development of advanced information systems to support the Earth sciences. He also
holds adjunct faculty appointments at George Mason University and the University of Maryland, College Park.
Dr. Schnase is former Director of the Center for Botanical Informatics at the Missouri Botanical Garden and former Director of the Advanced Technology Group at Washington University School of Medicine. He is a Fellow of the American Association for the Advancement of Science (AAAS), a member of the Executive Committee of the Computing Accreditation Commission (CAC) of ABET, a former member of the President’s Council of Advisors on Science and Technology (PCAST) Panel on Biodiversity and Ecosystems, and currently Co-Chairs the Ecosystems Societal Benefit Area of the Office of Science and Technology Policy (OSTP) National Observation Assessment.
Tsengdar J. Lee received the M.S.
degree in civil engineering in 1988, and the Ph.D. degree in atmospheric science in 1992 from Colorado State University, Fort Collins, CO. Trained as a short-term weather modeler, his work focused on the integration of weather and ancillary geographical information data into weather models to produce reliable forecasts. His research pioneered the modeling of land surface hydrology’s impact on weather forecasting.
Prior to joining NASA in 2001, Dr. Lee held positions as Senior Technical Advisor with Northrop Grumman Information Technology and Senior Staff Engineer with Litton PRC. He worked on the Advanced Weather Information Processing System (AWIPS) for the National Weather Service, where he was responsible for the rapid development, integration, and commercialization of the AWIPS client-server system. Lee also was a principal engineer on the effort to develop the AWIPS network monitoring and control system.
Dr. Lee currently manages the High-End Computing Program at NASA Headquarters, where he is responsible for maintaining the high-end computing capability to support the agency's aeronautics research, human exploration, scientific discovery, and space operations missions. He is the NASA Weather focus area lead. In this role, he is responsible for advanced planning for weather research and development priorities. Between 2011 and 2012, Dr. Lee served as the acting CTO for IT at NASA, at which time he funded the agency's computing service initiatives, including OpenStack.