REMO: Resource-Aware Application State Monitoring
for Large-Scale Distributed Systems
Shicong Meng
†Srinivas R. Kashyap
‡Chitra Venkatramani
‡Ling Liu
† †College of Computing, Georgia Institute of Technology, Atlanta, GA 30332, USA
{
smeng, lingliu
}
@cc.gatech.edu
‡
IBM Research T.J. Watson, Hawthorne, NY 10532, USA
{
srkashya, chitrav
}
@us.ibm.com
Abstract
To observe, analyze and control large scale distributed systems and the applications hosted on them, there is an increasing need to continuously monitor performance at-tributes of distributed system and application states. This results in application state monitoring tasks that require fine-grained attribute information to be collected from relevant nodes efficiently. Existing approaches either treat multiple application state monitoring tasks independently and build ad-hoc monitoring trees for each task, or construct a single static monitoring tree for multiple tasks. We argue that a careful planning of multiple application state monitoring tasks by jointly considering multi-task optimization and node level resource constraints can provide significant gains in performance and scalability.
In this paper, we present REMO, a REsource-aware application state MOnitoring system. REMO produces a forest of optimized monitoring trees through iterations of two phases, one phase exploring cost sharing opportunities via estimation and the other refining the monitoring plan through resource-sensitive tree construction. Our experimen-tal results include those gathered by deploying REMO on a BlueGene/P rack running IBM’s large-scale distributed streaming system - System S. Using REMO in the context of running over 200 monitoring tasks for an application deployed across 200 nodes results in a 35%-45% decrease in the percentage error of collected attributes compared to existing schemes.
1. Introduction
Large-scale distributed systems such as cloud computing systems [1] and stream-processing systems [2], [3] allow multiple applications to be deployed over different sets of hosts. These systems pose interesting challenges for monitoring the functioning of both systems and applications running on them. We refer to the task of continuously mon-itoring the state of applications deployed on such systems as application state monitoring, which is essential for the observation, analysis and control of these systems and the long running applications they host.
Application state monitoring requires continuously mon-itoring and collecting performance attribute values, such as CPU-usage, memory-usage, data rate, packet size
distribu-tion, and any number of custom attributes at the applica-tion level. In many cases, it is useful to collect detailed performance attributes at a controlled collection frequency. For instance, fine-grained performance characterization in-formation is required to construct various system models and to test hypotheses on system behavior. Similarly, the data-rate and buffer occupancy in each element of a distributed application may be required for diagnosis purposes when there is a perceived bottleneck. As the scale of the system, application and monitoring tasks increases, the overhead of the state monitoring and attribute collection can become prohibitive.
A large body of research addresses the design of dis-tributed monitoring systems and has mainly focused on executing single monitoring tasks efficiently (TAG [4], SDIMS [5], PIER [6], approximate quantiles [7], [8], join aggregations [9], REED [10], operator placement [11]). These approaches use either static monitoring trees [12], [11], where a pre-constructed monitoring tree is used for all monitoring tasks across all applications, or construct monitoring trees for individual monitoring tasks indepen-dently [6].
We argue that these approaches suffer from two major drawbacks. Firstly, performing multiple application state monitoring tasks using either a pre-constructed single mon-itoring tree or constructing one state monmon-itoring tree for each application may result insub-optimal monitoring plan. For example, if two tasks are performed over the same set of nodes, using one monitoring tree for monitoring data transmission is more efficient than using two, as nodes can merge updates for both tasks and reduces per-message processing overhead. While finding an optimal monitoring network becomes much more complicated as the size of the system, the number of monitoring tasks, and the duration of monitoring increase, it is critical for the monitoring scalability.
Secondly, these approaches fail to consider node level resource constraints in the construction of state monitoring trees, and thus, suffer fromnode overloadand consequently
serious monitoring data loss. This problem gets worse in application state monitoring, as the collecting of individual attribute values from different nodes in large scale dis-tributed systems demands considerable resources and nodes may dedicate most of their capacities for application hosting.
Without considering resource constraints in state monitoring planning, these approaches may cause certain nodes to be assigned with excessive monitoring workload, leading undesirable performance degradation. Thus, we envision that application state monitoring in large scale distributed systems should be scalable, efficient, and resource-aware.
In this paper, we argue that a careful planning of multiple application state monitoring tasks by jointly considering
multi-task optimizationandresource-constrained monitoring tree construction can provide significant gains in perfor-mance and scalability. We present REMO, a resource-aware application state monitoring system, which produces a forest of optimized monitoring trees through iterations of two procedures. One procedure explores opportunities for shar-ing per-message processshar-ing overhead based on performance estimation. The other procedure refines the monitoring plan produced in the previous procedure by building monitoring trees with a resource sensitive tree construction algorithm.
We undertake an experimental study of our system and present results including those gathered by deploying REMO on a BlueGene/P rack (using 256 nodes booted into Linux) running IBMs largescale distributed streaming system -System S. The results show that our resource-aware ap-proach for application state monitoring consistently outper-forms the current best known schemes for multiple applica-tion state monitoring. For instance, in our experiments with a real application that spanned up to 200 nodes and about as many monitoring tasks, using REMO to collect attributes resulted in a 35%-45% reduction in the percentage error of the attributes that were collected.
This paper makes two unique contributions:
• We characterize and identify two important require-ments for efficient application state monitoring in large scale distributed systems: the sharing of message pro-cessing cost among attributes and considering node level resource constraints. These two requirements are essential for the scalability of monitoring and existing approaches failed to address them.
• We develop a framework for communication-efficient application state monitoring, whichjointly solves prob-lems of multiple monitoring task optimization and resource-aware monitoring network construction. To our best knowledge, REMO is the first system that promotes resource-aware methodology to support and scale multiple application state monitoring tasks in large scale distributed systems.
2. System Overview
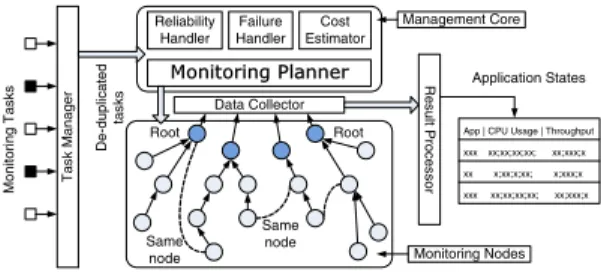
Figure 1 illustrates the architecture of our REMO system. Thetask managertakes state monitoring tasks and removes duplication among application state monitoring tasks. These de-duplicated tasks are then feed to the management core, where the monitoring planner carries out the resource aware multi-task optimization by organizing monitoring nodes into a forest of optimized monitoring trees. The management core also provides support for reliability enhancement and failure handling. The data collector module provides a library
M oni to ri n g Ta sks Root Same node Same node Root Monitoring Planner Cost Estimator Ta sk Ma nag er Reliability Handler Re sult Pro c essor Data Collector Failure Handler Monitoring Nodes Management Core Application States
App | CPU Usage | Throughput xxx xx;xx;xx;xx; xx;xxx;x xx x;xx;x;xx; x;xxx;x xxx xx;xx;xx;xx; xx;xxx;x D e -dup lica ted ta s k s
Figure 1: A Simplified System Architecture
for efficient collecting attribute values from the monitoring network. Theresult processorexecutes the concrete monitor-ing operations includmonitor-ing collectmonitor-ing and aggregatmonitor-ing attribute values, triggering warnings, and etc. In this paper, we focus on the design of the monitoring planner.
Application state monitoring tasks are long running ac-tivities used for observation, analysis, and control of large scale distributed systems or applications they host. Each task periodically collects values of certain attributes from the set of nodes over which an application is running. Formally, we define an application state monitoring taskt as follows:
Definition 1: A monitoring taskt= (At, Nt)is a pair of sets, whereAt⊆i∈NtAiis a set of attributes andNt⊆N is a set of nodes. In addition,tcan also be represented as a list of node-attribute pairs(i, j), wherei∈Nt, j∈At.
As such systems run multiple applications simulta-neously and may monitor many facets of an applica-tion, more often than not, different monitoring tasks may share duplicated monitored attributes. For instance, monitoring tasks t1 = ({cpu utilization},{a, b}) and t2 = ({cpu utilization},{b, c}) have duplicated mon-itored attribute cpu utilization on node b. With such duplication, node b has to send cpu utilization infor-mation twice for each update, which is clearly unnec-essary. Therefore, given a set of monitoring tasks, the task manager transforms this set of tasks into a list of attribute pairs and eliminates all duplicated node-attribute pairs. For instance, t1 and t2 are equivalent to the list {a-cpu utilization, b-cpu utilization} and { b-cpu utilization, c-cpu utilization} respectively. In this case, node-attribute pair{b-cpu utilization}is duplicated, and thus, is eliminated from the output of the task manager. Given a list of node-attribute pairs, the monitoring planner organizes associated nodes into a forest of monitoring trees, each of which collects values for a set of attributes. One monitoring node may connect to multiple trees (as shown in Figure 1 and 3(c)). Within a monitoring tree T, each node i periodically sends an update message to its parent. Such update messages include both values locally observed by node i and values sent by i’s children, for attributes monitored byT. This process continues upwards in the tree until the message reaches the central data collector node.
Each monitoring node has a set of observable attributes Ai={aj|j ∈[1, m]}. Attributes at different nodes but with the same subscription are considered as attributes of the same type. For instance, monitored nodes may all have
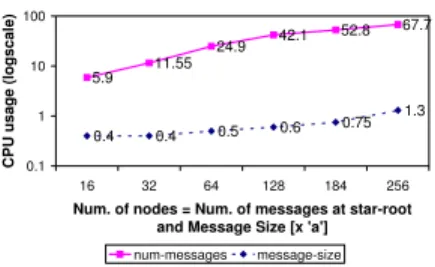
lo-5.9 11.55 24.9 42.1 52.8 67.7 0.4 0.4 0.5 0.6 0.75 1.3 0.1 1 10 100 16 32 64 128 184 256
Num. of nodes = Num. of messages at star-root and Message Size [x 'a']
CPU usage (logscale)
num-messages message-size
Figure 2:CPU Usage vs Increasing Message Number/Size
cally observable CPU utilization. We consider an attribute as a continuously changing variable which outputs a new value in every unit time. For simplicity, we assume all attributes are of the same sizeaand it is straightforward to extend our work to support attributes with different sizes. Each nodei, the central node or a monitoring node, has a capacitybi(also referred to as the resource constraint of nodei) for receiving and transmitting monitoring data. In addition, each message transmitted in the system is associated with a per-message overheadC, and, correspondingly, the cost of transmitting a message with xvalues is C+ax.
In our setting, we characterize the per-message overhead as processing overhead. Figure 2 shows how significant the per-message processing overhead is. The measurements were performed on a BlueGene/P node which has a 4-core 850MHz PowerPC processor. The figure shows an example monitoring task where nodes are configured in a star network where each node periodically transmits a single fixed small message to a root node. The CPU utilization of the root node grows roughly linearly from around6%for16 nodes (the root receives 16 messages periodically) to around68% for256nodes (the root receives 256 messages periodically). Note that this increased overhead is due to the increased number of messages at the root node and not due to the increase in the total size of messages. The cost incurred to receive a single small message of size a is around 0.2% while the cost incurred to receive a single message of size
256ais still around1.4%(see Figure 2). In other scenarios, the per-message overhead could be transmission or protocol overhead. For instance, a typical monitoring message deliv-ered via TCP/IP protocol has a message header of at least 78 bytes not including application-specific headers, while an integer monitoring data is just 4 bytes.
2.1. Challenges in Monitoring Planning
From the users’ perspective, monitoring results should be as accurate as possible, suggesting that the underlying monitoring network should maximize the number of node-attribute pairs received at the central node. In addition, such a monitoring network should not cause the excessive use of resource at any node. Accordingly, we define the monitoring planning problem (MP) as follows:
Problem Statement 1: Given a set of node-attribute pairs for monitoring Ω = {ω1, ω2, . . . , ωp} where ωq = (i, j), i∈N,j ∈A,q∈[1, p], and resource constraintbi for each associated node, find a parent f(i, j),∀i, j, where j ∈ Ai
such that node i forwards attribute j to node f(i, j) that maximizes the total number of node-attribute pairs received at the central node and the resource demand of nodei,di, satisfiesdi≤bi,∀i∈N.
NP-completeness. When restricting all nodes to only
monitor the same attribute j, we obtain a special case of the monitoring planning problem where each node has at most one attribute to monitor. As shown by [13], this special case is a NP-complete problem. Consequently, the MP is a NP-Complete problem, since each instance of MP can be restricted to this special case. Therefore, in REMO, we primarily focus on efficient approaches that can deliver reasonably good monitoring plans.
We now use some intuitive examples to illustrate the challenges and key questions that need to be addressed in designing a resource-aware monitoring planner. Consider examples in Figure 3, where we have 6 monitoring nodes in the system and each monitors a set of attributes indicated by alphabets on nodes. Example (a) shows a widely used topol-ogy in which every nodes send their updates directly to the central node. This topology, however, has poor scalability, because it requires the central node to have a large amount of resources to account for per-message overhead. Example (b) organizes all nodes in a single tree which delivers updates for all attributes. While this topology reduces the resource consumption at the central node, the root node now has to relay updates for all node-attribute pairs, and again faces scalability issues due to limited resources. These two examples suggest that achieving certain degree of load balancing is critical.
Unfortunately, load balance alone does not lead to a good monitoring plan. In example (c), to balance the traffic among nodes, the central node uses three trees, each of which delivers only one attribute, and thus achieves a more bal-anced workload among nodes compared with example (b). However, since each node monitors at least two attributes, nodes have to send out multiple update messages instead of one as in example (a). Due to per-message overhead, this plan leads to higher resource consumption at almost every
node. As a result, certain nodes may still fail to deliver all updates and less resources will be left over for additional monitoring tasks.
The above examples reveal two fundamental aspects of the monitoring planning problem:
• How to determine the number of monitoring trees and the set of attributes on each? This is a non-trivial problem. Example (d) shows a topology which uses one tree to deliver attributea,b and another tree to deliver attribute c. It introduces less per-message overhead compared with example (c) and is a more load-balanced solution compared with example (b).
• How to determine the topology of each monitoring tree under node level resource constraints? Constructing monitoring trees subject to resource constraints at nodes is also a non-trivial problem and the choice of topology can significantly impact the resource usage on the participating nodes. Example (e) shows three different
C entral N ode abc ac ac bc bc abc a,c a,c a,b,c
(a) Star collection
C entral N ode abc ac ac bc bc abc a,b,c (b) One-Set collection C entral N ode a c a c b c b c a b c b c a a b c (c) Singleton-Set collection C entral N ode a c a c b c b c ab c c ab a,b c (d) Optimal collection STAR CHAIN MIXED
(e) Different Trees
Figure 3:Motivating examples for the topology planning problem.
trees. The star topology (upper left), while introduces the least relaying cost, causes significant per-message overhead at its root. The chain topology (upper right), on the contrary, distributes the per-message overhead among all nodes, but causes the most relaying cost. A “mixed” tree (bottom) might achieve a good trade-off between relaying cost and per-message overhead, but it is difficult to determine its optimal topology.
3. The REMO Approach
The REMO approach promotes the resource aware multi-task optimization framework, consisting of a two phase iterative process and a suite of multi-task optimization tech-niques. At a high level, REMO operates as a guided local search approach, which starts with an initial monitoring network composed of multiple independently constructed monitoring trees, and iteratively optimizes the monitoring network until no further improvements are possible. When exploring various optimization directions, REMO employs cost estimation to guides subsequent improvement so that the search space can be restricted to a small size. This guiding feature is essential for the scalability of REMO.
Concretely, during each iteration, REMO first runs a
partition augmentationprocedure which generates a list of most promising candidate augmentations for improving the current distribution of monitoring workload among monitor-ing trees. While the total number of candidate augmentations is very large, this procedure can trim down the size of the candidate list by selecting the most promising ones through cost estimation. Given the generated candidate augmentation list, theresource-aware evaluationprocedure further refines candidate augmentations by building monitoring trees ac-cordingly with resource-aware tree construction algorithm.
3.1. Partition Augmentation
The partition augmentation procedure is designed to pro-duce the attribute partitions that can potentially repro-duce per-message processing cost through a guided iterative process. These attribute partitions determine the number of monitor-ing trees in the forest and the set of attributes each tree delivers. To better understand the design principles of our approach, we first briefly describe two simple but essentially the-state-of-the-art schemes in multi-task monitoring.
Recall that among example schemes in Figure 3, one scheme (example (c)) delivers each attribute in a separate tree, and the other scheme (example (b)) uses a single tree
to deliver updates for all attributes. We refer to these two schemes as the Singleton-set partition scheme (SP)and the
One-set partition (OP) scheme respectively. We use the term “partition” because these schemes partition the set of monitored attributes into a number of non-overlapping subsets and assign each subsets to a monitoring tree.
Singleton-Set Partition (SP). Specifically, given a set
of attributesAfor collecting, singleton-set partition scheme dividesAinto|A|subsets, each of which contains a distinct attribute in A. Thus, if a node monitors m attributes, it is associated with m trees. This scheme is widely used in previous work, e.g. PIER[6], which constructs a routing tree for each attribute collection. While this scheme provides the most balanced load among trees, it is not efficient as nodes pays high cost in per-message overhead.
One-Set Partition (OP). The one-set partition scheme
uses the set A as the only partitioned set. This scheme is also used in a number of previous work[12], [11]. Using OP, each node can send just one message which includes all the attribute values, and thus, saves per-message overhead. Nevertheless, since the size of each message is larger com-pared with messages associated with SP, the corresponding collecting tree can not grow very large.
3.1.1. Exploring Partition Augmentations
REMO seeks a middle ground between these extreme solutions - one where nodes pay lower per-message over compared to SP while being more load-balanced and conse-quently more scalable than OP. Our partition augmentation scheme explores possible augmentations to a given attribute partition P by searching for all partitions that are closeto P in the sense that the resulting partition can be created by modifyingP with certain predefined operations.
We first define two basic operations for modifying at-tribute set partitions. Given two atat-tribute setsAPi andAPj in partitionP, a merge operation over APi and APj, denoted asAPi APj, yields a new setAkP =APi ∪APj . Given one attribute setAPi and an attributeα, asplitoperation onAPi with regarding toα, denoted asAPi α, yields two new sets APk =APi −α. Based on the definition of merge and split operations, we now define neighboring solution as follows:
Definition 2: For an attribute set partitionP, we say par-titionPis aneighboring solutionofP if and only if either ∃AP
i , APj ∈P so thatP=P/{APi , APj} ∪(APi APj), or
∃AP
Guided Partition Augmentation. Exploring and evaluate all neighboring augmentations of a given partition is prac-tically infeasible, since the evaluation involves constructing resource-constrained monitoring trees. To mitigate this prob-lem, we use a guided partition augmentation scheme which greatly reduces searching space. The basic idea is to rank candidate partitions according to theestimatedcost reduction that would result from using the new partition, as a partition that provides a large cost reduction will likely free up more capacity for aggregating attribute value pairs. Following this, we evaluate neighboring partitions in the decreased order of their estimated capacity-reduction so that we can find a good augmentation without evaluating all candidates.
To estimate the gain of a candidate augmentation, we first need to understand how the resource consumption would change after applying an augmentation m. Change in the total resource consumption resulting from an augmentation m can be contributed by the change in the relay cost and that in the per-message overhead cost, asmmay change the number of trees and the structure of trees. Letg(m)be the overall reduction in resource consumption of an augmen-tation m, Δcp(m) be the estimated difference in overhead cost due to m andΔcr(m) be the estimated difference in relay cost due tom. We haveg(m) = Δcp(m) + Δcr(m). We estimate g(m) assuming that following an augmen-tation, the tree construction procedure is able to assign all
the attribute-value pairs that were in the affected partitions using astar topology. Assuming a topology is necessary to be able to estimateΔcr(m). Recall thatCis the per-message overhead andais the cost of a message of unit size. Also let NAi denote the number of nodes associated with attribute
setAi. We then have:
Δcp(m) = (−1).C.|NAi∩NAj| m:Ai Aj=Ak C.|NAj ∩NAk| m:AiAj=Ak Δcr(m) = a.|NAi∪Aj−NAi∩Aj| m:Ai Aj=Ak (−1).a.|NAi−NAi∩Aj| m:AiAj=Ak
Intuitively, when we merge two attribute sets, the per-message overhead reduces as nodes associated with both sets send fewer messages for an update. However, the corresponding relaying cost may increase as the merged tree may be higher than the previous two trees, which makes messages travel more hops to reach the root. On the contrary, when we split an attribute set, the per-message overhead increases and the relaying cost decreases. The above equations capture these two changes and make the estimation possible. This guided local-search heuristic is essential to ensure the practicality of our scheme.
3.2. Resource-aware Evaluation
To evaluate the objective function for a given candidate partition augmentation m, the resource-aware evaluation examinesmby constructing trees for nodes affected by m and measures the the number of node-attribute pairs that can be collected using these trees. This procedure primarily involves two tasks. One is constructing a treefor a given set of nodes without exceeding resource constraints at any node. The other is for a node connected to multiple trees to
allocate its resourcesto different trees.
3.2.1. Tree Construction
The tree construction procedure constructs a collection tree for a given set of nodesDsuch that no node exceeds its resource constraints while trying to include as many nodes as possible into the constructed tree. Formally, we define the tree construction problem as follows:
Problem Statement 2: Given a set ofnnodes, each hasxi attributes to monitor, and resource constraintbi, find a parent p(i),∀i, so that the number of nodes in the constructed tree is maximized subject to the following constraints where ui is the resource consumed at node i for sending update messages to its parent:
1) For any nodei in the tree,p(j)=iuj+ui≤bi
2) Letyibe the number of all attribute values transmitted by nodei. We haveyi =xi+p(j)=ixj.
3) According to our definition,ui≤C+yi·a
The first constraint requires that the resource spent on nodeifor sending and receiving updates should not exceed its resource constraintbi1. The second constraint requires a node to deliver its local monitored values as well as values received from its children. The last constraint states that the cost of processing an outgoing message is the combination of per-message overhead and value processing cost. The tree construction problem, however, is also NP-Complete[13] and we present heuristics for the tree-construction problem.
We first discuss two simple tree construction heuristics:
Star. This scheme forms “star”-like trees by giving pri-ority to increasing the breadth of the tree. Specifically, it adds nodes into the constructed tree in the order of decreased available capacity, and attaches a new node to the node with the lowest height and sufficient available capacity, until no such nodes exist. STAR creates bushy trees and consequently pays low relay cost. However, due to large node degrees, the root suffers from high per-message overhead, and thus, the tree can not grow very large.
Chain. This scheme gives priority to increasing the height
of the tree, and constructs “chain”-like trees. CHAIN adds nodes to the tree in the same way as STARdoes except that it tries to attach nodes to the node withthe highest heightand sufficient available capacity. CHAIN creates long trees that achieve good load balance, but due to the number of hops each message has to travel to reach the root, most nodes pay a high relay cost.
STAR and CHAIN reveal two conflicting factors in tree construction – efficiency and scalability. Minimizing tree height achieves efficiency, i.e. minimum relay cost, but causes poor scalability, i.e. small tree size. On the other hand, maximizing tree height achieves good scalability, but degrades efficiency. The adaptive tree construction scheme seeks a middle-ground between the STAR and CHAIN pro-cedures. It tries to minimize the total resource consumption, and can trade off per-message overhead for relay cost, and vice versa, if it accommodates more nodes by doing so.
The adaptive tree construction scheme frequently uses the following two concepts: Given a set of nodes N for tree
1. In our setting, processing an outgoing message consumes the same amount of resource as processing the same message as an incoming one
construction and the corresponding treeT which contains a nodes setN⊂N, we sayT issaturatedif no more nodes d∈(N−N)can be added toT without causing violation of resource constraint for at least one node in T. We refer to nodes whose resource constraint would be violated ifd∈
(N−N)is added toT ascongested nodes.
The adaptive tree construction scheme iteratively invokes two procedures, the constructionprocedure and the adjust-ing procedure. The construction procedure runs the STAR
scheme which attaches new nodes to low level existing tree nodes. STAR causes the capacity consumption at low level nodes to be much heavier than that at other nodes. Thus, as low level tree nodes become congested (a saturated tree), the construction procedure terminates and returns all congested nodes. The scheme then invokes the adjusting procedure, which tries to relieve the workload of low level nodes by reducing the degree of these nodes and increasing the height of the tree(similar to CHAIN). As a result, the adjusting procedure reduces congested nodes and makes a saturated tree unsaturated. The scheme then repeats the constructing-adjusting iteration until no more nodes can be added to the tree. For details of the adjusting procedure and resource allocation for nodes participated in multiple trees, we refer interested readers to our technical report[14].
4. Experimental Evaluation
We undertake an experimental study of REMO and present results including those gathered by deploying REMO on a BlueGene/P rack running IBM’s large-scale distributed streaming system - System S. We first characterize our partition augmentation and tree construction schemes using synthetic data, and then validate the performance of our system through real system experiments.
Synthetic Dataset Experiments. For our experiments on
synthetic data, we assign a random subset of attributes to each node in the system. We generate monitoring tasks by randomly selecting |At| attributes and |Nt| nodes with uniform distribution, for a given size of attribute set Aand node set N. We also classify monitoring tasks into two categories - 1) small-scale ones that are for a small set of attributes from a small set of nodes, and 2)large-scaleones that either involves many nodes or many attributes.
Real System Experiments. Through experiments in a real
system deployment, we also show that the error in attribute value observations (due to either stale or dropped attribute values caused by insufficient node resources) introduced by REMO is small. Note that this error can be measured in a meaningful way only for a real system.
System S is a large-scale distributed stream process-ing middleware. Applications are expressed as dataflow graphs that specify analytic operators interconnected by data streams. These applications are deployed in System S as processes executing on a distributed set of hosts, and interconnected by stream connections using transports such as TCP/IP. Each node that runs application processes can observe attributes at various levels such as at the analytic operator level, System S middleware level and the OS
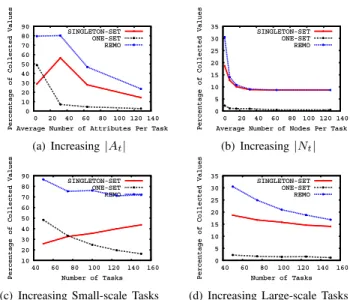
0 10 20 30 40 50 60 70 80 90 0 20 40 60 80 100 120 140 Percentage of Collected Values Average Number of Attributes Per Task
SINGLETON-SET ONE-SET REMO 0 10 20 30 40 50 60 70 80 90 0 20 40 60 80 100 120 140 Percentage of Collected Values Average Number of Attributes Per Task
SINGLETON-SET ONE-SET REMO (a) Increasing|At| 0 5 10 15 20 25 30 35 0 20 40 60 80 100 120 140 Percentage of Collected Values Average Number of Nodes Per Task
SINGLETON-SET ONE-SET REMO 0 5 10 15 20 25 30 35 0 20 40 60 80 100 120 140 Percentage of Collected Values Average Number of Nodes Per Task
SINGLETON-SET ONE-SET REMO (b) Increasing|Nt| 10 20 30 40 50 60 70 80 90 40 60 80 100 120 140 160 Percentage of Collected Values Number of Tasks
SINGLETON-SET ONE-SET REMO 10 20 30 40 50 60 70 80 90 40 60 80 100 120 140 160 Percentage of Collected Values Number of Tasks
SINGLETON-SET ONE-SET REMO
(c) Increasing Small-scale Tasks
0 5 10 15 20 25 30 35 40 60 80 100 120 140 160 Percentage of Collected Values Number of Tasks
SINGLETON-SET ONE-SET REMO 0 5 10 15 20 25 30 35 40 60 80 100 120 140 160 Percentage of Collected Values Number of Tasks
SINGLETON-SET ONE-SET REMO
(d) Increasing Large-scale Tasks
Figure 4: Comparison of Attribute Set Partition Schemes under Diff. Workload Characteristics
level. For these experiments, we deployed one such System S application called YieldMonitor [15], that monitors a chip manufacturing test process and uses statistical stream processing to predict the yield of individual chips across different electrical tests. This application consisted of over 200 processes deployed across 200 nodes, with 30-50 at-tributes to be monitored on each node, on a BlueGene/P cluster. The BlueGene is very communication rich and all compute nodes are interconnected by a 3D Torus mesh network. Consequently, for all practical purposes, we have a fully connected network where all pairs of nodes can communicate with each other at almost equal cost. We generate workload for these experiments using the same procedure that we used for the synthetic dataset experiments.
4.1. Result Analysis
We present a small subset of our experimental results to highlight the following observations amongst others:
• REMO can collect a larger fraction of node-attribute pairs to server tasks presented to the system compared to simple heuristics (which are essentially the state-of-the-art). REMOadaptsto task and system characteris-tics, and outperforms each of these simple heuristics. • In a real application scenario, REMO also significantly
reduces percentage error in the observed values of the node-attribute pairs required by monitoring tasks when compared to simple heuristics.
Varying the scale and number of monitoring tasks.
Figure 4 compares the performance of different attribute set partition schemes under different workload characteris-tics. In Figure 4(a), where we increase the number of at-tributes|At|in monitoring tasks, our partition augmentation scheme(REMO) performs consistently better than singleton-set(SINGLETON-SET) and one-set(ONE-SET) schemes. In addition, ONE-SET outperforms SINGLETON-SET when |At| is relatively small. As each node sends only one
20 30 40 50 60 70 80 90 100 150 200 250 300 350 400 Percentage of Collected Values Number of Nodes
SINGLETON-SET ONE-SET REMO 20 30 40 50 60 70 80 90 100 150 200 250 300 350 400 Percentage of Collected Values Number of Nodes
SINGLETON-SET ONE-SET REMO
(a) Increasing Nodes(Small-scale)
0 5 10 15 20 25 30 35 100 150 200 250 300 350 400 Percentage of Collected Values Number of Nodes
SINGLETON-SET ONE-SET REMO 0 5 10 15 20 25 30 35 100 150 200 250 300 350 400 Percentage of Collected Values Number of Nodes
SINGLETON-SET ONE-SET REMO (b) Increasing Nodes(Large-scale) 10 20 30 40 50 60 70 80 90 100 0 2 4 6 8 10 12 14 16 Percentage of Collected Values C/a
SINGLETON-SET ONE-SET REMO 10 20 30 40 50 60 70 80 90 100 0 2 4 6 8 10 12 14 16 Percentage of Collected Values C/a
SINGLETON-SET ONE-SET REMO
(c) IncreasingC/a(Small-scale)
0 10 20 30 40 50 60 70 80 0 2 4 6 8 10 12 14 16 Percentage of Collected Values C/a
SINGLETON-SET ONE-SET REMO 0 10 20 30 40 50 60 70 80 0 2 4 6 8 10 12 14 16 Percentage of Collected Values C/a
SINGLETON-SET ONE-SET REMO
(d) IncreasingC/a(Large-scale)
Figure 5: Comparison of Attribute Set Partition Schemes under Diff. System Characteristics
message which includes all its own attributes and those received from its children, ONE-SET causes the minimum per-message overhead. However, when |At| increases, the capacity demand of low level nodes, i.e. nodes close to the root, increases significantly, which limits the size of the tree and causes poor performance. In Figure 4(b), where we set |At| = 100 and increase |Nt| to create extremely heavy workloads, REMO gradually converges to SINGLETON-SET, as SINGLETON-SET provides the best load balance which results in the best performance in this case. We observe similar results in Figure 4(c) and 4(d), where we increase the total number of small-scale and large-scale monitoring tasks respectively.
Varying nodes in the system. Figure 5 shows the
per-formance of different attribute set partition schemes under different system characteristics. In Figure 5(a) and 5(b), where we increase the number of nodes in the system given small and large scale monitoring tasks respectively, we can see SINGLETON-SET is better for large-scale tasks while ONE-SET is better for small-scale tasks, and REMO performs much better than them in both cases, around 90% extra collected node-attribute pairs.
Varying per-message processing overhead. To study
the impact of per-message overhead, we vary the C/a ratio under both small and large scale monitoring tasks in Figure 5(c) and 5(d). As expected, increased per-message overhead hits the SINGLETON-SET scheme hard since it constructs a large number of trees and, consequently, incurs the largest overhead cost while the performance of the ONE-SET scheme which constructs just a single tree degrades more gracefully. However, having a single tree is not the best solution as shown by REMO which outperforms both schemes as C/aincreases.
Comparison of tree-construction schemes. In Figure
6, we study the performance of different tree construc-tion schemes under different workloads and system
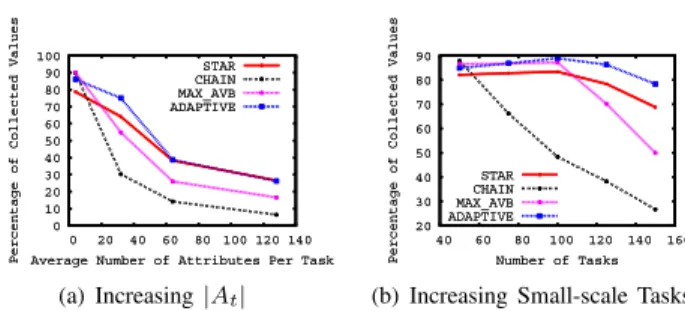
0 10 20 30 40 50 60 70 80 90 100 0 20 40 60 80 100 120 140 Percentage of Collected Values Average Number of Attributes Per Task
STAR CHAIN MAX_AVB ADAPTIVE 0 10 20 30 40 50 60 70 80 90 100 0 20 40 60 80 100 120 140 Percentage of Collected Values Average Number of Attributes Per Task
STAR CHAIN MAX_AVB ADAPTIVE (a) Increasing|At| 20 30 40 50 60 70 80 90 40 60 80 100 120 140 160 Percentage of Collected Values Number of Tasks
STAR CHAIN MAX_AVB ADAPTIVE 20 30 40 50 60 70 80 90 40 60 80 100 120 140 160 Percentage of Collected Values Number of Tasks
STAR CHAIN MAX_AVB ADAPTIVE
(b) Increasing Small-scale Tasks
Figure 6:Comparison of Tree Construction Schemes under Differ-ent Workload and System Characteristics
acteristics. Our comparison also includes a new scheme, namely MAX AVB, a heuristic scheme used in TMON[13] which attaches new nodes to the existing node with the most available capacity. While we vary different workloads and system characteristics in the four figures, our adaptive tree construction scheme(ADAPTIVE) always performs the best. Among all the other tree construction schemes, STAR performs well when workload is heavy, as suggested by Figure 6(a) and 6(b). This is because STAR builds trees with minimum height, and thus, avoids paying considerable cost for relaying given heavy workloads. CHAIN performs the worst in almost all cases. While CHAIN provides good load balance by distributing per-message overhead in CHAIN-like trees, nodes have to pay high cost for relaying, especially when workloads are heavy. MAX AVB scheme outperforms both STAR and CHAIN given small workload, as it avoids over stretching a tree in breadth or height by growing trees from nodes with the most available capacity. However, its performance quickly degrades with increasing workload due to relaying cost.
18 20 22 24 26 28 30 32 34 36 38 40 60 80 100 120 140 160 180 200
Average Percentage Error
Number of Nodes SINGLETON-SET ONE-SET REMO 18 20 22 24 26 28 30 32 34 36 38 40 60 80 100 120 140 160 180 200
Average Percentage Error
Number of Nodes SINGLETON-SET ONE-SET REMO
(a) Comparison between Partition Schemes 16 18 20 22 24 26 28 30 32 34 36 38 40 60 80 100 120 140 160
Average Percentage Error
Number of Tasks SINGLETON-SET ONE-SET REMO 16 18 20 22 24 26 28 30 32 34 36 38 40 60 80 100 120 140 160
Average Percentage Error
Number of Tasks SINGLETON-SET ONE-SET REMO
(b) Comparison between Tree
Construction Schemes
Figure 7:Comparison of Schemes on Average Percentage Error
Real-world performance. To evaluate the performance of
REMO in a real world application. we measure the average percentage error of received attribute values for syntheti-cally generated monitoring tasks. Specifisyntheti-cally, we measure average percentage error between the snapshot of values observed by our scheme and compare it to the snapshot of “actual” values (that can be obtained by combining local log files at the end of the experiment). Figures 7(a) compares the achieved percentage error between different partition schemes given increasing nodes. The figure shows that our partition augmentation scheme in REMO outperforms the other partition schemes. The percentage error achieved by REMO is around 30%-50% less than that achieved by
SINGLETON-SET and ONE-SET. Interestingly, the percent-age error achieved by REMO clearly reduces when the number of nodes in the system increases. The reason is that as nodes increases, monitoring tasks are more sparsely distributed among nodes. Thus, each message is relatively smaller and each node can have more children, which reduces the percentage error caused by latency. Similarly, REMO gains significant error reduction compared with the other two schemes in Figure 7(b) where we compare tree construction schemes under increasing monitoring tasks.
5. Related Work
Much early work on distributed query systems mainly focuses on executing single queries efficiently. As our work study multiple queries, we omit discussing these work. In addition, research on processing multiple queries on a centralized data stream [16], [17], [18], [19] is not directly related with our work either, as we study distributed stream-ing where inter-node communication is of concern.
A large body of work studies query optimization and pro-cessing for distributed databases (see [20] for a survey). Our problem is fundamentally different as nodes in our problem are capacity constrained. There are also much work on multi-query optimization for continuous aggregation queries over physically distributed data streams [19], [21], [22], [23], [24], [25], [16], [17], [18]. These schemes assume routing trees are provided as part of the input, which may not be true for certain scenarios. REMO is able to choose optimal routing trees from many possible ones based on multi-task optimization and resource constraints.
Recently, several work studies efficient data collection mechanisms. CONCH [26] builds a spanning forest with minimal monitoring costs for continuously collecting read-ings from a sensor network by utilizing temporal and spa-tial suppression. However, it does not consider node level resource limitation and per-message overhead as we did, which may limit its applicability. PIER [6] suggests using distinct routing trees for each query in the system, which is essentially the SINGLETON-SET scheme we discussed. This scheme, though achieves good load balance, may cause significant cost on per-message overhead.
6. Conclusion and Future Work
We have presented REMO, a resource-aware multi-task optimization framework for scaling application state moni-toring in large scale distributed systems. Our approach op-timizes monitoring by balancing communication efficiency and scalability of the monitoring network. The unique contri-bution of REMO is the techniques for generating monitoring forests that optimize multiple tasks and, at the same time, balances node level resource consumption. We evaluate REMO through extensive experiments including deploying REMO in a real-world stream processing application hosted on BlueGene/P. The results show that REMO significantly and consistently outperforms existing approaches.
The REMO development continues along several dimen-sions. First we plan on implementing extensions such as in-network aggregation and alternate routing. Second, we
are considering extending our framework to handle both short-term and long-term monitoring tasks. Furthermore, we are interested in studying the runtime adaptation cost of transforming from one monitoring network to another.
Acknowledgment
The first and last authors are partially supported by grants from NSF CISE CyberTrust program, IBM faculty partnership award, and an IBM SUR grant.
References
[1] B. Hayes, “Cloud computing,”Commun. ACM 08, vol. 51.
[2] N. Jain and et al., “Design, implementation, and evaluation of the linear road benchmark on the stream processing core,” inSIGMOD Conference, 2006, pp. 431–442.
[3] D. Abadi and et al, “The design of the borealis stream
processing engine,” inProceedings of CIDR, 2005.
[4] S. Madden and et al., “Tag: A tiny aggregation service for
ad-hoc sensor networks,” inOSDI, 2002.
[5] P. Yalagandula and M. Dahlin, “A scalable distributed
infor-mation management system,” inSIGCOMM04, pp. 379–390.
[6] R. H. et al., “The architecture of pier: an internet-scale query
processor,” inCIDR, 2005, pp. 28–43.
[7] G. Cormode, M. N. Garofalakis, S. Muthukrishnan, and R. Rastogi, “Holistic aggregates in a networked world:
Dis-tributed tracking of approximate quantiles,” inSIGMOD05.
[8] M. Greenwald and S. Khanna, “Power-conserving
computa-tion of order-statistics over sensor networks,” inPODS04.
[9] G. Cormode and et al., “Sketching streams through the net:
Distributed approximate query tracking,” inVLDB05.
[10] D. J. Abadi and et al., “Reed: Robust, efficient filtering and
event detection in sensor networks,” inVLDB, 2005.
[11] U. Srivastava, K. Munagala, and J. Widom, “Operator
place-ment for in-network stream query processing,” inPODS05.
[12] A. Deligiannakis and et al., “Hierarchical in-network data
aggregation with quality guarantees,” inEDBT04.
[13] S. R. Kashyap, D. Turaga, and C. Venkatramani, “Efficient trees for continuous monitoring,” 2008.
[14] S. Meng, S. R. Kashyap, C. Venkatramani, and L. Liu, “Resource-aware application state monitoring for large-scale distributed systems,” Technical Report, 2008.
[15] D. S. Turaga and et al., “Real-time monitoring and predictive analysis of chip manufacturing data,” 2008.
[16] R. Z. 0003, N. Koudas, B. C. Ooi, and D. Srivastava,
“Multiple aggregations over data streams,” inSIGMOD05.
[17] S. Krishnamurthy, C. Wu, and M. J. Franklin, “On-the-fly
sharing for streamed aggregation,” inSIGMOD06.
[18] J. Li and et al., “Efficient evaluation of sliding-window
aggregates over data streams,”SIGMOD Record 05.
[19] S. Madden and et al., “Continuously adaptive continuous
queries over streams,” inSIGMOD, 2002, pp. 49–60.
[20] D. Kossmann, “The state of the art in distributed query
processing,”ACM Comput. Surv., vol. 32, no. 4, 2000.
[21] R. Huebsch and et al., “Sharing aggregate computation for
distributed queries,” inSIGMOD, 2007, pp. 485–496.
[22] R. Gupta and K. Ramamritham, “Optimized query planning of continuous aggregation queries in dynamic data dissemination
networks,” inWWW07. New York, NY, USA: ACM.
[23] N. Trigoni and et al., “Multi-query optimization for sensor
networks,” inDCOSS, 2005, pp. 307–321.
[24] A. Silberstein and J. Yang, “Many-to-many aggregation for
sensor networks,” inICDE, 2007, pp. 986–995.
[25] S. Xiang, H.-B. Lim, K.-L. Tan, and Y. Zhou, “Two-tier
mul-tiple query optimization for sensor networks,” inICDCS07.
[26] A. Silberstein, R. Braynard, and J. Yang, “Constraint chain-ing: on energy-efficient continuous monitoring in sensor