Flow-based TCP Connection Analysis
Tobias Limmer and Falko Dressler Computer Networks and Communication Systems
University of Erlangen, Germany {limmer, dressler}@cs.fau.de
Abstract—We discuss the need for accurate analysis of TCP connections based on aggregated flow information. Due to increasing bandwidths in the Internet, flow metering is thought to be the a promising solution for network monitoring, because packet-oriented state-based analysis reaches its limits and fast hardware support for flow metering is already integrated in modern routers. Motivated by earlier work on flow-based connection analysis, we investigate the quality of several stateless classifiers that can be used to determine the TCP connection state as either successful or failed. This information is strongly needed especially in the domain of attack detection and is usually produced by fine-grained analysis in the packet level. Furthermore, we determine appropriate configuration parameters for optimal flow metering by introducing a new statistical property, the maximum packet gap. We evaluated both, the classifiers and the packet gap analysis using a number of representative packet traces. Our best classifiers are able to correctly identify95 %of all connections with a fraction of the processing costs required for packet-based stateful connection tracking.
Keywords-TCP connection analysis; intrusion detection; flow analysis
I. INTRODUCTION
TCP connection tracking is a strongly demanded service in network monitoring, e.g. for detecting malicious traffic or anomalies in the network. Most frequently, state machines are used, which keep state for every connection and examine each monitored packet individually [1]. This method offers very good results for passive network-based Intrusion Detection Systems (IDSs) to evaluate a connection’s state and will be used as a baseline measure throughout this paper. Primarily, this type of information is used by algorithms for portscan detection. But also many other malicious tasks performed by malware can be detected: spam mail delivery partly guesses mail server names, so some connection attempts necessarily fail [2]. Typical Denial-of-Service (DoS) attacks also result in many failed connection attempts, so they may be easily detected.
Because of the high computational costs needed by packet-based connection tracking [3], it does not scale well in high-speed networks. Speed improvement by packet sampling techniques quickly degrade the reliability of TCP connection tracking: often single packets, e.g. packets with set SYN
flag, are important to determine the state [4]. Another well-developed approach for high-performance network monitor-ing is flow metermonitor-ing, usually used for traffic accountmonitor-ing. A
flow represents a set of packets sharing common properties and usually contains aggregated statistics about the packets corresponding to the flow. As there are fast aggregation techniques available (frequently implemented in hardware), this method perfectly suits large high-speed networks [5]. Due to the availability of routing hardware that supports flow aggregation out of the box, dedicated sensors do not need to be deployed any more directly at the network links.
Determining a connection state based on aggregated flow information will usually not be as precise as methods working on packet-based data, but we anticipate a huge speed advantage by processing the aggregated flow data, as much lower amounts of data need to be processed statelessly. As a rough figure, often less than 100 bytes are required for a bidirectional flow record representing one connection. Using this type of data, TCP connection analysis can be made feasible for much larger networks and link speeds. Our work shows how to implement connection analysis on a flow level and enable the application of anomaly detection techniques on flow-based data that previously only worked with packet-based data. This applies to all anomaly detection techniques that operate on aggregated information of network traffic that is supplied by flow data (for an overview see Section III-A, and for more detail see [6]).
On a much smaller scale, latest developments in wireless mesh networks begin implementing intrusion detection on cheap embedded hardware [7]. Here, primary concern is the hardware’s low performance, so detection methods need to be slimmed down considerably for acceptable speeds. The speedup gained with flow metering in combination with lightweight methods for anomaly detection also shows much promise in this context.
Our contributions in this work are twofold: First, to determine appropriate timeout parameters for flow monitoring and use the data for TCP connection tracking, we analyze the distribution of the length of TCP connections and of the maximum packet gapin these connections based on several network traces. Secondly, we performTCP connection state analysis using Internet Protocol Flow Information Export (IPFIX)-conform flow data. We introduce several flow-based classifiers and evaluate them thoroughly by comparing their results with results from a packet-based connection tracker. Connection states determined by these classifiers can then be used by anomaly detection methods that previously used
packet-level data as input. So many packet-based methods not using packet payload data, especially those used for portscan and anomaly-based malware detection, can be adapted to flow-based input.
II. RELATED WORK
Our research work was mainly inspired by the analysis of Netflow data by Sommer and Feldmann [5]. They tried to determine how well flow data created by Cisco routers can be used to derive TCP connection properties and developed a method to compare flow records to TCP connection summaries created by Bro [1]. Primarily, the actual amount of transferred payload in relation to used application layer protocols has been analyzed. We extend this analysis by providing details about direction reversals of flows and evaluating classifiers to determine connection types.
As a reference, we use packet-based TCP connection analysis. A number of systems have been proposed in the literature, which either work stand-alone to output the results directly,1 or within payload-based IDSs where stream defragmentation is a requirement for attack detection [1]. Statistical properties of current Internet traffic and the expressiveness of aggregated fields within flow records, especially concentrating on dynamically adjusted sampling algorithms and their effects, have been analyzed in multiple studies [4], [8], [9]. Flow properties like the packet interarrival times of a flow’s firstnpackets and the corresponding packet sizes have been used for application classification [10], [11]. The result of connection attempts has always been in-teresting in the field of network security, especially attack detection. Many IDSs, e.g. Bro [1] or Snort [12], perform packet-based connection tracking and decide whether TCP connection attempts are successful or failed as basis for further analysis. In the area of anomaly detection, the state of connections is widely used in methods specialized on portscan detection. These systems usually use the number of failed connection attempts to identify port scanners in a specific time interval, or the number of consecutive failed connections [13]. Another system is specifically designed to work in high-speed network on flow-based data [14], where all unidirectional flows containing a single packet with set SYN flag were assumed to be failed connection attempts. A system that detects self-propagating malware by discovering anomalies in the traffic also uses information about connection states [15], as well as a more general approach that detects application-specific traffic [16].
III. PRELIMINARIES
In this section, we briefly present some details of flow monitoring and used systems and assumptions.
1An example is tcp-reduce by Vern Paxson (see: http://ita.ee.lbl.gov/html/
contrib/tcp-reduce-doc.html)
A. Flow monitoring
Flows are sets of IP packets sharing common properties (flow keys). In most applications, a typical configuration would be using the IP 5-tuple<src IP, dest IP, src port, dest port, protocol>as flow keys. Furthermore, relevant statistical data can be aggregated and added to the flow. In the context of this paper, we will primarily rely on the monitored time of the flow’s first packet (fst), the number of packets in the
flow (fpkts), the accumulated TCP payload size (ftcpoct),
and the set of all observed TCP flags (ff l). We only regard
all flags relevant for the TCP connection’s state, i.e.SYN,
ACK,FIN, andRST. All connections that were completely captured and included the handshake and shutdown (either withFINorRSTflag set) are called “complete connections” in the context of this paper.
Most of the state-of-the-art flow meters support either the Netflow.v9 or the IPFIX [17] standard. These flow meters regularly export flow information according to two predefined timeouts: An active timeout describes the maximum time a flow record is kept in cache, and a passive timeout is used to expire flows if no more packets are received for a specific flow by the flow meter.
Biflows [18] are used to describe bidirectional data flows. In short, all statistical information contained in corresponding unidirectional flows is aggregated to a single flow describing both directions. In most cases, the direction of biflows can be determined by assuming the unidirectional flow with the lowestfst to be the initiator. We usefO:∗ to describe fields
from originator to responder, andfR:∗ vice versa.
In our experiments we used Vermont [19], an open-source monitoring toolkit supporting Netflow.v9 and IPFIX. Using a typical PC, it can process packets up to 1 GBit/s. Its modularized structure offers diverse methods to analyze flow records.
B. State-based connection analysis using Bro
Usually, TCP connection tracking relies on stateful packet analysis. For each ongoing connection, a state machine stores all relevant data and each incoming packet is tested for validity, e.g. whether the sequence number and the TCP flags are set correctly. Thus, it becomes possible to estimate the current connection state. However, even this thorough analysis does not guarantee unambiguous results, as it is not always possible to predict which packets would be accepted by the receiving network stack. To counter this problem, techniques are available that normalize traffic passing a router and remove the ambiguities [20]. A representative tool for connection tracking is Bro [1]. It reports a connection summary for each observed TCP connection as well as the transmitted payload bytes, which only include payload that was acknowledged by the receiver. We used it to validate our flow-based TCP connection analysis.
C. TCP connection types
We use the term “connection type” to describe the state of an analyzed TCP connection as eitherfailed orsuccessful. The definition of this term completely depends on the context, so for a proper understanding, we regard this term from different perspectives first: In the context of the transport layer, peers exchanging data in successful connections never have desynchronized states. This is the case if a handshake is performed successfully, and the connection teardown using the FIN sequence of packets is complete. To handle state desynchronization between peers, the TCP specification introduced theRSTflag to indicate the reception of unexpected packets. If a peer receives a packet with set
RSTflag, the corresponding connection is regarded as failed and is aborted.
In the field of network security, it is usually not assumed that connections with successful handshake and ending with set flag RSTare malicious, as desynchronized states most often have non-malicious causes like dropped network links or software resets. There are even some network stacks and software applications available that disregard protocol specifications and terminate TCP connections with a RST
packet instead of using a properFINconnection teardown.2 From an application’s point of view, it becomes more difficult to differentiate between successful and failed con-nections: even if a connection was successfully started and finished at the transport layer, it may still be considered as failed by the application. This is the case if a peer transferred a failed authentication or invalid payload in the application layer. So in order to recognize failed connection attempts in the application layer, a monitoring application would have to interpret the application protocol and process the packet payload accordingly. Some available IDS offer this feature. As our main intention is to create a high-speed connection analyzer that operates on flow-based data without payload, we do not follow this approach here. We use the transport layer for connection state detection and define connections as successful, if they successfully exchanged application data. This allows us to correctly identify scans that perform port sweeps and do not transfer any data. False positives may be caused by application protocols that are only based on correctly established TCP connections and do not exchange payload. Examples are so-called port-knocking methods. Here, either single UDP or TCP packets are sent to a server to trigger its firewall to temporarily open a port.
IV. INPUT DATA
For our analysis and evaluation, we used several 2 h
packet traces captured at the University of Erlangen’s Internet
2There have been numerous reports of stalled connections in Internet
Explorer. These were caused by firewalls that correctly blocked packets after receiving a misplaced RST packet from Internet Explorer.
Table I
TRACES USED IN OUR ANALYSIS
date, scope packet bit active
time rate rate hosts
(kpkt/s) (Mbit/s) T1 29/07, 10:02 all 52 289 5454 T2 07/11, 9:21 all 52 311 5148 T3 10/11, 23:58 all 31 187 1916 T4 13/11, 10:10 all 59 357 5464 T5 07/11, 9:21 server 4.3 23 126 T6 07/11, 9:21 pool 3.6 22 159
uplink in2008.3 All traces were filtered to only include TCP packets. The trace statistics are depicted in Table I (the values correspond to the filtered traces). Column “active hosts” shows the number of active hosts in the local network. The real number of accessed local hosts was much higher (around50 000), but this was mainly caused by permanent scans from the Internet. The traces show a high variety of different traffic types: the university network supports multiple high-profile servers, a multitude of workstations, and privately used hosts in dormitories. TracesT1,T2, and
T4 were each captured on typical weekdays during normal
working hours and include all traffic captured on the uplink. Nightly operation is captured in trace T3. Trace T5 only
included server traffic, whereas T6 only included traffic
coming from a workstation pool.
V. SELECTINGOPTIMALFLOWAGGREGATIONTIMEOUTS
As mentioned before, several timeouts are used for flow monitoring as well as in state-based connection trackers that are used to expire cached entries and to report the corre-sponding state information. There is a general optimization problem between long timeouts, which help to collect all relevant information of each connection, and short timeouts which support a quick analysis and reaction to observed network data, but may lead to connections that are split in multiple flow records. Usually, empirical studies are used for configuring these timeouts depending on the application scenario and the available resources on the network probe. For a TCP connection, we consider three phases that might be observed by a flow meter: the handshake, i.e. the exchange of packets containing theSYN flag, midstream traffic, i.e. normal data transfer, and the shutdown, either an exchange ofFIN, or RST packets. The probability of flow splitting during the handshake is quite small, because the handshake is usually performed by the operating system’s network stack and only depends on the round-trip time. This also applies to normal connection shutdowns. The probability to split the flow during its lifetime mainly depends on the used passive and active timeouts. The active timeout corresponds with
3The traces were captured with tcpdump (see http://www.tcpdump.org/)
1 10 100 1000 10000 0.0001 0.0010 0.0100 0.1000 1.0000 connection length (s)
normalized connection count
60 120 300 600 3600 0.001 0.015 0.05 trace 1 trace 2 trace 3 trace 4 trace 5 trace 6
Figure 1. TCP connection lengths with normalized counts as inverse
cumulative log-log histogram; value ofyat positionxmeans that a ratio
ofyflows is longer thanx
packets
max. packet gap
Figure 2. Maximum packet gap in an unidirectional flow
the full length of a TCP connection, so it will be split in multiple flow records if the active timeout is smaller than the connection’s length. The passive timeout refers to idle times in active flows where no packet is transferred, as depicted in Figure 2. To our knowledge, the maximum packet gap, i.e. the optimal passive timeout setting, has not yet been comprehensively studied based on realistic trace data. A. Active timeout
We analyzed the length of TCP connections in our traces and only regarded those that include a complete handshake and a normal three-way shutdown. Figure 1 shows an inverse cumulative distribution of connection lengths. The flow count has been normalized for better comparability. The graph provides an estimate for adequate active timeout values. Clearly visible are steps at connection length times of120 s,
300 s, and 600 s, which seem to be typical timeout values for applications present in our network. As the lengths of our traces were limited to 2 h, only a fraction of 120120−t connections of t min length are included in the graph. However, this effect is negligible for connections lasting less than 10 min. Helper lines mark95 %, 98.5 %, and 99.9 %
of all connections in the graph. For95 %, we get possible timeout values between34 sand365 s. This variance is higher for 98.5 %, as the optimal timeout lies between 314 sand
4028 s). TraceT3, taken at night time, had the highest number
of long connections due to many long-running backup tasks. B. Passive timeout
The passive timeout used in flow monitoring is directly influenced by the maximum packet gap. This value refers
1 10 100 1000 10000 0.0001 0.0010 0.0100 0.1000 1.0000
maximum packet gap (s)
normalized flow count
60 120 300 600 3600 0.001 0.015 0.05 trace 1 trace 2 trace 3 trace 4 trace 5 trace 6
Figure 3. Maximum packet gaps in TCP connections (normalized)
to the longest interval between two succeeding packets transferred in the same direction, illustrated in Figure 2. We determined the longest gap from both directions of a connection and selected the higher value. Figure 3 shows a log-log inverse cumulative histogram of each flow’s maximum packet gap. These graphs correlate quite well with the connection length distribution shown in Figure 1, but steps at positions60 s,120 s, and 300 sare more visible. A possible explanation for this behavior is that applications with long lasting connections transfer data in regular intervals or periodically test the availability of the TCP connection. For a correct aggregation of one TCP connection to one flow record with95 %and98.5 % accuracy, our traces require a passive timeout for flow monitoring of39–120 s and380–
2600 s, respectively. TraceT3with long-running backup tasks
at night showed very long packet gaps in connections and requires high timeout values. Please note that these timeouts are directly influenced by the application protocols in use and may vary from network to network.
We configured Vermont to use 130 sas passive and610 s
as active timeout for the connection state analysis described in the next section. These moderate timeout values ensure that most of the TCP connections are recorded into a single non-split flow, and the delay caused by the aggregation is moderate.
VI. CONNECTIONSTATEANALYSIS
In the following, we determine and discuss criteria to deduce the state of TCP connections from flow records. This includes an analysis of the quality of the connection direction estimation, which is especially important for IDSs that need to evaluate the source of an attack.
A. Flow direction
Considering a perfect monitoring environment, the direc-tion of a connecdirec-tion can easily be determined by looking at the first observed packet. However, in real monitoring systems, this assumption is often not valid: even if sym-metric routing is used and all packets are captured by the
monitoring system, the system may have implementation-specific peculiarities (caused for example by buffers) and may not capture the exact time of observation, or change the order of packets. Packet-based connection analyzers like Bro automatically correct a TCP connection’s direction, if a packet withSYNflag and a packet containing the SYNand
ACKflags belonging to the same connection were monitored in the wrong order. Unfortunately, this “hack” is not possible based on flow information – usuallySYNand ACKflags are set in both flow directions. The only way to improve the results for flow data is to add an additional field within the flow records that marks the direction of packets where only theSYNflag, and theSYN ACKflags are set. Then a flow-based analyzer could use a similar heuristic to packet-flow-based IDS to determine the correct direction. Unfortunately, most current flow meters do not support this additional field, so we also did not use it in our evaluation.
The time resolution of the monitoring system plays an important role when determining the direction, so we analyzed our system in detail. Figure 4 shows an inverse cumulative density diagram of all flow’sfR:st−fO:st in the
individual traces. Our network had an average roundtrip time to popular external servers of roughly20 ms, and an average internal latency of less than1 ms. These values can be clearly seen in the difference betweenT5(server networks,5 ms) and
T6 (workstation networks,25 ms). With the time resolution
of our monitoring system, Bro switched the direction of
2.85 %of all connections in average. Many popular routers only support a millisecond time resolution, so we marked the
1 ms case in the graph. It shows a surprisingly high amount of up to55 %of flows whose direction could not have been determined correctly.
We experienced much lower network latencies than traces captured in New Zealand [21]. Obviously, the roundtrip times greatly depend on the usage type (server or clients) and the latency of primarily accessed networks, which also correlates with the geographical location of the monitored link. In effect, the better the network access and the lower the latency, the more difficult is determining the correct flow direction without packet-level analysis.
B. Classifiers
We identified a number of flow-based classifiers that can be used to determine the connection type. A classifier selects flows according to specific properties with the goal of filtering either successful or failed connections. First, we select some basic classifiers. After an evaluation of the classifiers, we try to improve their efficiency by combining them.
All used classifiers are listed in Table II. Please note that direction-dependent classifiers may produce wrong results if the direction has not been recorded properly (in average
2.85 %of all connections in our traces).
Roughly, the classifiers can be grouped into three classes. The first metric is the number of packets in each direction.
0.0005 0.0050 0.0500 0.5000 0.0 0.2 0.4 0.6 0.8 1.0 start difference (s)
normalized cumulative flow count
0.001 trace 1 trace 2 trace 3 trace 4 trace 5 trace 6
Figure 4. Inverse cumulative semilog histogram offR:st−fO:st
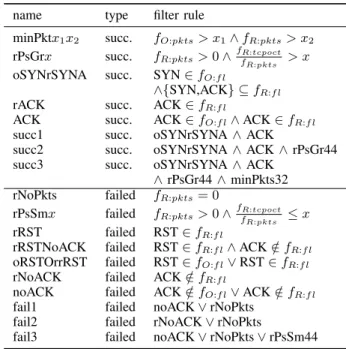
Table II
DESCRIPTION OF CLASSIFIERS name type filter rule
minPktx1x2 succ. fO:pkts> x1∧fR:pkts> x2
rPsGrx succ. fR:pkts>0∧
fR:tcpoct
fR:pkts > x
oSYNrSYNA succ. SYN∈fO:f l
∧{SYN,ACK} ⊆fR:f l
rACK succ. ACK∈fR:f l
ACK succ. ACK∈fO:f l∧ACK∈fR:f l
succ1 succ. oSYNrSYNA∧ACK
succ2 succ. oSYNrSYNA∧ACK∧rPsGr44 succ3 succ. oSYNrSYNA∧ACK
∧rPsGr44∧minPkts32 rNoPkts failed fR:pkts= 0 rPsSmx failed fR:pkts>0∧ fR:tcpoct fR:pkts ≤x rRST failed RST∈fR:f l
rRSTNoACK failed RST∈fR:f l∧ACK∈/fR:f l
oRSTOrrRST failed RST∈fO:f l∨RST∈fR:f l
rNoACK failed ACK∈/fR:f l
noACK failed ACK∈/fO:f l∨ACK∈/fR:f l
fail1 failed noACK∨rNoPkts fail2 failed rNoACK∨rNoPkts
fail3 failed noACK∨rNoPkts∨rPsSm44
At least 3 packets from the originator and 2 packets from the responder are needed to establish a TCP connection and to transfer payload to a peer. This is measured byminPktx1x2.
Secondly, the TCP flags are considered. We usedoSYNrSYNA, rACK andACK to select successful connections. Classifiers selecting failed connections arerRSTNoACK, which selects only rejected connections,rRST and oRSTOrrRST, which select rejected and aborted connections both using and not using the flow’s direction, respectively.noACKis the inverse classifier to ACK. Thirdly, we look at the average packet length.rPSgrxselects successful connections, if the average TCP payload length is greater thanx bytes.rPSsmxis the inverse classifier for failed connections.
As discussed in Section V, it is not possible for flow aggregation to capture every single TCP connection in one flow record. So individual flow records may only represent a
TCP connection
handshake midstream shutdown
SYN ACK
ACK FIN
RST ACK
Figure 5. TCP connection split into 3 parts and important TCP flags
part of connections. Figure 5 shows a TCP connection split into 3 parts with flags that are relevant for the connection state. Most of the flow splits occur in midstream because of application-specific waiting times, and only rarely during handshake or shutdown. If flow splits occur, all individual flow records should be assigned the same state. Thus, classifiers like oSYNrSYNA or rRST fail if the right part of the connection was not included in the flow record (here the handshake and shutdown, respectively). Classifiers that are resistant to flow splitting usually rely onACK. This is becauseACKis used in all parts of a successful connection, and most of the time bidirectionally, too.
C. Classifier validation
We used Bro to validate the quality of the presented classifiers, as it uses packet-based analysis and provides fine-grained result data. All connections were considered as successful, if they transferred at least one byte of payload in either direction that was acknowledged by the peer.
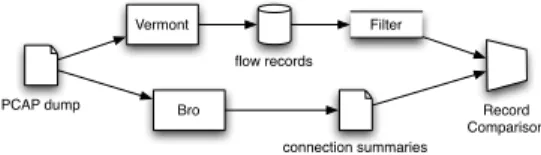
Figure 6 shows an overview of our data processing flow. The original packet traces were stored in PCAP dumps and were directly processed by Bro and Vermont. Bro was configured to only use its TCP connection state machine that outputs summaries for each observed connection. Vermont was configured to aggregate all incoming packet data to biflows. Then filters were applied on the aggregated flow records according to the classifiers, the flow records were compared to Bro connection summaries, and the results were analyzed.
We encountered several problems during the comparison of Bro’s connection summaries and Vermont’s flow records, as Bro connection summaries and Vermont flows have a n:mrelation. One Bro connection may be represented by multiple flow records, as flow metering expires flows after the active or passive timeout. The active timeout was deactivated in Bro, as we wanted the connection tracker to produce as accurate summaries as possible and avoid connection splitting. Thus, each time an active timeout was reached in the flow meter, Bro would still continue aggregating packets to one connection. Equally, a flow record could correspond to multiple Bro connections. Bro had much lower timeouts for connection handshakes and shutdown, so that it could differentiate failed from successful connection attempts. In these cases, a flow record was assumed to belong to a successful connection in our analysis, if at least one related connection summary had transferred payload. As already discussed in Section VI-A, the flow’s direction was not
PCAP dump Bro
Vermont connection summaries flow records Filter Record Comparison
Figure 6. Data processing flow used in analysis
TPR/TNR rating 0.0 0.2 0.4 0.6 0.8 1.0
minPkts22minPkts32minPkts33minPkts43rPsGr44rPsGr60 oSYNrSYNA ACKsucc1succ2 rNoPktsrPsSm44 rRSTNoACK rRST oRSTOrrRST rNoACKnoACK fail1 fail3 trace 1 trace 2 trace 3 trace 4 trace 5 trace 6 TPR TNR
Figure 7. Evaluated classifier performance using sensitivity (TPR) and
specificity (TNR); the figure show classifiers identifying successful (left) and failed connections (right)
always correct (around2.85 % of all flows were reversed). The ratio of flows matching part of a successful connection because of flow splitting was0.8 %–3 %, matching the results of the maximum packet gap analysis in Section V.
Our bivariate classifiers do not perform perfect classi-fication. Based on the measured true-positive T P , true-negative T N, false-positive F N, and false-negative F N values, we estimate the performance of each classifier using the sensitivityT P Rand specificityT N Rthat are primarily used in medical research [22]:
T P R = T P
T P +F N (1) T N R = T N
T N+F P (2) The sensitivity determines the classification ratio of the selected amount of objects to the real ones. The specificity shows the ratio of selected objects that were correctly classified. The larger the sensitivity and the specificity are, the better the classifier is. The measurement results for the classifiers are depicted in Figure 7. The left and right part of the figure show classifiers identifying successful and failed connections, respectively. For each classifier, the sensitivity (T P R) and selectivity (T N R) are shown in different colors, and each symbol corresponds to a different trace.
The classifiers related to the number of packets offer a good selectivity and only a moderate specificity. The specificity is low, as all failed connection attempts using
multiple packets are misclassified. rNoPktsselected failed connection attempts and featured a very high specificity, as TCP connections under normal conditions always exchange packets bidirectionally. Classifiers using theTCP flagsshow a very high sensitivity, but their specificity is rather low, because many false-positives are produced. oSYNrSYNA shows almost equal results compared to oSYNrSYN (not included in the graph) as SYN going in both directions almost always represents a successful handshake. The low specificity of these classifiers is caused by TCP connections that had a successful handshake, but did not transfer any data. rRSTNoACK was very specific, but did not capture many failed connection attempts.rRST andoRSTOrrRST show the error rate in determining the connections’ direction: both sensitivity and specificity increase and decrease accordingly. The difference betweenrNoACK and noACK also indicates inversed flow directions – most of the failed connections should also apply torNoACK. Looking at theaverage packet length,rPsGr44 shows good properties, although there is a moderate variance between the traces. The inverse for failed connections, rPsSm44 (not included in graph), performed much worse, as it requires fR:pkts > 0, which is not the
case for many failed connection attempts. The maximum size of TCP option records is60 bytes, so we also included rPsGr60. With this classifier, attackers would not be able to hide connection attempts by using maximum length TCP options.
Overall, the classifiers for successful connections con-stantly showed a high sensitivity, but their specificity was low – many failed connections were also included as false-positives. Classifiers for failed connections tried to capture specific cases of connection attempts, so their specificity was generally high, but the sensitivity was low. A single exception isnoACK, which captured flows showing no ACK
in both directions. D. Combined classifiers
In order to improve the accuracy of the simple classifiers, we combined them to produce better results. succ[123]are combinations of multiple classifiers for successful connec-tions: succ1 tries to capture both connection handshakes and midstream traffic, so it shows a very high sensitivity. succ2further addsrPsGr44 for higher specificity and shows an almost identical result torPsGr44. So,succ1 seems to be a superset of rPsGr44. succ3 (not shown in Figure 7) further adds packet number limitations, which does not change the selected set of flows.fail[123]directly select failed connections from the set:fail1detects connections with flag
ACKnot set in any direction and no packets in the reverse direction. Instead,fail2 usesrNoACKto detect connections with missing bidirectional data exchange. Both classifiers performed equally well, and had a rather low sensitivity.fail3 additionally includesrPsSm44, and now shows equally good results assucc2 andsucc3. The combination ofsucc3 with
the inverse offail3 did not show any improvements, so it seems that both classifiers choose inverse sets.
VII. CONCLUSION
We analyzed the feasibility of flow-based TCP connection state analysis. This feature is especially relevant in security related domains such as high-speed attack detection. We observed that identifying the direction of TCP connections is not faultlessly possible with flow data and suggest a new data element within flow records to solve this problem. A number of stateless classifiers for determining the TCP connection type from flow data have been suggested and extensively evaluated based on multiple high-volume network traces. Our best classifiers correctly selected in our traces in average
92 % of all connections and had an error rate of 5 %. In conclusion, it can be said that the TCP connection type can be identified with a satisfying confidence – enabling the application of anomaly-based attack detection methods like port-scan detection on aggregated flow data. However, exploiting knowledge about the connection analysis, it may be possible for attackers to cheat some of the classifiers by specifically forging packets. This is almost impossible if multiple classifiers are combined, but may not be fully prevented by this analysis technique.
In order to create an appropriate data base, we also determined optimal flow metering parameters for capturing whole TCP connections and introduced a new statistical property, the maximum packet gap. Our evaluation showed, that 95 % of all connections would have been correctly aggregated to one flow using the identified passive timeout of120 s. The results of this study build the basis for general configuration guidelines for flow meters.
REFERENCES
[1] V. Paxson, “Bro: A System for Detecting Network Intruders in Real-Time,” in7th USENIX Security Symposium, San Antonio, TX, January 1998.
[2] C. Wong, S. Bielski, J. M. McCune, and C. Wang, “A Study of Mass-mailing Worms,” inACM Workshop on Rapid Malcode (WORM ’04), Washington, DC, USA, October 2004, pp. 1–10. [3] H. Dreger, A. Feldmann, V. Paxson, and R. Sommer, “Op-erational experiences with high-volume network intrusion detection,” in 11th ACM Conference on Computer and Communications Security (ACM CCS 2004). Washington, DC: ACM, October 2004, pp. 2–11.
[4] J. Mai, C.-N. Chuah, A. Sridharan, T. Ye, and H. Zang, “Is sampled data sufficient for anomaly detection?” in6th ACM SIGCOMM Conference on Internet Measurement (IMC 2006). Rio de Janeriro, Brazil: ACM, October 2006, pp. 165–176. [5] R. Sommer and A. Feldmann, “NetFlow: information loss
or win?” in 2nd ACM SIGCOMM Internet Measurement Workshop (IMW 2002). Marseille, France: ACM, November 2002, pp. 173–174.
[6] J. Quittek, S. Bryant, B. Claise, P. Aitken, and J. Meyer, “Information Model for IP Flow Information Export,” IETF,
RFC 5102, January 2008.
[7] F. Hugelshofer, P. Smith, D. Hutchison, and N. J. Race, “Open-LIDS: A Lightweight Intrusion Detection System for Wireless Mesh Networks,” in15th ACM International Conference on Mobile Computing and Networking (ACM MobiCom 2009). Beijing, China: ACM, September 2009, pp. 309–320. [8] C. Estan, K. Keys, D. Moore, and G. Varghese, “Building a
better NetFlow,” inACM SIGCOMM 2004. Portland, OR: ACM, August 2004, pp. 245–256.
[9] E. Cohen, N. G. Duffield, H. Kaplan, C. Lund, and M. Thorup, “Algorithms and estimators for accurate summarization of in-ternet traffic,” in7th ACM SIGCOMM Conference on Internet Measurement (IMC 2007), C. Dovrolis and M. Roughan, Eds. San Diego, CA: ACM, October 2007, pp. 265–278.
[10] M. Crotti, M. Dusi, F. Gringoli, and L. Salgarelli, “Traffic Classification Through Simple Statistical Fingerprinting,”ACM Computer Communication Review (CCR), vol. 37, no. 1, pp. 5–16, January 2007.
[11] A. McGregor, M. Hall, P. Lorier, and J. Brunskill, “Flow Clustering Using Machine Learning Techniques,” in 10th International Workshop on Passive and Active Network Mea-surement (PAM 2004), ser. Lecture Notes in Computer Science, vol. 3015. Antibes Juan-les-Pins, France: Springer, April 2004, pp. 205–214.
[12] M. Roesch, “Snort: Lightweight Intrusion Detection for Net-works,” in13th USENIX Conference on System Administration (LISA 1999), Seattle, WA, November 1999, pp. 229–238. [13] J. Jung, V. Paxson, A. W. Berger, and H. Balakrishnan, “Fast
Portscan Detection Using Sequential Hypothesis Testing,” in IEEE Symposium on Security and Privacy, Berkeley/Oakland, CA, May 2004.
[14] A. Sridharan, T. Ye, and S. Bhattacharyya, “Connection-less port scan detection on the backbone,” in 25th IEEE International Performance Computing and Communications Conference (IPCCC 2006). Phoenix, Arizona, USA: IEEE, April 2006.
[15] S. Chen and Y. Tang, “Slowing Down Internet Worms,” in24th International Conference on Distributed Computing Systems (ICDCS 2004). Tokyo, Japan: IEEE Computer Society, March 2004, pp. 312–319.
[16] T. Karagiannis, K. Papagiannaki, and M. Faloutsos, “BLINC: multilevel traffic classification in the dark,” inACM SIGCOMM 2006. Pisa, Italy: ACM, September 2005, pp. 229–240. [17] B. Claise, “Specification of the IP Flow Information Export
(IPFIX) Protocol for the Exchange of IP Traffic Flow Infor-mation,” IETF, RFC 5101, January 2008.
[18] E. Boschi and B. Trammell, “Bidirectional Flow Export Using IP Flow Information Export (IPFIX),” IETF, RFC 5103, January 2008.
[19] R. T. Lampert, C. Sommer, G. M¨unz, and F. Dressler, “Vermont - A Versatile Monitoring Toolkit Using IPFIX/PSAMP,” in IEEE/IST Workshop on Monitoring, Attack Detection and Mitigation (MonAM 2006). T¨ubingen, Germany: IEEE, September 2006, pp. 62–65.
[20] M. Handley, V. Paxson, and C. Kreibich, “Network intru-sion detection: evaintru-sion, traffic normalization, and end-to-end protocol semantics,” in 10th USENIX Security Symposium, Washington, DC, August 2001.
[21] D. J. Lee and N. Brownlee, “Passive Measurement of One-way and Two-way Flow Lifetimes,”ACM SIGCOMM Computer Communication Review (CCR), vol. 37, no. 3, pp. 19–27, July 2007.
[22] D. G. Altman and J. M. Bland, “Statistics notes: diagnostic tests 1: sensitivity and specificity,”BMJ, vol. 308, no. 6943, p. 1552, June 1994.