Supporting Information for
Flow cytometer-based high throughput screening system for
accelerated directed evolution of P450 monooxygenases
Anna Joelle Ruff1#, Alexander Dennig1#,Georgette Wirtz1, Milan Blanusa2, Ulrich Schwaneberg1*
#
Both authors contributed equally
*Corresponding author: E-Mail: [email protected]
1Lehrstuhl für Biotechnologie, RWTH Aachen University, Worringerweg 1, 52074 Aachen, Germany 2
School of Engineering and Science, Jacobs University Bremen, Campus Ring 1, 28759 Bremen, Germany Jacobs University
Experimental
All chemicals were of analytical grade or higher quality and purchased from Sigma-Aldrich Chemie (Steinheim, Germany), AppliChem (Darmstadt, Germany), and Carl Roth (Karlsruhe, Germany). Oligonucleotides were purchased from Eurofins MWG Operon (Ebersberg, Germany) in salt-free form and diluted in milli-Q water to a final concentration of 100 µM. All primers used are summarized in Supplementary Table S1. Restriction enzymes and nucleotides were purchased from Fermentas (St. Leon-Rot, Germany) and polymerases from New England Biolabs (Frankfurt, Germany). PCRs were performed in 0.2 ml thin-walled PCR tubes from Sarstedt (Nuembrecht, Germany) employing a Mastercycler Gradient PCR-machine from Eppendorf (Hamburg, Germany). DNA was quantified by a NanoDrop photometer from NanoDrop Technologies (Wilmington, DE, USA). DNA-sequencing was performed at GATC Biotech (Konstanz, Germany) and Eurofins MWG-Operon (Ebersberg, Germany). Analysis of obtained sequencing data was performed using the Clone Manager 9 Professional Edition Software (Scientific & Educational Software, Cary, NC, USA).
EpPCR library generation (0.05 mM, 0.1 mM, 0.2 mM MnCl2)
EpPCR-libraries of P450 BM3 were constructed according with variable MnCl2 concentrations
0.05 mM, 0.1 mM, 0.2 mM.1 Gene specific primers P1 and P2 (see supplementary table S1) were used for insert amplification. A standard EpPCR master mix of 50 µl contained: Template plasmid DNA 1 ng/µl, Taq-buffer 1x, dNTPs 0.2 mM, Taq-polymerase 5 U, each primer 0.3 pmol/µl, MnCl2 0.05-0.4
mM. EpPCR protocol: 94°C for 30 sec (1 cycle); 94°C for 30 sec, 60°C for 1 min, 72°C for 1 min/kb (30 cycles); 72°C for 10 min (1 cycle). For vector amplification the primers P3 and P4 (see supplementary table S1) were used. The PCR products were DpnI digested (20 U; 37°C, 3 h) and purified using the Nucleospin Extract II kit (Macherey Nagel, Dueren, Germany). Vector-PCR (50 µl) contained: Template DNA 50 ng/µl, HF-Buffer 1x, dNTPs 0.2 mM, Phusion High-Fidelity DNA Polymerase (NEB) 5 U, each
primer 0.5 pmol/µl. PCR protocol: 98°C for 30 sec (1 cycle); 98°C for 10 sec, 55°C for 30 sec, 72°C for 1 min/Kb (25 cycles); 72°C for 5 min (1 cycle). PCR products were hybridized by using the PLICing cloning method.2
Expression of P450 BM3 muteins
P450 BM-3 mutein expression in flasks and in deep-well microtiterplates was carried out as performed as described previously by Nazor et al..3
Flow cytometry assay with whole cells
Cell populations subjected to be analyzed by flow cytometry were expressed in flasks. As a control, cells expressing the empty vector were used as negative control. After centrifugation of the culture (4000 rpm, 20 min, 4°C), cells were washed in PBS-Buffer and the pellet was resuspended in sterile PBS-buffer (in 1/10 of the culture volume). Reaction mixture (300 µl) contained, 25 µl resuspended cells, 1 µl BCCE (200 mM in DMSO), PBS-buffer (0.03 M NaCl, 2.7 mM KCl, 0.01 M Na2HPO4, 1.8 mM KH2PO4, pH 7.4 adjusted with HCl) and was incubated 90 min. The reaction mixture
was diluted 1:10 in PBS-buffer and filled in 3.5 ml analysis tubes (Sarstedt, Nümbrecht, Germany). The prepared cells were analyzed in a CyFlow Space flowcytometer (Partec, Münster, Germany) at a liquid flow-speed of 5 µl/min, using PBS-buffer as sheet fluid. Data of SSC, FSC and UV-laser emission (FL3: λEx 350 nm and λEm 450 nm) were recorded. Sorting of desired populations occurred under size
triggering and gating the UV-laser emission response with a trigger delay of 2, pulse of 10 and a sorting speed of 300-500 events/sec. Sorted cells were collected, plated on LBkan (50 µg/ml) agar plates and
incubated overnight at 37°C. Enriching for active clones was achieved by washing sorted and recovered colonies from agar plates and expressing them in flasks followed by another round of sorting.
BCCE activity assay in 96-well plate format
The assay was performed analog to the MTP-assay described by Nazor3 with minor modifications. The harvested cells in deep-well plates were resuspended in 300 µl Tris/HCl-buffer (0.1 M, pH 8.2). After addition of 5 µl polymyxin B sulfate (3.6 mM), the 96-well plates were incubated for 15 min at RT at 1000 rpm. 100 µl of the lysate were pipetted into a black flat bottom 96well MTP (Greiner Bio-one, Frickenhausen, Germany ) and incubated for 5 min (700 rpm shaking) with 2 µl of BCCE (2 mM in DMSO). The conversion of BCCE was initiated by addition of 50 µl NADPH (1 mM). The fluorescent signal was recorded for X min (λEx: 400 nm, λEm: 440 nm) using an Infinite M1000 microtiter
plate reader (Tecan Group, Männedorf, Switzerland).
Protein purification
P450 BM3 variants were purified according to published protocol4 by anion-exchange-chromatography using an ÄKTAprime plus pumping system (GE Healthcare, München, Germany) and a Kronlab ECOplus TAC 15/125PE5-AB-2 column (YMC Europe, Dinslaken, Germany) packed with Toyo Pearl 650 S-DEAE Sepharose Matrix (Tosoh bioscience, Tokyo, Japan). The collected fractions were analyzed on a 10 % SDS-PAGE for protein purity. Fractions containing the highest amount of pure
Units (30 kDa cut-off membrane; Millipore, Billerica, USA). Desalting of the purified BM3 variants was carried using a PD-10 Desalting Column (GE Healthcare) equilibrated in Tris/HCl buffer (0.1 M, pH 7.8). Protein solutions were frozen in liquid nitrogen before lyophilization for 48 h in a Christ ALPHA 1-2LD plus lyophilisator (Christ, Osterode am Harz, Germany).
Kinetic Characterisation of P450 BM3 variants
The P450 concentration in solution was determined by carbonmonoxide (CO)-gassing.5 For kinetic characterization a reaction mixture in a black flat bottom MTP contained: 196 µl tris/HCl-buffer (0.1 M, pH 7.8, 60-160 nM purified enzyme, 2 µl of BCCE and 5 µl catalase (12000 U/ml). Estimation of km and Vmax were achieved by varying BCCE concentrations from 0 to 20 mM. The MTP was incubated for 15 min at 800 rpm, before reaction was started by addition of 50 µl NADPH (1 mM). The fluorescent signal (λEx: 400 nm, λEm: 440 nm) was recorded using an Infinite M1000 microtiter plate
reader (Tecan Group, Männedorf, Switzerland). All measurements were done in triplicates. Concentration of the product was calculated from a standard curve obtained for 7-hydroxy-3-carboxy coumarin ethyl ester (3-CCE). Fitting of kinetic parameters was achieved using Origin 7.0 software (OriginLab Corporation, Northampton, MA, USA).
Substrate synthesis6,7
Step 1 – Synthesis of 3-carboxy-coumarin ethyl ester (3-CCE)
8.4 g (60.82 mmol) of 2,4-dihydroxybenzaldehyde was dissolved in 45 ml of anhydrous methanol. Solution was stirred and 8.7 g (54.32 mmol) of diethyl malonate was supplemented and refluxed. 450 mg (5.16 mmol) of morpholin and 150 mg (2.49 mmol) of acetic acid were supplemented to 2 ml of methanol and stirred until the precipitate fully dissolved. This solution was subsequently transferred to the refluxed reaction mixture and reflux was continued for another 3 hours. After cooling, the product was filtered and re-crystallized from boiling methanol (~300 ml).
Step 2 – Preparation of sodium salt 3-carboxy-coumarin
For this step, 1.5 g (6.81 mmol) of 3-CC ethyl ester were dissolved toluene (50 ml), stirred and heated (120°C) and concentrated by evaporation to 5 ml (30-60 minutes). After cooling the mixture to room temperature, 0.5 g (10.84 mmol) of NaH was supplemented. The mixture was heated to 120°C and stirred until toluene evaporated (1-2 hours). The obtained salt was dried in vacuum overnight.
Step 3 – Attaching benzyl group to 3-CC ethyl ester
3 g (12.39 mmol) of prepared 3-CC methyl ester sodium salt was dissolved in 200 ml DMF (dried with molecular sieves). Mixture was heated to 120°C. During heating, 2.138 g (12.5 mmol) of benzyl bromide was supplemented. Mixture was stirred gently and kept at 120°C for 2 hours. One g of benzyl bromide (5.85 mmol) was supplemented and conversion continued at 120 °C for 4-6 hours and the same procedure was repeated once more (supplementing of benzyl bromide 0.7 g, 4.09 mmol; 1 hrs 120°C). Subsequently the reaction mixture was cooled to room temperature and poured into 400 ml of ice cold water. After precipitation (30-60 min), the suspension was filtered, rinsed with water, dried and re-dissolved in CH2Cl2. The organic phase was extracted twice with water, filtered, concentrated
(Rotavap) and the precipitate was dried overnight in vacuum. The targeted compounds were purified by chromatography employing silica gel (DC60). Sample was dissolved in CH2Cl2 and elution was
performed with an ethyl acetate : CH2Cl2 (1:20) mixture. Purity was monitored on TLC using same
solvent system and main fractions were pooled according to TLC. 13C-NMR and 1H-NMR spectra were recorded using a Bruker AV400 (Bruker, Madison, WI, USA).
7-hydroxy-3-carboxy-coumarin ethyl ester (3-CCE): 1H NMR (400 MHz, DMSO) δ 1.29 (t, 3H, J = 7.2 Hz, CH3); 4.26 (q, 2H, J = 7.2 Hz, CH2); 6.73 (s, 1H, ArH); 6.84 (d, 1H, J = 8.5 Hz, ArH); 7.75 (d, 1H,
J = 8.8 Hz, ArH); 8.67 (s, 1H, ArH) ppm. 13C NMR (400 MHz, DMSO) δ 14.09, 60.76, 101.75, 110.39, 112.09, 113.95, 132.06, 149.38, 156.35, 157.06, 162.90, 164.01 ppm.
7-benzoxy-3-carboxy-coumarin ethyl ester (BCCE): 1H NMR (400 MHz, CDCl3) δ 1.32 (t, 3H, J = 7.0
Hz, CH3); 4.31 (q, 2H, J = 7.0 Hz, CH2); 5.07 (s, 2H, CH2); 6.80 (d, 1H, J = 8.7 Hz, ArH); 7.38-7.17 (m,
5H, Ph-Ring); 7.42 (d, 1H, J = 8.7 Hz, ArH); 8.41 (s, 1H, ArH) ppm. 13C NMR (400 MHz, CDCl3) δ
13.26, 60.69, 69.75, 100.34, 110.77, 113.20, 113.22, 125.33, 126.45, 126.46, 127.54, 127.81, 129.72, 134.28, 147.89, 156.11, 156.42, 162.39, 163.13 ppm.
Table S1: Primer used in experimental section
a
bold letters represent phosphorothiolated nucleotides
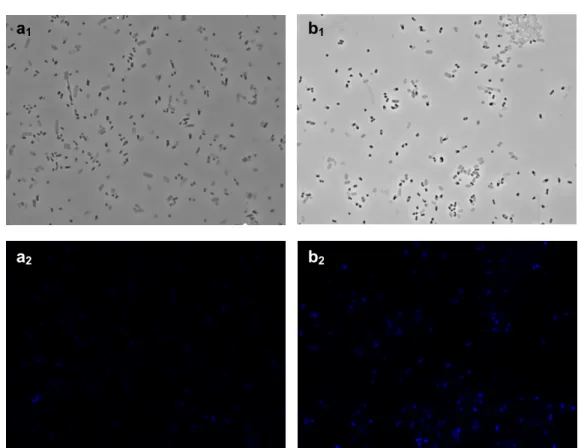
Fig. S1: Phase contrast (a1, b1) and Fluorescence microscopy (a2, b2) after incubation with BCCE and
whole cell expression using an empty vector (a) and P450 BM3 F87A (b). Primer Sequence (5’-3’) P1 a CATGGGCATGACAATTAAAGAAATGCCTCAG P2 a CGACGGAGCTCGAATTCTTATTACCCAGC P3 a CGAGCTCCGTCGACAAGCTTGCG P4 a GTCATGCCCATGGTATATCTCCTTC
a
1a
2b
1b
2Fig. S2: Whole cell re-screening with BCCE after sorting of mixed populations of E. coli cells in ratios 1:1 and 9:1 (active/inactive). 45 clones were tested for ratio 1:1 and 15 clones for ratio 9:1. Threshold for inactive clones was set according to cells not expressing P450 BM3.
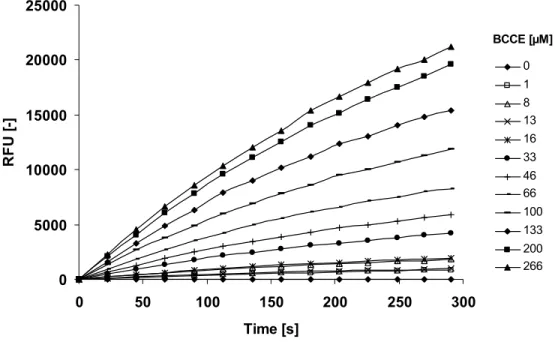
Fig. S3: BCCE conversion with purified P450 BM3 M3 DM-1 (R47F F87A M354S D363H R471C N543S R255H) with varied concentration.
0 5000 10000 15000 20000 25000 0 50 100 150 200 250 300 Time [s] R F U [ -] 0 1 8 13 16 33 46 66 100 133 200 266 BCCE [µM]
Employed P450 BM3 variants
P450 M3: R47F F87A M354S D363H3; P450 M3 DM: R47F F87A M354S D363H R471C N543S; P450 M3 DM-1: R47F F87A M354S D363H R471C N543S R255H; P450 M3 DM-2: R47F F87A M354S D363H R471C N543S R203H I401V F423L
References
(1) Cirino, P. C.; Mayer, K. M.; Umeno, D. Methods Mol. Biol. (N. Y.).2003, 231, 3-9. (2) Blanusa, M.; Schenk, A.; Sadeghi, H.; Marienhagen, J.; Schwaneberg, U. Anal. Biochem.
2010, 406, 141-146.
(3) Nazor, J.; Dannenmann, S.; Adjei, R. O.; Fordjour, Y. B.; Ghampson, I. T.; Blanusa, M.; Roccatano, D.; Schwaneberg, U. Protein Eng., Des. Sel. 2008, 21, 29-35.
(4) Schwaneberg, U.; Sprauer, A.; Schmidt-Dannert, C.; Schmid, R. D. J. Chromatogr., A1999, 848, 149-159.
(5) Omura, T.; Sato, R. J. Biol. Chem.1964, 2379-2385.
(6) Chilvers, K. F.; Perry, J. D.; James, A. L.; Reed, R. H. J. Appl. Microbiol.2001, 91, 1118-1130.