BiomedicalSignalProcessingandControl32(2017)44–56
ContentslistsavailableatScienceDirect
Biomedical
Signal
Processing
and
Control
j ou rn a l h o m e pa g e :w w w . e l s e v i e r . c o m / l o c a t e / b s p c
DSP-based
arrhythmia
classification
using
wavelet
transform
and
probabilistic
neural
network
Jose
Antonio
Gutiérrez-Gnecchi
a,∗,
Rodrigo
Morfin-Maga ˜
na
a,
Daniel
Lorias-Espinoza
b,
Adriana
del
Carmen
Tellez-Anguiano
a,
Enrique
Reyes-Archundia
a,
Arturo
Méndez-Pati ˜
no
a,
Rodrigo
Casta ˜
neda-Miranda
caInstitutoTecnológicodeMorelia,DepartamentodeIngenieríaElectrónica,AvenidaTecnológico1500,Morelia,Michoacán,Mexico bCINVESTAV/IPN,Av.InstitutoPolitécnicoNacional2508,Col.SanPedroZacatenco,C.P.07360México,D.F.,Mexico
cUniversidadAutónomadeZacatecas,UnidadAcadémicadeIngenieríaEléctrica,JardínJuárez147,Zacatecas,Mexico
a
r
t
i
c
l
e
i
n
f
o
Articlehistory:
Received6August2015
Receivedinrevisedform2October2016 Accepted15October2016
Availableonline31October2016
Keywords:
Cardiacarrhythmiaclassification Digitalsignalprocessing Wavelettransform Probabilisticneuralnetwork
a
b
s
t
r
a
c
t
Alargepartofthebiomedicalresearchspectrumisdedicatedtodevelopelectrocardiogram(ECG)signal processingtechniquestocontributetoearlydiagnosis.However,itiscommontofindthatECGanalysis methodsreportedareconfinedtooff-linePChostoperation.Theauthorspresentanarrhythmia classifi-cationmethodimplementedonaDigitalSignalProcessing(DSP)platformintendedforon-line,real-time ambulatoryoperationtoclassifyeightheartbeatconditions:normalsinusrhythm(N),auricular fibrilla-tion(AF),prematureatrialcontraction(PAC),leftbundlebranchblock(LBBB),rightbundlebranchblock (RBBB),prematureventricularcontraction(PVC),sinoauricularheartblock(SHB)andsupraventricular tachycardia(SVT).Thealgorithmusesawavelettransformprocessbasedonquadraticwaveletsfor iden-tifyingindividualECGwavesandobtainafiducialmarkerarray.Classificationisconductedbymeansofa ProbabilisticNeuralNetwork.Thealgorithmistestedwith17ECGrecordsobtainedfromthePhysioNet repository.TheproposedclassificationprocedurewastestedinitiallyonMATLABandtheresultswhere comparedwiththeequivalentanaloguedatafedtoaDSP-basedECGdataacquisitionprototypethrough anarbitrarywaveformgenerator.Theresultsderivedfromconfusionmatrixtestsyieldedon-line clas-sificationaccuracyof92.69%(AF),97.15%(N),76.82%(PAC),91.06%(LBBB),87.5%(RBBB),71.04%(PVC), 91.94%(SHB)and95.45%(SVT),overallclassificationrateof92.746%and100%agreementbetweenthe MATLABandon-lineDSPimplementations.Theresultssuggestthatthemethodandprototypepresented maybesuitableforbeingimplementedonwearablesensingapplicationsauxiliaryforon-line,real-time diagnosis.
©2016TheAuthors.PublishedbyElsevierLtd.ThisisanopenaccessarticleundertheCCBY-NC-ND license(http://creativecommons.org/licenses/by-nc-nd/4.0/).
1. Introduction
Cardiac arrhythmia occurs intermittently at early stages of heartdiseasewhichdifficultearlydiagnosis.Undiagnosedcardiac arrhythmiasoftenevolveundetected[1],reducing the effective-nessoftreatmentinadvancedstages.Inaddition,tachyarrhythmic eventsareassociatedwithsuddendead[2],occurringlessthanan houraftersymptomsonset[3].Thus,alargepartofthebiomedical researchspectrumisdirectedtowardsdeveloping electrocardio-gram(ECG)diagnosticequipmentandsignalprocessingtechniques
[4]tocontributetoearlydiagnosissoastoimprovethe effective-nessofheartdiseasetreatmentbeginningattheearlystages.On
∗Correspondingauthor.
E-mailaddress:[email protected](J.A.Gutiérrez-Gnecchi).
theotherhand,current trendsin ambulatorydiagnostic equip-mentinvolvetheuseofremoteimplantablemonitoring[5]and wearablesensingtechnologies[6]thatmayfacilitateobtaining on-linereal-timedataforimmediate,remotediagnosis.Theadvances inelectronicstechnologyduringthelastdecadehavecontributed tothedevelopmentof commercial,powerful mixed-signaldata acquisitionandprocessingdevices, suitableforwearablesensor applications.Thereforemethodsforreal-timecardiacarrhythmia detectionforambulatorydataacquisitiondevicesarecontinuously reportedthatmayresultinenhancedon-linedetectionof inter-mittenteventsthatmayotherwisebeundetected.However,many ECGanalysisresultsreportedareconfinedtotraditional,off-line, PC-basedoperation.Here,theauthorsaddresstheimportanceof arrhythmiaclassificationproceduresintendedforon-line opera-tionandcompareresultsobtainedoff-linewiththoseprocessed throughtheDSPhardwaredevelopedforthisapplication
http://dx.doi.org/10.1016/j.bspc.2016.10.005
1746-8094/©2016TheAuthors.PublishedbyElsevierLtd.ThisisanopenaccessarticleundertheCCBY-NC-NDlicense( http://creativecommons.org/licenses/by-nc-nd/4.0/).
J.A.Gutiérrez-Gnecchietal./BiomedicalSignalProcessingandControl32(2017)44–56 45
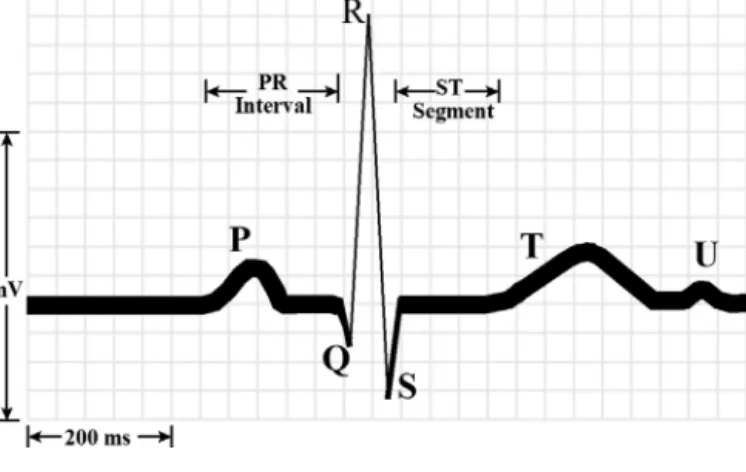
Fig.1. NormalECGpattern.
1.1. Arrhythmiaclassificationprocedures
Thetermarrhythmiaisassociatedwithchangesoffrequency, rhythmormorphologyoftheECGsignalincomparisonwithnormal ECGvalues(Fig.1).
Ingeneral,andinaverysimplifiedmanner,arrhythmia classifi-cation[7]fromECGgraphicalrecordsinvolves5mainsteps: (A)Calculate cardiacfrequency. Theheartbeatrate(HR) is
con-sidered normal between 60 beats per minute (bpm) and 100bpm[8,9].BasedsolelyonHR,arrhythmiascanbe classi-fiedasbradyarrhytmias(HR<60bpm)andtachyarrhythmias (HR>100bpm).Cardiacfrequencycalculationisprobablythe easiest process that can be implemented on-line, and thus hasbecomeanintegralpartofECGASIC(ApplicationSpecific IntegratedCircuits)hardware(i.e.TexasInstrumentsADS129X series).
(B)MeasuretheRRinterval.TheRwave-to-Rwaveinterval(RR)is anindicatorofventricularrateandshouldberegularwithless than0.12sdifferencebetweenheartbeats.
(C)ExaminethePwave.IfthePwaveprecedestheQRScomplexthe impulseisgeneratedintheSAnode.Thepresenceofabnormal locationsofthePwavesmayindicateanectopicpacemaker. (D)Measure the PRInterval. The normal interval is considered
between0.1and0.2s.Alargerdifferenceindicatesadefectof theconductionsystem.
(E)Measure theQRS complex duration and morphology. Ifthe widthbetweenthebeginningoftheQwaveandtheendofthe Swaveislargerthan0.12s,theremaybeanintraventricular conductiondefect.
Thestepsoutlinedheredonotintendtodiminishinanyway thecomplexnatureoftheECGsignal,butmerelytoserveasa start-ingpointforhighlightingsomeoftheECGprominentfeaturesthat needtobeanalyzedthatcanleadtoautomatedarrhythmia classi-fication.Inaddition,theexpertiseofthespecialistforanalysingthe graphicalrecords,isakeyfactorinidentifyingheartbeatconditions relatedtospecificcardiopathies.
Thus,achievingaccurateautomatedarrhythmiadiagnosisisa challenginggoalthathastoaccountformultipleheartbeat char-acteristics.Forinstance,supraventricularheartrhythmdisorders includedifferenttypesofarrhythmias, eachonepresenting dif-ferentECGsignalsignaturesthatdefytheaccuracyofdetection and classification procedures. As an example, atrial fibrillation (AF)isconsideredthemostcommonarrhythmiacharacterizedby theabsenceofprominentP-wavesoftenappearingasfibrillatory wavesontheECGrecord,andvaryingRRintervals.Theprevalence ofAFisofgreat interestfordevelopingautomatedclassification
methodssoastoaiddiagnosis.However,thedifficultiesto corre-latetheabsenceofP-wavesandirregularRRintervalsorexisting Pwavesinchaoticheartrhythmscanleadtomisdiagnosedatrial fibrillation[10].TheinherentdifficultyofidentifyingtheECGwaves correspondingtoAFmayalso leadtoautomated classifications errors[11].Supraventriculartachycardiaisanotherexampleofan abnormalheartrhythmwherethereisanincreaseinheartbeatrate andtheP-waveoverlappingthenarrowQRScomplex[12].Thus,in automatedECGanalysis,thereareanumberofpreprocessingand signalcomponentidentificationanalysisproceduresthatneedtobe carriedoutpriortoclassification.Moreover,giventhevastamount ofinformationthatcanbederivedfromtheECGrecords,several methodologieshavebeen,andcontinuetobeproposedtotryto cor-relatesuccessfully,ECGsignaldeviationsfromthestandardpattern tospecificarrhythmiaconditions(Table1).
Thus, ingeneral,there arethree main processesinvolved in arrhythmiaclassificationsprocedures:ECGsignalpreprocessing, ECGwavecomponentdetectionandclassification.
1.1.1. ECGsignalpreprocessing
SincerealECGsignalsarenoisy(i.e.whiteandmainsnoise)and contaminatedwithartefacts(i.e.electromyographicsignalsdueto breathingand chestmovement)thefirststepgenerallyconsists of bandpassfilteringthemeasured signals.The choiceof over-all bandpassfilter bandwidthas initialstage is a compromise; it shouldallowbaseline(isoelectric)correctionaswellasnoise reductionwithoutlosinghigh-frequencydetailsthatmaybe crit-icalforindividualwaveidentification[13].Theuseofawavelet denoisingoperation,priortofeatureextraction,hasbeenshownto preservethesharpfeaturesoftheECGsignal[14].For instance, Chen et al.[15] use a wavelet denoisingstage basedon a dis-cretewavelettransform,withthreelevelsofdecomposition,asthe firstprocessingstageforreal-timeQRScomplexdetection.Thusa waveletdenoisingoperationappearstobesuitableforon-line oper-ationwhile maintainingtheECGfeaturesfor furtherprocessing stages.
1.1.2. ECGfeatureextractionbasedonwavelettransform operations
ThenextstepinECGarrhythmiaclassificationconsistsof iden-tifyingindividualECGwavecomponents.Manyanalysismethods for automaticheartbeatclassificationhave originatedfromQRS complexsignalprocessingmethods[16],becausetheQRS com-plexrepresentsthe mostpronounced characteristic of theECG signal. One of the techniques that hasbeen favoured to iden-tify individualECGsignalcomponentsis thewavelettransform (WT)usingavarietyofwaveletfunctions.Amongstthereported waveletfunctionsusedforECGcomponentidentificationarethe Haarwavelet[17,18],theMexicanhatwavelet[19,20],theMorlet wavelet[21,22]quadraticsplinewavelet[23]andcombinationof waveletfunctions[24].
In [13] the authors present a wavelet-based QRS complex detectionalgorithmonsignalscontaminatedwithsimulated elec-tromyographic noise which ledto a seriesof resultssimilar to thosepresentedintraditional QRSdetection[25,26]techniques. Theauthorsin[27]presenttheuseoftheHaardiscretewavelet transformfor QRSdetection; theiralgorithmachieveda 95.74% detectionaccuracyrateon5testsubject’sdatarecords,in compar-isonwiththemethodpresentedin[28]whichyieldedanaccuracy of92.55%.
In[29]theauthorsuseacubicsplinewaveletfordetectingthe QRScomplexwhichresultedinameandetectionerrorof0.75%.In
[30],eight30-minMIT/BIHdatabaserecordswereanalyzedusing acontinuouswavelettransformproceduretodetectthe character-isticpointsoftheQRSandTwavesyieldinga0.47%falsedetection rate.QRScomplexdelineationisanothertypeofalgorithmaimedat
46 J.A. Gutiérrez-Gnecchi et al. / Biomedical Signal Processing and Control 32 (2017) 44–56 Table1
ReviewsummaryofproposedECGsignalprocessingmethodsforfiltering,featureextractionandarrhythmiaclassification.
Authoranddate TypeofECGanalysis Processingfunction Testconditions Results
Okada(1979)[26] QRSdetection Five-stepdigitalfilter Dataobtainedfrom4patientsinsurgery Anoveralldetectionratebetterthan99.98%canbe inferred
PanandTompkins(1985) [39]
Real-timeQRSdetection Digitalanalysisofslope,amplitudeand widthofthesignalforQRSdetection. Bandpassfiltertoreducefalsedetections andadjustableparameterandthreshold leveltoaccommodateECGchangesasQRS morphologyandheartrate
Theauthorsuse48MIT/BIHarrhythmia databaserecords
Achievedanoverall0.675%errordetectionrate
HamiltonandTompkins (1986)[25]
QRSdetection Combinationoflinearandnon-linear
digitalfilters.PeakdetectorandQRS decisionrules
48recordsobtainedfromtheMIT/BIH databaserecordstotestdedicatedQRS detectionhardware
Achieved99.69%sensitivityand99.77%positive predictivity
Sunetal.(1992)[40] Real-timeQRSdetection Comparisonofnonlineartransformations andadaptivethresholdingwithrespectto theOkada[26]method
Theauthorsuse8recordsobtainedfrom theAmericanHeartAssociation(AHA) database
Thethreepointwithsignconsistencyalgorithm performancewassimilartothatoftheOkadamethod. Asetofconclusionsforhardwareimplementation weregiven
Lagunaetal.(1994)[36]. QRS,PandTwavesinmultileadECG signals
Combinationofmethodsincluding bandpasslinearfilter,lowpass differentiator,moving-window integration,adaptationofthePanand Tompkins[39]methodforsingle-leadQRS detection.Decisionruleformulti-leadQRS detection.Peakandzerocrossinglocation anddifferentiatedthreshold
TestedusingMIT/BIHdatabaserecords. ValidationoftheprocedureusingtheCSE database
Algorithmyieldsmeasurementswithstandard deviationscomparedtothosemadebyhuman specialists
Lietal.(1995)[44] QRS,PandTwaves Quadraticsplinewavelet Theauthorsuse46datarecordsobtained
fromtheMIT/BIHdatabase
TheWTalgorithmproduceda99.8%QRScomplex detectionaccuracy
SoandChan(1997)[28] QRSdetection Digitalfilter,maximumslopedetection basedonfirstderivativemethod
Algorithmstestedon20AmericanHeart Association(AHA)records
Reducedaccuracyincomparisontoothermethodsbut simpler,soitispossibletoimplementforon-line operation
Kadambeetal.(1991)[13]. QRSdetection Cubicsplinewithcentrefrequencyat 120Hzand204Hzbandwidthto implementtheDyadicWaveletTransform (DyWT)
TestedontheAmericanHeartAssociation database(80dualchannelECGdatatapes)
Resultssimilartoothertechniques
(Hamilton-Tompkins[25],Okada[26],MOBD[40])
Dinhetal.[29]. QRSdetection Cubicsplinewavelet Theauthorsusethefirstfour-minute
signalsof25recordsobtainedfromthe MIT/BIHdatabase
Reducedmeandetectionerrorvaluesof0.75%
Homaeinezhadetal. (2001)[37].
QRScomplexgeometricalfeature extractionappliedtoheartbeat classification
Combinationofquadraticsplinewavelet andFuzzyinferenceclassification
Methodtestedusing12MIT/BIHdatabase recordstoclassify4heartbeatconditions
Algorithmyieldeda94.58%(FCMclustering)and 97.41%accuracy(fuzzyclassifierbasedonsubtractive clustering)
BurkeandNasor(2002) [20]
ECGcomponentsdetection MexicanHatWavelet Useddatafrom21healthysubjectsaged
between13and65yearsoldtoexamine timingrelationshipsofECGcomponents
Characterizationofeachcomponenttimingvariation bypolynomialapproximation
SchuckandWisbeck (2003)[21]
QRSdetection ComplexMorletwaveletfunction 25recordobtainedfromtheMIT/BIH
database.SoftwarecodedinMATLAB
Improvedresultsincomparisonwiththoseobtained bypreprocessingthesignalaccordingtothePan& Tompkins[39]andHamilton&Tompkins[25]method Alexakisetal.(2003)[38] Detectionofdelayedventricular
repolarisationbasedonfiveECG features(RR,RTc,Twaveamplitude,T waveskewnessandTwavekurtosis)
Performancecomparisonbetween ArtificialNeuralNetwork(ANN) (multilayerperceptron)andLinear DiscriminantAnalysis(LDA)
ECGrecordsandcorrespondingblood glucoselevelsobtainedfromeleventype-1 diabeticpatients
TheANNmethodyieldedamaximumaccuracyof 87.5%whereastheLDAmethodmaximumaccuracy was89.96%
Martínezetal.(2004)[31] QRSdetectionandECGdelineation QuadraticSplinewavelet Theauthorsconductanextensivetest programmeon48MIT/BIH,105QT,90 EuropeanST-Tdataset3(125files)ofthe CESmultileadmeasurementdatabase
Obtaineda99.66%sensitivityandpositivepredictivity of99.56%usingtheEuropeanST-TandCSEdatabases. TheresultsusingtheMIT/BIHdatabaseresultedin sensitivityandpositivepredictivitybetterthat99.8% Atouietal.(2004)[33] 12-leadECGsynthesis Comparestheresultsofusingamulti-layer
feedforwardartificialneuralnetworkwith supervisedtrainingandamultiple regression-basedanalysismethod
Theauthorsuseover300datarecordfrom adultpatients
Therootmeansquareerrorandcorrelationcoefficients obtainedusingtheANNmethodwerebetterthatthose oftheregressionmethodsuggestingthatanANN approachcanbeusedtosynthesizeECGsignals
J.A. Gutiérrez-Gnecchi et al. / Biomedical Signal Processing and Control 32 (2017) 44–56 47
deChazaletal.(2004)[35] Classificationof5heartbeatconditions (normalbeat,ventricularectopicbeat, supraventricularectopicbeat,fusionof anormalandventricularectopicbeat andunknownbeattype)
Preprocessingusingamedianfilter, manuallyallocatedfiducialpointsfor heartbeatdetection,segmentationbased ontheLagunaetal.method[36]and featureextractionbycalculatingfeatures separatelyrelatingtoheartbeatintervals
44nonpeacemakerrecordingsfromthe MIT/BIHdatabase
Theproposedindependentperformanceassessment yieldedasensitivityof75.9%,apositivepredictivityof 38.5%,andafalsepositiverateof4.7%fortheSVEB class.FortheVEBclass,thesensitivitywas77.7%,the positivepredictivitywas81.9%,andthefalsepositive ratewas1.2%
Gutiérrezetal.(2005)[17]. QRSdetection Haarwavelet Testedon25MIT/BIHrecordsand48
EuropeanST-Trecords
Achievedfiguresof1.19%and0.19%erroronMIT/BIH andST-Trecordsrespectively
Alvaradoetal.(2005)[30]. QRSandTwavedetection Continuoussplinewavelettransform 8recordsobtainedfromtheMIT/BIH databasewereusedtoevaluatethe algorithm
Theauthorsobtainedanaverage0.47%detectionerror
Tsipourasetal.(2005)[34]. Arrhythmiaclassificationbasedon RR-intervalidentificationusing knowledge-basedmethods
Loworderpolynomialsforpreprocessing (baselinecorrection),Hamiltonand Tompkins-basedalgorithmforQRS detectionandRR-intervalsignal computation.Asetofrulesforarrhythmic beatclassificationusinga3RR-interval window.Deterministicautomatonfor arrhythmicepisodedetectionand classification
48ECGrecordsobtainedfromtheMIT/BIH database
Themethodresultedin98%accuracyforarrhythmic beatclassificationand94%accuracyforarrhythmic episodedetectionandclassification
Chenetal.(2006)[15]. QRSdetection Movingaverage(Daubechies4Waveletfor signaldenoising)
45patientrecordobtainedfromthe MIT/BIHdatabase.Softwarecodedin MATLAB
Reducedcomputationaltimetocompleteoneanalysis procedure(1.5ms)onanIntelprocessor-basedPC. Achieved99.5%detectionrate
Linetal.(2008)[45] Classificationof7heartbeatconditions: normalbeat,supraventricularectopic beat,bundlebranchectopicbeat,and ventricularectopicbeat
CombinationofMorletWaveletfunction andProbabilisticNeuralNetwork(PNN)
DataextractsfromMIT/BIHdatabase Theclassificationaccuracyishigh(upto100%)whena singlearrhythmiaispresentsbutdegradeswhen multiplearrhythmiasarepresent
Kanekoetal.(2011)[18] QRSclassification CombinationofHaarwaveletandSelf OrganizingMap(SOM)
16recordsobtainedfromtheMIT/BIH database
Improvedresultsclassifying5beatconditionsin comparisontoother(cross-correlation,FFTandonly SOMmethods)
Ieongetal.(2012)[23]. QRSdetection QuadraticSplinewavelet 48recordsobtainedfromtheMIT/BIH
databaserecordstotestdedicatedQRS detectionhardware
Thededicatedhardwareshowedhighsensitivity (99.31%)andpredictivity(99.70%)inreal-timetests
Jaswaletal.(2012)[27] QRSdetection Haarwavelet Dataobtainedfrom5subjects.94beats
analyzed
Improveddetectionaccuracyvaluesof95.74%in comparisonwithresultsanalyzedusingtheSoand Chan[28]method(92.55%)
ManikandanandSoman (2012)[32]
R-peakdetection CombinationofHilbertTransformand
movingaveragefilter
48recordsobtainedfromtheMIT/BIH databaserecords
Achieved99.80%averagedetectionrate,99.93 sensitivityand99.86%positivepredictivity
Zengetal.(2013)[24] QRSdetection CombinationofMexican-hatandMorlet
Wavelets
10recordsobtainedfromtheMIT/BIH database
Achieved99.71%ofdetectionsensitivityand99.53% positivepredictionvalues
Ebrahimnezhadand Khoshnoud(2013)[46]
Classificationof4heartbeat conditions:Normalsinusrhythm, Atrialprematurecontraction(APC), Rightbundlebranchblock(RBBB)and Leftbundlebranchblock(LBBB)
CombinationofLinearpredictive coefficientsandProbabilisticNeural Network
Theauthorsuse48datarecordsobtained fromtheMIT/BIHdatabase
Themethodyielded92.9%accuracyand93.17% sensitivity
YuandChen(2007)[47] Classificationof6heartbeat conditions:normalbeat(N),theleft bundlebranchblockbeat
(LBBB),therightbundlebranchblock beat(RBBB),atrialprematurebeat (APB),prematureventricular contraction(PVC),andpacedbeat(PB)
HaarwavelettransformandProbabilistic NeuralNetwork
Theauthorsuse23recordsfromthe MIT/BIHdatabase
Theauthorsobtaineda99.65%accuracydetecting6 heartbeatconditions
Vassilikosetal.(2014)[22] QRSfeatureanalysis ComplexMorletwaveletfunction Analysisof38recordsobtainedfrom patientswithischaemic(39%)and non-ischaemic(61%)cardiomyopathy
FoundthatQRSanalysisbasedonMorlet-based waveletisabetterpredictorofresponsetocardiac resynchronizationtherapy(CRT)thanQRSduration
48 J.A.Gutiérrez-Gnecchietal./BiomedicalSignalProcessingandControl32(2017)44–56
identifyingpeaks,beginningandendofPandTwaves[31].In[25]
theauthorsuseawavelettransformprocesstodelineatetheQRS complexbypeakdetection.In[32]theauthorsaddresstheissueof thenon-stationarynatureoftheQRSmorphologyforR-peak detec-tionandproposeacombinationoftheHilberttransform(HT)and movingaverage(MA)filtertoyielda99.80%averagedetectionrate on48MITECGrecords.
1.1.3. Arrhythmiaclassificationprocess
Onceindividual wave componentshave beenidentified, the resultsaretransferredtoaclassifierprocess.Theauthorsin[33]
useamultilayer,3-inputneuron,feedforwardartificialneural net-worktrainedwithsupervisedbackpropagation;theresultsusing 1-seconddataextractsfrom10-secondregisterssampledat1ksps (kilosamplespersecond)werebetterthanthose obtainedusing multipleregressionanalysis.Theauthorsin[34]exploretheuse oftheRR-intervalforarrhythmiaclassificationusing knowledge-based methods to classify four heartbeat conditions (normal, prematureventricularcontractions,ventricularflutter/fibrillation and2ndheartblock)andsixrhythmtypes(ventricularbigeminy, ventriculartrigeminy,ventricularcouplet,ventriculartachycardia, ventricularflutter/fibrillationand2ndheartblock),yieldinga98% accuracyforarrhythmic beatclassificationand94%accuracyfor arrhythmicepisodedetectionandclassification.
Theauthorsin[35]usetheprogrammeofLagunaetal.[36]to feedmanuallyallocateddetectedheartbeatsinoneofthefivebeat classesrecommendedbyANSI/AAMIEC57:1998standard, result-inginasensitivityof75.9%,apositivepredictivityof38.5%,and afalsepositiverateof4.7%forthesupraventricularectopicbeat (SVEB)andasensitivityof77.7%,positivepredictivity81.9%,and false positive rate of 1.2% for unknown beat type. In [18] the authorspresentanautomatedclassificationmethodusingtheHaar wavelettransformandatwo-layerSelfOrganizingMap(SOM)to classifyfive heartbeatconditions and comparetheresultswith cross-correlation coefficient, single layer classification method withpowerspectrumandtwolayeredSOMclassificationwithtime domainparameters.Theresultsyielded0.39%classificationerror rateforWT-SOMcombinationincomparisonwith0.82%errorrate obtainedusingthecorrelationcoefficientmethod.Homaeinezhad etal.[37]reports theresultsofcombiningaQRScomplex geo-metricalfeatureextractiontechniqueandfuzzynetworkclassifier toclassifyfourheartbeatconditions(Normal,LeftBundleBranch Block(LBBB),RightBundleBranchBlock(RBBB),PacedBeat(PB)) in12MIT/BIHrecordsyieldingaccuraciesof94.58%and97.41%for FuzzyC-meansandsubtractiveclustering-basedfuzzy-logic classi-fiers,respectively.In[38]theauthorscomparetheresultsofusing amultilayerperceptronartificialneuralnetwork(MLP-ANN)and LinearDiscriminantAnalysis(LDA)todetectdelayedventricular repolarisationbasedonfiveECGfeatures(RR,RTc,Twave ampli-tude,TwaveskewnessandTwavekurtosis)andresultedin85.07% detectionaccuracyusingtheANNmethodand89.96% accuracy usingtheLDAmethod.Theimportanceofreal-timesignalwave identification[39]basedonmicroprocessingunits[40]hasbeen addressedforover3decadesandhasresultedincontinuous pro-posalandevaluationofdifferentmethodologies[41].In[17]the authorsconsideron-lineimplementationofQRScomplex detec-tionbasedonHaarWavelettransformresultingin1.19%and0.19% errorwhenevaluating24MIT/BIHand48ST-Tdatabaserecords respectively.InparticulartheProbabilisticNeuralNetwork(PNN) Classifierhasbeensuggestedtobesuitableforimplementationon dedicatedprocessinghardware,duetoacceptabletime and fre-quencyresolutionwhenappliedtoECGanalysis.Theauthorsin[42]
presentaMATLABprogrammetoexplorethefeasibilityofusinga combinationofbumpfunctionandprobabilisticNeuralNetworkto classifyeightheartbeatconditionsusing17MIT/BIHrecords.
2. Methods
Ingeneralterms, theclassificationtaskconsistsof obtaining thewavelettransformofa6-secondsegmentportionoftheECG recordtoobtainthefiducialmarker(detectionandlocationof sin-glewavecomponents)andfeaturearraystofeedtheProbabilistic NeuralNetwork.However,asoutlinedinSection1.1,the proce-dureinvolvesseveraloperationsineach ofthethreeprocessing stages:preprocessing,signalprocessingforfeatureextractionand classification(Fig.2).
2.1. Wavelettransform(WT)
Thewavelettransformisusedtoobtainatime-frequency com-ponentrepresentationindifferentbandwidths.Considerafunction ofrealorcomplexvalues,(t),inHilbertspaceL2(R),whereL
rep-resentsthevectorspaceofsquare-integrablefunctions,withzero mean(1):
+∞ −∞(t)dt (1)
andsquarenormone(2):
+∞−∞
(t)2dt (2)Afamilyofwaveletfunctionsisobtainedfrom(3): u,s(t)=√1 |s|
t−u s (3) wheresrepresentsthescalefactorcontracting(s<1)orexpanding (s>1)thewaveletfunction.Thetranslationalfactoruisusedtoshift thelocationofthewaveletfunction.Theterms−1/2isanenergynormalizationparameteracrossthedifferentscales.
Thus,thecontinuousWTrepresentationoffunctionf(t)∈L2(R)
(4): Wf(u,s)=f∗ ∗u,s=
+∞ −∞ f(t)√1 s ∗t−u s dt (4)Scalingthetranslationalfactorallowsseparatingthesignal com-ponentsintofrequencyrangesorscales.Inordertoimplementthe WTona digitalsignalprocessingplatform toprocess realdata, itisnecessarytoutilizeafastdiscretetransformation.Giventhe scalefactors=2jwherej∈Z,andZisthesetofallintegers,yields
thebinaryordyadicwavelettransform[43];choosingthe transla-tionalandscalingfactorstobemultiplesoftwo,resultsinadiscrete binarywavelettransformimplementationsuitablefordigitalsignal processingapplications.Thediscretewavelettransformofadigital signalf(n)canbeobtainedfrom(5)and(6):
S2jf(n)=
k∈Z hkS2j−1f(n−2j−1k) (5) W2jf(n)= k∈Z gkS2j−1f(n−2j−1k) (6)where sj2f(n) are approximation coefficients, W2jf(n) represent detailcoefficients(2jscalewavelettransformoff(n))andnisthe
samplenumber.Theterms{hk,k∈Z}and{gk,k∈Z}correspond
tolowpasscoefficients(H(ω))(7):
H(ω)=
k∈Zhke−ikw (7)
andhighpasscoefficients(G(ω))respectively(8):
G(ω)=
k∈ZJ.A.Gutiérrez-Gnecchietal./BiomedicalSignalProcessingandControl32(2017)44–56 49
Fig.2. BlockdiagramoftheECGarrhythmiaclassificationoperation.
Fig.3.TheMallatfilterbankimplementation.
Thewaveletprocessusedhereisbasedonaquadraticwavelet functionwithFourierTransform[50]
˝=i˝ sin ˝ 4 ˝ 4 4 (9)Thefiltersareimplementedas(10)and(11)[31,44]: H(˝)=e i˝ 2
cos˝ 2 3 (10) G(˝)=4ie i˝ 2 sin˝ 2 (11) andthus h[n]=1 8 ı[n+2]+3ı[n+1]+3ı[n]+ı[n−1] (12) g[n]=2ı[n+1]−ı[n] (13)TheDWT computation ofis conductedwitha filter bankas describedbyMallat[51](Fig.3).
2.2. ECGsignaldenoising
PriortocommencetheindividualECGwaveidentification,itis necessarytoperformotherdigitalsignalprocessingoperations.The
originalECGrecord(Fig.4A),isdisplacedfromthebaselinedueto multipleeffects.
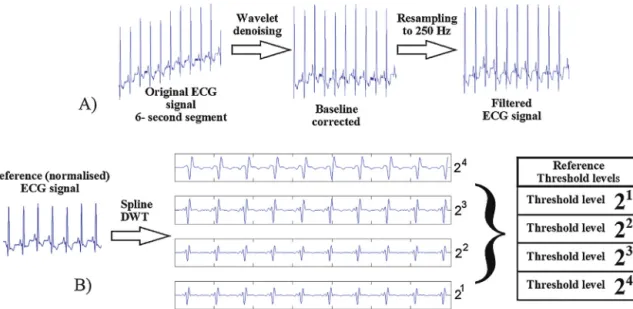
The first processing step consists of restoring the baseline usingwaveletdenoisingprocessasdescribedelsewhere[42].The restoredsignalisthenresampledto250Hz,andband-rejectfiltered toreducetheeffectofthemains(50or60Hz,selectable).
Thesignalwaveidentificationproceduresrequireestablishing a setofthresholdvalues. Thepreprocessingstage alsoincludes applyingtheWaveletTransformtoareferenceECGsignaltoobtain, off-line,thethresholdvalues(Fig.4B).
2.3. IndividualECGwaveidentification
The WT coefficients for feature extraction accommodate fourscales; each scalecorresponds toa predefinedbandwidth: 62–125Hz,18–60Hz,8–26Hzand4–13Hz(Fig.5B).Detectionand localizationofRpeaksisperformedusingthefirstthreescalesofthe wavelettransformbasedonthedetectionofmaximumand mini-mumvalues.LocationofQandSwavesisbasedondetectinglocal maximumandminimumvaluesthatdonotexceedthirtypercent ofthemaximumthresholdvaluenearesttotheRpeak.PandTwave detectionisperformedonthefourthscalebecausetheyarelower frequencywaves.Anidentifiermarkisassignedatthebeginning andattheendofeachECGwavedetected(Fig.5C).
TheidentificationofindividualECGwavesandtheclassification canbesummarizedinsevenmainsteps:
(a)Heartbeatidentification. Heartbeat identificationis based on detectingthemaximumandminimumvaluesatthedifferent scales.ConsideringthatW2jf(0)isaminimumormaximum,
W2jf()isthelargestmagnitudefromlefttorightandW2jf() isthelargestmagnitudeoftheoppositeside,if
W2jf(0)>50 J.A.Gutiérrez-Gnecchietal./BiomedicalSignalProcessingandControl32(2017)44–56
Fig.4. PreprocessingtheECGsignalincludesperforming(A)signaldenoisingandresamplingoperationstopreparetheECGsignalforfeatureextractionand(B)obtaining thethresholdreferencevaluesinthefourscales.
W2jf()andW2jf(0)>W2jf()thenW j2f(0)isaminimum
ormaximum[44].
(b) Rwaveidentification.Afterthemaximumandminimumvalues havebeendetermined,athresholdvalueisusedtodetecttheR waveoccurrencealongthefourwaveletscaleresults.Sincethe magnitudeisnotconstant,adynamicallyadjustablethreshold valueisusedtoobtainfourlocalizationgroupsets(14):
n4
k,n3k,n2k,n1k k=1,...,N
(14)
Fig.5. WavelettransformandECGwavelocation.(A)OriginalECGsignal,(B)results ofthewavelettransformand(C)individualwaveidentificationprocesses.
wherethesuperindextypographicalmarkindicatesthewavelet transformscaleandthesubindexmarkcorrespondstothekth maximumdetected.
(c)Eliminate false R peaks. Although the dynamic thresholding operationservesasafirstwayofreducingfalseRpeaks,there maybesomeartefactsthatresultedinfalsemaximumvalues. Sincenotallthemaximumpointsdetectedmaycorrespondto anRpeak,itisnecessarytoremovefalseRpeaks.Considerthat, withinatimeintervalof120ms[44],therearetwomaximum negativevalues,NEG1 andNEG2,withabsolutevalueA1 and A2,andtwomaximumpositivevaluesnamelyL1andL2.The
decisionruletoremovefalseRpeakscanbesummarizedas: if A1 L1 >1.2 A2 L2 ∴NEG2isredundant (15) if A2 L2 >1.2A1 L1 ∴ NEG1isredundant (16)
IfNEG1andNEG2resideonthesamesideofthepositivevale,
thenegativevaluefurtherawayisconsideredredundant.The processisrepeateduntilthenumberofdetectionsisevenand coincideswiththenumberofnegativevalues.
(d)Locatethe R peak. TheR peak canbelocated fromthepair maximum-minimumzero-crossings.In[44]theauthors pro-posetheuseofscale21todetecttheRpeakposition.However,
whenthesignalcontainselectromyographicnoisetheremay bemorethanasinglezero-crossingoccurrencedetectablein scales21and22.InadditionECGbaselinedriftcanmodifythe
zero-crossinglocationinscale24.Therefore,thescaleusedfor
Rpeaklocationis23.
(e)DetectionofthebeginningandendoftheQRScomplex.The detec-tionprocessusesawindowof120msoneachsideoftheRpeak detected.ThebeginningoftheQRScomplexcandidateisthe firstlocalmaximumbeforeanRpeakandtheendisthefirst minimumafteranRpeak.InthecasewherethereisnotanS wavecomponentdetectable,thesearchisextendeduntilthe extremeontheRpeakisreached.
(f) DetectionofTandPwaves.Lietal.[44]reviewtheresultsof Thakoretal.[52]toidentifytheenergycontentofthePandT wavesinthefrequencyrangefrom2Hzto13Hz.Howeverin therangeof2–6Hzthebaselinedriftisconsiderableandthus selectthe24 scaleforPandTwaveidentification.Therefore,
J.A.Gutiérrez-Gnecchietal./BiomedicalSignalProcessingandControl32(2017)44–56 51
Table2
Parametersobtainedfromeachheartbeat.
Parameter Foreachbeat
NumberofPwaves 0,1,2,...
Pwavepolarity −1negative,1positive0morethan1Pwave
QRSduration Time(s)
PRinterval Time(s)
PositionofR Referencedtothebeginningofthesegment
RRinterval Time(s)
HR Beats/minute
Globalrhythm 0abnormal,1normal
thePandTwavesaresoughtinthefourthscaleintherange
betweentwoQRScomplexes.OncetheQRScomplexhasbeen
identified,inasimilarmannertothatpresentedin[31],the procedureusesasearchwindowdefinedbytheendofaQRS complexandthebeginningofthenextQRScomplex.
(g)Featureextraction.Onceindividualwaveshavebeenlocated,a setoffeaturesforeachheartbeatisobtained,andtheresultsfor thedatasegmentarestoredinanarray(Table2).The result-ing feature array feeds the Probabilistic Neuronal Network whichdeterminestheprobabilityofanarrhythmiadetected by the algorithm: N, AF, PAC, LBBB, RBBB, PVC, SHB and SVT.
2.4. ECGarrhythmiaclassifierbasedonProbabilisticNeural Network(PNN)
Amongsttheclassifiersreported,theuseofPNNclassifiershas receivedconsiderableattention.In[45]theauthorsreportuptoa 100%successdetectionrateforsinglearrhythmia(PVC)although theclassificationaccuracy diminishes(94%) when twoor more heartbeatconditionsarepresent.In[46]theauthorsobtaineda 92.9%classificationsuccessrateoffourtypesofheartbeat condi-tionsusingPNNandlinearpredictioncoefficients.Theauthorsin
[47]reporteda 99.65%successrateforsixheartbeatconditions. Heretheauthorstransfertheresultsobtainedfromthesingle-wave identificationproceduretoaPNNclassifier(Fig.6).
ThePNNarchitectureisbasicallyabackpropagationnetwork withanactivationfunctionderivedfromstatisticaldata.The pat-ternandclasseslayersrequiresupervisedknowledgetoconnect eachpatternlayernodetothecorrespondingclasslayernode.The aimistoclassifythenthdimensionfeaturevectorXii,according
Fig.6.Probabilisticneuralnetwork(PNN)classifier.
Table3
Assignmentofheartbeatclassificationidentifier.
Heartbeatcondition Class
Auricularfibrillation(AF) 1
Normalsinusrhythm(N) 2
Prematureatrialcontraction(PVC) 3
Leftbundlebranchblock(LBBB) 4
Rightbundlebranchblock(RBBB) 5
Prematureventricularcontraction(PVC) 6
Sinoauricularheartblock(SHB) 7
Supraventriculartachycardia(SVT) 8
tosomepredefinedclassCM.Acommonprocedurenormalizesthe
weights,WPNNkk,as(17): WPNNkk= xkk
xkk
k=1,2,...,N (17)
whereWPNNkkcorrespondstothePkkthnode,andXkk =/ Xiiisthe
trainingvector.ThePkkpatternlayeroutput,Okk,is(18): Okk=e
Zkk−12
(18) wherethewidthoftheGaussianfunction,,isselectedtocontrol theexponentialactivationfunctionscalefactor.Okkisthe
exponen-tialkernelresultoperatingoverthedotproductbetweenthekkth trainingvectorandtheXiivectortobeclassified,Zkk(19): Zkk=WkkT
Xii
Xii (19)
TheAMfunctionsaredefinedas(20): AMkk=
1 Wkk ∈CM 0 otherwise
(20) andtheSMarraycontainstheequivalentproportionalprobability
estimates(21): SM= N
kk=1 OkkAMkk (21)Classesareassignedpertypeofheartbeatcondition(Table3). 2.5. Trainingtheprobabilisticneuralnetwork
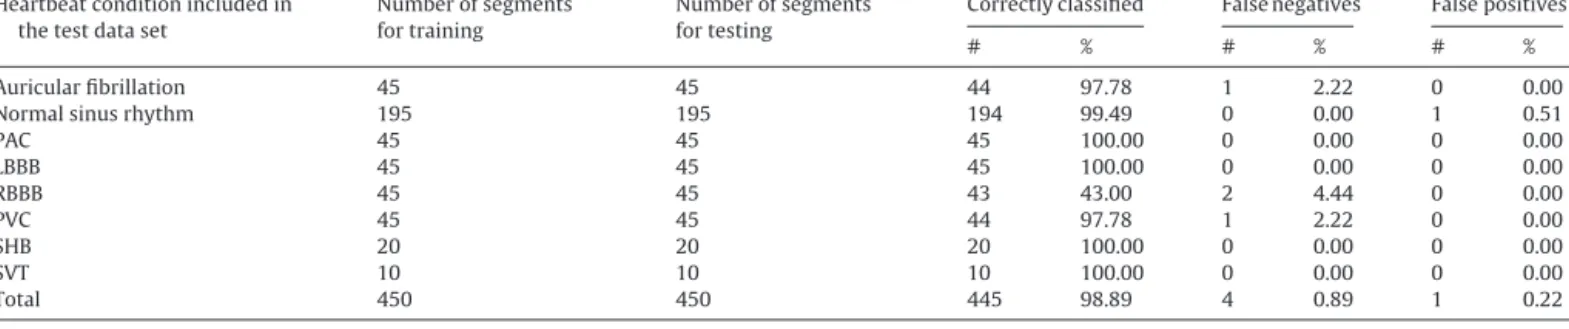
Thereareanumberoftechniquesthatmaybeusedfor train-ingtheNeuralNetwork.Whentheavailabledataincludeseven amounts of data sets withsimilar characteristics,it is possible toapplyclusteringtechniquestoavoidoverfitting.However,the amountof each type of heartbeatcondition ofinterest for this work,differinthechosenMIT/BIHdatabaserecords.Theoverall ratioofarrhythmicdatasegmentstonormalbeatdatasegments intherecordschosen,ismorethan30%whereatrialfibrillation ispredominant(∼14%)andotherheartbeatconditionsnot consid-eredforthisworkalsohavealargeratioincomparisonwith,for instance,SVT.Incidentally,thesmallestpercentagecorrespondsto SVT(<0.5%).Thusitisnotpossibletousecross-validationmethods effectivelysincethereisanunevennumberofheartbeatconditions. Aftertestingdifferentratiosoftraining and testingdatasets, theauthorsobtainedthebesttrainingperformanceby individu-allyselecting4506-ssegments,toensurethatthetrainingdata setincludesallthetargetheartbeatconditions.Testingfor sub-sampling validation wasconducted by selecting a different set of 450 6-s data segments, ensuring that all the target heart-beatconditions areincluded.The training datasetcorresponds toapproximately10%ofthetotalnumberofdatasetsanalyzed.
52 J.A.Gutiérrez-Gnecchietal./BiomedicalSignalProcessingandControl32(2017)44–56
Table4
SummaryofPNNtrainingtestresults.
Heartbeatconditionincludedin thetestdataset
Numberofsegments fortraining
Numberofsegments fortesting
Correctlyclassified Falsenegatives Falsepositives
# % # % # %
Auricularfibrillation 45 45 44 97.78 1 2.22 0 0.00
Normalsinusrhythm 195 195 194 99.49 0 0.00 1 0.51
PAC 45 45 45 100.00 0 0.00 0 0.00 LBBB 45 45 45 100.00 0 0.00 0 0.00 RBBB 45 45 43 43.00 2 4.44 0 0.00 PVC 45 45 44 97.78 1 2.22 0 0.00 SHB 20 20 20 100.00 0 0.00 0 0.00 SVT 10 10 10 100.00 0 0.00 0 0.00 Total 450 450 445 98.89 4 0.89 1 0.22
#:numberof6-sdatasegments.
%:percentagereferencedtothetotalnumberofsegmentsperheartbeatcondition. Falsenegatives:normalbeatdetectedwhenthereisanarrhythmiccondition. Falsepositives:abnormalbeatdetectedwhenthereisanormalsinusrhythm.
2.6. Confidencefactor(CF)
Theclassificationresultsareissuedaclassificationconfidence factor(CF)(22): CF=1−e
P1−P2 P2 (22) whereP1isthehighestprobabilityandP2issecondhighestprob-abilityobtainedfromthePNNprocess.
2.7. DigitalSignalProcessor-basedhardwareforECGarrhythmia classification
Thealgorithmdescribedin Sections2.2 and2.3wasinitially implementedinMATLAB(Mathworks)toallowrapidfunctional verification.Once theprocedureswere testedin thehost PC, a dedicatedhardwareplatformwasdevelopedtotesttheon-line per-formanceofthealgorithm.Fig.7showstheschematicdiagramof theDSP-basedhardwareimplementedforthisapplication.
Anarbitrarywaveformgenerator(AgilentTechnologies)isused togeneratethetestsignalderived fromthedigitizedPhysioNet
[48,49]records(Fig.7A).Theresultinganaloguesignal(Fig.7B)is fedtoamedicalanaloguefront-endintegratedcircuit(ADS1293) toacquireanddigitizethetestsignal(Fig.7C).Thedataacquisition processiscontrolledbymeansofaDSP(digitalsignalprocessor) integratedcircuit(TMS320C5535)(Fig.7E)throughanSPI inter-faceconnection(Fig.7D).TheprototypeincludesanLCDdisplay (Fig.7F)andpush-buttonkeyboard(Fig.7G)tooperatethedevice instand-aloneoperation.Theacquireddatacanbeeitherstored onmicro-SecureDigital(SD)memorycard(Fig.7H)and/or trans-ferredto thehost PCthrough anUSB connection. Data canbe on-lineanalyzedortransferredtothePCforfurtheranalysisand permanentstorage(Fig.7I).TheDSParrhythmiaclassification pro-cedurewasimplementedinC++programinglanguageusingthe CodeComposerStudioTMdevelopmentsuite(Texas
Intruments-SpectrumDigital).TheC++programmeincludesseveralfunctions toallowstand-aloneoperationanddatatransfertoahostPCfor furtheranalysis,performancecomparisonandpermanentstorage.
Fig.7. Schematicdiagramoftheexperimentalsetup.
Fig.8. Summaryofoperationsaccessiblethrougharotatingmenu.
TheuserinterfaceLCDscreendisplaysanavigationmenutoaccess theoperatingfunctions(Fig.8).
Incontinuousmonitoringmodethedataistransferreddirectly tothePC.AhostprogrammedevelopedinMATLAB,receives,plots andstoresthemeasureddatawhenthedeviceoperatesin con-tinuousmode.Thereasontoimplementthehostprogrammein MATLABistoease theprototypeperformancecomparison with thatoftheMATLABimplementation.InHolteroperation,thedevice samplesandstorestheincomingdataintheSDmemorycard.Every measurementisstoredas32-bitdata.Indatatransfermode,thelast Holteroperationdatastoredinnon-volatile(SD)memoryis trans-ferredtothePC.TheMATLABprogrammealsoreceivestheSDdata forpermanentstorageintoaspreadsheetfile.
Beforecontinuousoperationcanbegin,itisnecessaryto per-formtwooperations:calculationofthresholdcoefficientsbasedon areferenceECGsignalandtrainingtheneuralnetwork.Both pro-cessesareperformedoff-lineandtheresultsaretransferredtothe DSPmemory.Inon-lineoperatingmodedataissampledat500 samplespersecondtoacquirea6-sdataset.Oncetheentiresignal analysisfeatureextractionandclassificationproceduresare per-formed,theclassificationresultsareshownontheLCDscreenand theprocessisrepeatedforthenext6-sdatasetuntilstoppedby theuser.
3. Experimentalprocedure
TheavailabilityoftheMIT/BIHdatabasehasbeenaninvaluable toolfordevelopingECGsignalprocessingalgorithmsandpermits performancecomparison.Thealgorithmdevelopedforthis appli-cationwastestedusingseventeen30-minECGleadII(DII)data registersfromthePhysioNetrepository[48]:100,101,103,105, 106, 118, 119, 201,202, 203, 205, 207, 209, 210, 213, 215and 219.TheoriginalPhysioNetrecords,sampledat360Hz,are down-sampledat250Hz.Theresultingdataisscaledtoaccommodate
J.A.Gutiérrez-Gnecchietal./BiomedicalSignalProcessingandControl32(2017)44–56 53
Table5
Summaryofexampletestresults:record118,timeframe78–84s.
Evaluatedparameters Parametervaluesperheartbeatdetectedonsegment Vectorfeature
1st 2nd 3rd 4th 5th 6th A.NumberofPwaves 1 1 1 1 1 1 2 B.PolarityofP 1 1 1 1 1 1 5 C.QRSduration 0.144 0.136 0.144 0.144 0.14 0.144 2 D.PRinterval 0.2 0.196 0.216 0.196 0.204 0.216 2 E.RLocation 1.092 1.92 2.372 3.536 4.368 5.196 F.RRinterval 0.812 0.828 0.812 0.804 0.832 0.828 G.Heartbeatrate 70 2 H.Rhythm 1 1
Fig.9.TypicalMATLABresultsofthesinglewaveidentificationprocess:record118, dataframe:78–84s.
themaximuminputrangeoftheanaloguefront-endand
trans-ferredtothearbitrarywaveformgeneratorwhichinturngenerates
theanaloguesignalto beon-linesampledby theprototype.In
on-linedataanalysismode,thealgorithmisappliedcontinuously over6-seconddatasets;theanalysisprocessrequires,onaverage,
2.37E+06clockcyclesperdataset.Since theDSP operatesona
clockbaseof100MHz,thefullanalysisprocessofthe6-second
segmentisconductedinapproximately2.37s,whilethesampling
process continues, thus deliveringonline, real-time arrhythmia
detectionresults.TheLCDdisplayshowson-lineanalysisresults: theheartbeatconditiondetected,thedatasegmenttestedandthe classificationconfidencefactor.
4. Resultsanddiscussion
Singlewaveidentificationisbasedondetectionofmaximum
andminimumvaluesandzero-crossingdetectionwithrespectto
theisoelectricline.Fig.9showsanexampleofthegraphical sum-maryobtainedfromtheMATLABsinglewaveidentificationprocess.
Table5showsanumericalsummaryofthewaveidentification results,andtheresultingfeaturesneededtofeedthePNN.
Inturntheprobabilisticneuralnetworkdeliverstheprobability ofeacharrhythmiaconsidered(Table6);inthiscasethehighest probabilitycorrespondstoRBBB.
Table6
PNNclassificationresultsforrecord118,timeframe78–84s.
Assignednumber Typeofarrhytmia %Probability
1 Auricularfibrillation(AF) 5.0109×10⁻³²
2 Normalsinusrhythm(N) 5.9751×10−06
3 Prematureatrialcontraction(PVC) 2.0548×10⁻¹⁶
4 Leftbundlebranchblock(LBBB) 1.1939×10−04
5 Rightbundlebranchblock(RBBB) 99.9998
6 Prematureventricularcontraction(PVC) 4.0362×10−05
7 Sinoauricularheartblock(SHB) 2.8058×10⁻¹⁶
8 Supraventriculartachycardia(SVT) 1.0323×10−77
Fig.10.ResultsdisplayedonLCDinagreementwithMATLABresults.
Theconfidencefactorisissuedbasedonthetwohigher
proba-bilitiesobtained(23): CF=1−e−
99.9998−1.939E−04 1.939E−04 ≈1 (23) whichresultsina(rounded)100%confidencefactorforRBBB.The resultsdeliveredbytheprototypearein agreementwiththose obtainedwithMATLAB(Fig.10).A similar process was applied to 6-s segments of the 17 ECGrecordstodeterminetheclassificationaccuracy.Uponcloser inspection,thedataregistersinbothMATLABandtheprototype arealsoagreementinallcases,whichsuggestasimilaroperation performance(Fig.11),andthustheresultsreportedherearethose deliveredbytheprototype.
Asummaryoftheresultsafterprocessingallrecordsisshown inTable7.Incorrectclassificationhasbeenidentifiedas misclassi-fied,falsepositiveorfalsenegative.Falsepositivereferstothose datasetsthatwereidentifiedascontaininganarrhythmiceventbut correspondtoanormalbeat;falsenegativesarethosethatshould havebeenidentifiedasanarrhythmiceventbutwerecataloguedas normalbeat.Misclassifieddatasetsarethosewereanarrhythmic eventwasidentifiedbutcorrespondstothewrongtypeofheartbeat condition.
The accuracy of the QRS detection process has a profound impactontheoverallaccuracyoftheECGanalysissystem.TheQRS algorithmyieldedanoverall99.348%detectionsuccessrate.The detectionratedifferencewithrespecttootherreportedmethods (Table8)maybeduetothepreprocessingoperationsandthe man-nerinwhichtheprogrammecodeisimplemented.Inadditionhere theauthorsuseda6-seconddatasegmentthatmayomitasection oftheECGsignalessentialforQRScalculationandthusreducethe detectionaccuracy.
Overall,theclassificationalgorithmappearstoyielda consider-ablehighclassificationperformance(i.e.above97%forrecords101 and119),similartootherreportedworks.
Whenasinglearrhythmiaispresentinthetestsignal,the clas-sificationaccuracyishigh.However,whenthereismorethanone arrhythmiaconditionpresent,theclassificationaccuracydegrades. Inordertopresenttheclassificationresultsofsignalsthat con-tainoneormoreheartbeatconditions,aconfusionmatrixisused topresentcorrect(andincorrect)classificationofaparticularclass withrespecttotherestoftheclasses,whichwouldfurtherdescribe theclassificationperformance(Table9).
Thelowerscoreswereobtainedforprematureatrial contrac-tionandprematureventricularcontractionconditions(76.82%and 71.04% respectively). However,the algorithm yielded a 92.69%, 91.94%and95.45%classificationaccuracyforauricularfibrillation,
54 J.A.Gutiérrez-Gnecchietal./BiomedicalSignalProcessingandControl32(2017)44–56
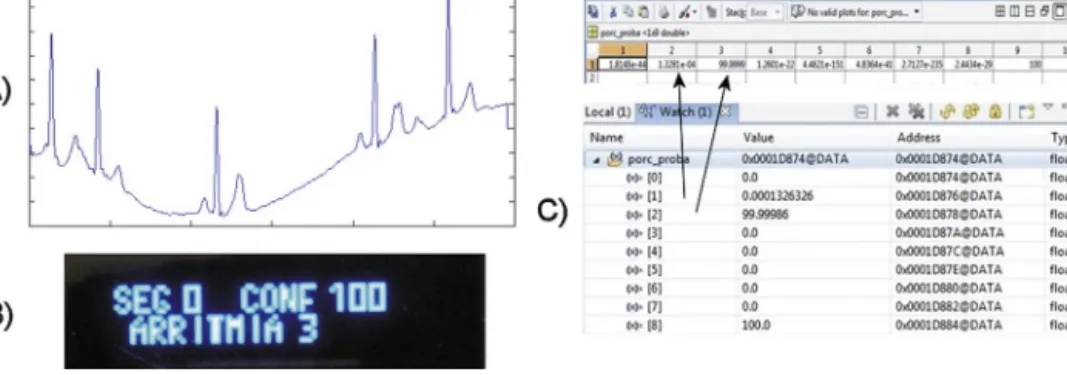
Fig.11. Numericalresultcomparisonfor(A)testsignalcorrespondingtoECGrecord201,timeframe18:48–18:54.(B)PrototyperesultsshownonLCDand(C)screencapture ofthedataregistersinMATLABandC5535-basedprototyperespectively.
Table7
Summaryoftestresults,2=0.01.
ECGrecord QRSdetection Classificationresults QRSdetection
accuracy
Testdataset Correctclassification Failedclassification Totalnumberof faileddetections
Misclassified Falsenegative Falsepositive
# # % # % # % # % # % 100 99.884 287 277 96.516 10 3.484 3 1.045 2 0.697 5 1.742 101 99.778 300 294 98.000 6 2.000 3 1.000 0 0.000 3 1.000 103 99.778 300 288 96.000 12 4.000 2 0.667 0 0.000 10 3.333 105 95.983 278 253 91.007 25 8.993 10 3.597 1 0.360 14 5.036 106 99.808 174 158 90.805 16 9.195 11 6.322 0 0.000 5 2.874 118 99.710 230 203 88.261 27 11.739 25 10.870 0 0.000 2 0.870 119 99.740 192 188 97.917 4 2.083 4 2.083 0 0.000 0 0.000 201 99.012 135 121 89.630 14 10.370 8 5.926 3 2.222 3 2.222 202 99.872 261 239 91.571 22 8.429 9 3.448 4 1.533 9 3.448 203 98.725 170 148 87.059 22 12.941 19 11.176 1 0.588 2 1.176 205 99.882 283 273 96.466 10 3.534 7 2.473 3 1.060 0 0.000 207 99.821 186 171 91.935 15 8.065 14 7.527 0 0.000 1 0.538 209 99.738 254 227 89.370 27 10.630 15 5.906 3 1.181 9 3.543 210 99.753 270 248 91.852 22 8.148 14 5.185 8 2.963 0 0.000 213 98.881 134 120 89.552 14 10.448 5 3.731 7 5.224 2 1.493 215 98.906 198 176 88.889 22 11.111 11 5.556 7 3.535 4 2.020 219 99.579 277 260 93.863 268 96.751 8 2.888 8 2.888 1 0.361 Total 99.344 3929 3644 92.746 285 7.254 168 4.276 47 1.196 70 1.782
#:numberof6-seconddatasegments.
%:percentagereferencedtothetotalnumberofsegmentsperdataset.
Misclassified:heartbeatconditiondifferentthannormalsinusrhythmdetectedbutclassifiedincorrectly.
Falsenegative:heartbeatconsiderednormalwhenitshouldhavebeenclassifiedasarrhythmicbeat.
Falsepositive:Normalsinusrhythmwronglyclassifiedasarrhythmicbeat.
Table8
ComparisonofQRSdetectionrateresultswithresultsfoundintheliterature.
Author Processingmethod Detectionrate
Alexakisetal.[38] Artificialneuralnetwork 87.50%
Alexakisetal.[38] Lineardiscriminantanalysis 89.96%
Jaswaletal.[27] Wavelettransform 95.74%
Zengetal.[24] Wavelettransform(Mexicanhat) 98.21%
Gutierrezetal.[17] Wavelettransform 98.81%
Ieongetal.[23] Wavelettransform 99.00%
Zengetal.[24] Wavelettransform(Morletwavelet) 99.20%
Dinhetal.[29] Wavelettransform 99.25%
Panetal.[39] Collectionofsignalprocessingtechniques 99.33%
Thiswork Wavelettransform 99.34%
HamiltonandTompkins[25] Collectionofsignalprocessingtechniques 99.46%
Chenetal.[15] Movingaverage 99.50%
Alvaradoetal.[30] Wavelettransform 99.53%
Martínezetal.[31] Wavelettransform 99.66%
J.A.Gutiérrez-Gnecchietal./BiomedicalSignalProcessingandControl32(2017)44–56 55
Table9
Classificationresults(confusionmatrix):percentage.
AF N PAC LBBB RBBB PVC SHB SVT AF 92.69% 1.53% 2.24% 1.18% 0.00% 1.42% 0.00% 0.94% N 0.64% 97.15% 1.33% 0.23% 0.05% 0.18% 0.37% 0.05% PAC 9.27% 4.64% 76.82% 0.00% 0.66% 3.97% 4.64% 0.00% LBBB 0.00% 0.00% 0.00% 91.06% 7.82% 0.56% 0.56% 0.00% RBBB 1.72% 0.00% 0.86% 6.47% 87.50% 3.45% 0.00% 0.00% PVC 3.86% 9.27% 12.74% 0.00% 1.16% 71.04% 1.93% 0.00% SHB 0.00% 8.06% 0.00% 0.00% 0.00% 0.00% 91.94% 0.00% SVT 0.00% 0.00% 4.55% 0.00% 0.00% 0.00% 0.00% 95.45% Table10
ECGarrhythmiaclassificationaccuracycomparison.
Author Processingmethod Featureclassification Classificationaccuracy
Thiswork WaveletTransformandProbabilisticNeural Network.
8heartbeatconditions 92.75% Ebrahimnezhadetal.[46] LinearpredictivecoefficientsandProbabilistic
NeuralNetwork.
4heartbeatconditions 92.90%
Tsipourasetal.[34] CollectionofDigitalSignalProcessingmethods. 4heartbeatconditions 94%(arrhythmicepisode)and98% (arrhythmicbeatclassification) Homaeinezhadetal.[37] WavelettransformandFuzzyinference
classification(FCMclustering).
QRSgeometricalcomplex 94.58%
deChazaletal.[35] CollectionofDigitalSignalProcessingmethods. 5heartbeatconditions Multiplereports,overall96.4% Linetal.[45] WaveletTransformandProbabilisticNeural
Network.
7heartbeatconditions 97%(High)classificationratefora singlearrhythmia,decreaseswhen signalscontainmultiple arrhythmias
Homaeinezhadetal.[37] WavelettransformandFuzzyinference classification(Subtractiveclustering).
QRSgeometricalcomplex 97.41%
Yuetal.[47] WaveletTransformandProbabilisticNeural Network.
6heartbeatconditions 99.65%
sinoauricularheartblockandatrialfibrillationconditions respec-tively,whenthereismorethanjustasingleheartconditionpresent. Theperformancecomparisonwithotherreportedworks(Table10) showsareducedclassificationaccuracy.
However,thedatausedfortestingtheECGclassification pro-grammeanddedicatedhardware,correspondedtoasetofanalogue signalsproceedingfromasignalgenerator,correspondingtothe referenceECGdatabase.Theclassificationaccuracyobtainedand thecompacthardwaresolutionusedfortheexperiments,suggest thatthemethodandapparatusdescribedinthisworkissuitablefor implementingon-linereal-timearrhythmiaclassificationin wear-ablesensingapplications.
5. Conclusions
Throughoutthisworkitwasshownthattheinherentnatureof theproposedDSPalgorithmforarrhythmiaclassificationbasedon acombinationofWaveletTransformandProbabilisticNeural Net-work,issuitableforreal-timeoperationonaDSPplatform,whichin turnissuitableforbeingimplementedonwearablesensing applica-tions.The6-sdatalengthwasselectedbearinginmindon-lineDSP implementationfordeliveringreal-timeinformation;acomplete classificationoperationisconducted,onaverage,inapproximately 2.4s,whiledataisacquiredcontinuously.Theclassification accu-racyof theproposedprocedurewasinitially codedin MATLAB, andtestedusingdataobtaineddirectlyfromtheMIT/BIHrecords; theclassificationresultswherecomparedtothoseobtainedusing the equivalent, digitized, data fed to the DSP-based ECG data acquisitionsystemthroughthearbitrarywaveformgenerator.The strategy wasimplementedin ordertoallowcomparison ofthe classificationaccuracy,segmentbysegment,onbothMATLABand DSP-basedplatforms.TheclassificationresultsbetweentheDSP prototypeandtheMATLAB-basedprogrammewere100%in agree-ment,whichcontributestovalidatetheDSPC++codingprocedure. Whenthereisasinglearrhythmiapresentonthetestsignal,the
overallclassificationaccuracyishighinagreementwithreported works.Howevertheresultsindicatethatthereisadecreased accu-racywhenthereismorethanonearrhythmiaconditionpresent;in comparisonwithpreviouslyreportedworks,theconfusionmatrix testsclassificationaccuracy,andsuggeststhedecreaseddetection rate,inparticularforPACandPVC.In contrast,theresultsmay alsoreflectamorerealisticclassificationperformancewhen com-paredtotherestoftheclassesselected.Amongstthefactorsthat mayhaveinfluenceddecreasedclassificationratesarethenumber ofdatasetsusedfortrainingandthepresenceofother arrhyth-miaconditionsnotconsideredforclassification.Anotherimportant factor istheaccuracyof theQRS algorithm;althoughthe over-allclassificationaccuracyisbetterthat92.74%,thereisroomfor improvementbyoptimizingtheQRSalgorithm.Ontheotherhand, the reduced number of electronic components and the overall detectionrateofoperatingontheequivalent,digitized,signals sug-gestthatthemethodandprototypepresentedmaybesuitablefor integrationintowearablesensingtechnology,inagreementwith currentambulatorysensingtrendsoftechnologicaldevelopment whichwouldcontributetoearlydiagnosis.
Acknowledgement
The authors acknowledge the support from Tecnológico Nacional de México under grant 5786.16-P to carry out this research.
References
[1]A.S.Adabag,G.Peterson,F.S.Apple,J.Titus,R.King,R.V.Luepker,Etiologyof suddendeathinthecommunity:resultsofanatomic,metabolic,andgenetic evaluation,Am.Heart.J.159(January(1))(2010)33–39.
[2]J.J.Goldberger,A.E.Buxton,M.Cain,O.Costantini,D.V.Exner,B.P.Knight,D. Lloyd-Jones,A.H.Kadish,B.Lee,A.Moss,R.Myerburg,J.Olgin,R.Passman,D. Rosenbaum,W.Stevenson,W.Zareba,D.P.Zipes,Riskstratificationfor arrhythmicsuddencardiacdeath:identifyingtheroadblocks,Circulation123 (2011)2423–2430.
56 J.A.Gutiérrez-Gnecchietal./BiomedicalSignalProcessingandControl32(2017)44–56
[3]E.Asensio,R.Narváez,J.Dorantes,J.Oseguera,T.A.Orea,R.P.Hernández,G.V. Rebollar,L.Mont,J.Brugada,Conceptosactualessobrelamuertesúbita,Gac. Med.Mex.141(March–April(2))(2005)89–98.
[4]M.Velic,I.Padavic,S.Car,ComputeraidedECGAnalysis–StateoftheArtand UpcomingChallenges,2013,arXiv:1306.5096v1[cs.CV]21June.
[5]M.E.Guevara-Valdivia,Monitoreoadistanciadelosdispositivosautomáticos implantablescardiovasculares(marcapasos,desfibriladoresautomáticos implantablesyresincronizadorescardiacos),Arch.Cardiol.Mex.79 (July–September(3))(2009)221–225.
[6]L.Gatzoulis,I.Iakovidis,WearableandPortableeHealthSystems:
TechnologicalIssuesandOpportunitiesforpersonalizedcare,IEEEEng.Med. Biol.Mag.26(September-October(5))(2007)51–56.
[7]M.Shapiro,J.Martínez-Sánchez,in:F.MéndezOteo(Ed.),ArritmiasCardiacas: Introducciónasudiagnósticoytratamiento,2aed,2002,MéxicoD.F. [8]A.Gacek,W.Pedrycz,ECGsignalanalysis,classification,andinterpretation:a
frameworkofcomputationalintelligence,in:A.Gacek,W.Pedrycz(Eds.),ECG SignalProcessing,ClassificationandInterpretation,Springer-Verlag,London, 2012,pp.47–77.
[9]A.BayesdeLuna,BasicElectrocardiography:NormalandAbnormalECG Patterns,JohnWiley&Sons,NewYork,2008.
[10]J.Slocum,A.Sahakian,S.S.Swiiryn,Diagnosisofatrialfibrillationfromsurface electrocardiogramsbasedoncomputer-detectedatrialactivity,J.
Electrocardiol.25(January(1))(1991)1–8,1992.
[11]F.Bogun,D.Anh,G.Kalahasty,E.Wissner,C.B.Serhal,R.Bazzi,D.Weaver,C. Schuger,Misdiagnosisofatrialfibrillationanditsclinicalconsequences,Am.J. Med.117(November(9))(2004)636–642.
[12]R.A.Colucci,M.J.Silver,J.Shubrook,Commontypesofsupraventricular tachycardia:diagnosisandmanagement,Am.Fam.Physician15(October(8)) (2010)942–952.
[13]S.Kadambe,R.Murray,G.F.Boudreaux-Bartels,Wavelettransform-basedQRS complexdetector,IEEETrans.Biomed.Eng.46(July(7))(1999)838–848. [14]D.I.Donoho,J.M.Johnstone,Idealspatialadaptationviawaveletshrinkage,
Biometrika(1994)425–455.
[15]S.W.Chen,H.C.Chen,H.L.Chan,Areal-timeQRSdetectionmethodbasedon moving-averagingincorporatingwithwaveletdenoising,Comput.Meth. Prog.Bio.82(2006)187–195.
[16]B.-U.Köhler,C.Hennig,R.Orglmeister,TheprinciplesofsoftwareQRS detection,IEEEEng.Med.Biol.Mag.21(January–February(1))(2002) 42–57.
[17]A.Gutiérrez,M.Lara,P.R.Hernandez,AQRSdetectorbasedonHaarwavelet, evaluationwithMIT-BIHarrhythmiaandEuropeanST-TDatabases,Comp. Syst.8(April–June(4))(2005)293–302.
[18]M.Kaneko,T.Gotho,F.Iseri,K.Takeshida,H.Ohki,N.Sueda,QRScomplex analysisusingwavelettransformandtwolayeredself-organizingmap, Comput.Cardiol.38(2011)813–816.
[19]P.S.Addison,WavelettransformsandtheECG:areview,Physiol.Meas.26 (2005)R155–R199.
[20]M.J.Burke,M.Nasor,Thetimerelationshipsoftheconstituentcomponentsof thehumanelectrocardiogram,J.Med.Eng.Technol.26(January–February(1)) (2002)1–6.
[21]A.Schuck,J.O.Wisbeck,QRSdetectorpre-processingusingthecomplex wavelettransform,in:Proceedingsofthe25thAnnualInternational ConferenceoftheIEEEEngineeringinMedicineandBiologySociety,17–21 September,(3),2003,pp.2590–2593.
[22]V.P.Vassilikos,L.Mantziari,G.Dakos,V.Kamperidis,I.Chouvarda,Y.S. Chatzizisis,P.Kalpidis,E.Theofilogiannakos,S.Paraskevaidis,H.Karvounis,S. Mochlas,N.Maglaveras,I.H.Styliadis,QRSanalysisusingwavelet
transformationforthepredictionofresponsetocardiacresynchronization therapy:aprospectivepilotstudy,J.Electrocardiol.47(January–February1) (2014)59–65.
[23]C.-I.Ieong,P.-I.Mak,C.-P.Lam,C.Dong,A0.83-WQRSdetectionprocessor usingquadraticsplinewavelettransformforwirelessECGAcquisitionin 0.35-mCMOS,IEEETrans.Biomed.CircuitsSyst.6(December6)(2012) 586–595.
[24]C.Zeng,H.Lin,Q.Jiang,M.Xu,QRScomplexdetectionusingcombinationof Mexican-hatwaveletandcomplexMorletwavelet,J.Comput.8(November 11)(2013)2951–2958.
[25]P.S.Hamilton,W.J.Tompkins,QuantitativeinvestigationofQRSdetection rulesusingtheMIT/BIHarrhythmiadatabase,IEEETrans.Bio-Med.Eng.BME 33(December(12))(1986)1157–1165.
[26]M.Okada,AdigitalfilterfortheQRScomplexdetection,IEEETrans.Bio-Med. Eng.BME26(December(12))(1979)700–703.
[27]G.Jaswal,R.Parmar,A.Kaul,QRSdetectionusingwavelettransform,Int.J. Eng.Adv.Tech.1(August6)(2012)1–5.
[28]H.H.So,K.L.Chan,DevelopmentofQRSdetectionmethodforreal-time ambulatorycardiacmonitor,in:Proceedingsofthe19thAnnualInternational
ConferenceoftheIEEEEngineeringinMedicineandBiologySociety,Oct.30 1997–Nov.21997,1,1997,pp.289–292.
[29]H.A.N.Dinh,D.K.Kumar,N.D.Pah,P.Burton,WaveletsforQRSdetection,in: Proceedingsofthe23rdIEEEAnnualInternationalConferenceoftheIEEE EngineeringinMedicineandBiologySociety,Oct.25–28,Istanbul,Turkey, Vol.2,2001,pp.1883–1887.
[30]C.Alvarado,J.Arregui,J.Ramos,R.Pallás-Areny,AutomaticdetectionofECG ventricularactivitywavesusingcontinuoussplinewavelettransform,in: Proceedingsofthe2ndInternationalConferenceonElectricalandElectronics Engineering(ICEEE)andXIConferenceonElectricalEngineering(CIE2005), MexicoCity,Mexico,September7–9,2005,pp.189–192.
[31]J.P.Martínez,R.Almeida,S.Olmos,A.P.Rocha,P.Laguna,Awavelet-based ECGdelineator:evaluationonstandarddatabases,IEEETrans.Bio-Med.Eng. 51(April(4))(2004)570–581.
[32]M.S.Manikandan,K.P.Soman,AnovelmethodfordetectingR-peaksin electrocardiogram(ECG)signal,Biomed.SignalProcess.7(March(2))(2012) 118–128.
[33]H.Atoui,J.Fayin,P.Rubel,Aneuralnetworkapproachforpatient-specific 12-leadECGsynthesisinpatientmonitoringenvironments,in:Proceedings IEEEComputersinCardiology,2004,pp.161–164.
[34]M.G.Tsipouras,D.I.Fotiadis,D.Sideris,Anarrhythmiaclassificationsystem basedontheRR-intervalsignal,Artif.Intell.Med.33(March(3))(2005) 237–250.
[35]P.deChazal,M.O’Dwyer,R.B.Reilly,Automaticclassificationofheartbeats usingECGmorphologyandheartbeatintervalfeatures,IEEETrans.Bio-Med. Eng.51(July(7))(2004)1196–1206.
[36]P.Laguna,R.Jané,P.Caminal,Automaticdetectionofwaveboundariesin multileadECGsignals:validationwiththeCSEdatabase,Comput.Biomed. Res.27(February(1))(1994)45–60.
[37]M.R.Homaeinezhad,E.Tavakkoli,A.Ghaffari,Discretewavelet-basedfuzzy networkarchitectureforECGrhythm-typerecognition:featureextraction andclustering-orientedtuningoffuzzyinferencesystem,Int.J.Signal Process.ImageProcess.PatternRecogn.4(September(3))(2011)107–129. [38]C.Alexakis,H.O.Nyongesa,R.Saatchi,N.D.Harris,C.Davies,C.Emery,R.H.
Ireland,S.R.Heller,Featureextractionandclassificationofelectrocardiogram (ECG)signalsrelatedtohypoglycaemia,Proc.Comput.Cardiol.30(2003) 537–540.
[39]J.J.Pan,W.J.Tompkins,Areal-timeQRSdetectionalgorithm,IEEETrans. Bio-Med.Eng.BME32(March(3))(1985)230–236.
[40]Y.Sun,S.Suppappola,T.A.Wrublewski,Microcontroller-basedreal-timeQRS detection,Biomed.Inst.Technol.26(December(6))(1992)477–484. [41]S.Karpagachelvi,M.Arthanari,M.Sivakumar,ECGfeatureextraction
techniques–asurveyapproach,Int.J.Comput.Sci.Inf.Security8(April1) (2010)76–80,aRxiv:1005.0957[cs.NE].
[42]J.A.Gutierrez-Gnecchi,R.Morfin-Maga ˜na,A.del,C.Tellez-Anguiano,D. Lorias-Espinoza,E.Reyes-Archundia,O.Hernandez-Diaz,Cardiacarrhythmia classificationusingacombinationofquadraticsplinewavelettransformand artificialneuralclassificationnetwork,in:Proceedingsofthe2nd
InternationalWork-ConferenceonBioinformaticsandBiomedical Engineering,Granada,Spain,April7th–9th,2014,pp.1743–1754. [43]S.Mallat,W.L.Hwang,Singularitydetectionandprocessingwithwavelets,
IEEETrans.Inform.Theory38(March(2))(1993)617–643.
[44]C.Li,C.Zheng,C.Tai,DetectionofECGcharacteristicpointsusingwavelet transforms,IEEETrans.Bio-Med.Eng.42(January(1))(1995)21–28. [45]C.H.Lin,Y.C.Du,T.Chen,Adaptivewaveletnetworkformultiplecardiac
arrhythmiasrecognition,ExpertSyst.Appl.34(May4)(2008)2601–2611. [46]H.Ebrahimnezhad,S.Khoshnoud,Classificationofarrhythmiasusinglinear
predictivecoefficientsandprobabilisticneuralnetwork,Appl.Med.Inf.33 (September(3))(2013)55–62.
[47]S.N.Yu,Y.H.Chen,Electrocardiogrambeatclassificationbasedonwavelet transformationandprobabilisticneuralnetwork,PatternRecogn.Lett.28 (2007)1142–1150.
[48]A.L.Goldberger,L.A.N.Amaral,L.Glass,J.M.Hausdorff,P.Ch.Ivanov,R.G.Mark, J.E.Mietus,G.B.Moody,C.K.Peng,H.E.Stanley,PhysioBank,PhysioToolkit,and PhysioNet:componentsofanewresearchresourceforcomplexphysiologic signals,Circulation101(June(23))(2000)e215–e220.
[49]G.B.Moody,R.G.Mark,TheimpactoftheMITBIHarrhythmiadatabase,IEEE Eng.Med.Biol20(May–June(3))(2001)45–50.
[50]S.G.Mallat,Atheoryformultiresolutionsignaldecomposition:thewavelet representation,IEEETrans.PatternAnal.11(July(7))(1989)674–693. [51]S.Mallat,Multifrequencychanneldecompositionsofimagesandwavelet
models,IEEETrans.Acoust.SignalProcess.37(December(12))(1989) 2091–2110.
[52]N.V.Thakor,J.G.Webster,W.J.Tompkins,EstimationofQRScomplexpower spectrafordesignofaQRSfilter,IEEETrans.Bio-Med.Eng.BME-31 (November(11))(1984)702–706.