POWER LOSSES IN HVDC CONVERTER STATIONS
Gbadega Peter Anuoluwapo
(Student Number: 217071302)
IN FULFILMENT OF MASTER OF SCIENCE DEGREE IN ENGINEERING
COLLEGE OF AGRICULTURE, ENGINEERING AND SCIENCE
UNIVERSITY OF KWAZULU-NATAL
November 2018
i
CERTIFICATION
As the candidate’s Supervisor, I agree to the submission of this dissertation.
Signed: Prof. A.K Saha. Date: 28thNovember 2018
ii
DECLARATION 1 - PLAGIARISM
I, Gbadega Peter Anuoluwapo, declare that:
1.
The research reported in this dissertation, except where otherwise indicated, is my original research.2.
This dissertation has not been submitted for any degree or examination at any other university.3.
This dissertation does not contain other persons’ data, pictures, graphs or other information, unless specifically acknowledged as being sourced from other persons.4.
This dissertation does not contain other persons' writing, unless specifically acknowledged as being sourced from other researchers. Where other written sources have been quoted, then:a.
Their words have been re-written but the general information attributed to them has been referencedb.
Where their exact words have been used, then their writing has been placed in italics and inside quotation marks, and referenced.5.
This dissertation does not contain texts, graphics or tables copied and pasted from the internet, unless specifically acknowledged, and the source being detailed in the thesis and in the Reference section.Signed: Gbadega Peter. A Date: 28th November 2018
iii
DECLARATION 2 - PUBLICATIONS
DETAILS OF CONTRIBUTION TOPUBLICATIONS AND CONFERENCE PRESENTATIONS that form part and/or include research presented in this thesis(include publications in preparation, submitted, in press and published and give details of the contributions of each author to the experimental work and writing of each publication)
Publication 1
Gbadega Peter. A, AK. Saha, “Power Losses Assessments of LCC-based HVDC Converter Stations Using Datasheet Parameters and IEC 61803 STD”, 2018 proceedings of the 26th Domestic Use of Energy international conference (DUE), 3-5 April 2018, Cape Peninsula University of Technology (CPUT), Cape Town Campus, Cape Town, South Africa, pp. 173-181; Electronic ISBN: 978-0-9946-7594-1, Print on Demand(PoD) ISBN:978-1-5386-6732-3, DOI: 10.23919/DUE.2018.8384394, Publisher:IEEE.
Publication 2
Gbadega Peter. A, AK. Saha, “Comparative study of Harmonics Reduction and Power Factor enhancement of six and 12-pulses HVDC system using passive and shunt APFs Harmonic Filters”, 2018 proceedings of the 26th Domestic Use of Energy international conference (DUE), 3-5 April 2018, Cape Peninsula University of Technology (CPUT), Cape Town Campus, Cape Town, South Africa. pp. 182-190; Electronic ISBN: 978-0-9946-7594-1, Print on Demand (PoD) ISBN:978-1-5386-6732-3, DOI: 10.23919/DUE.2018.8384395, Publisher:IEEE.
Publication 3
Gbadega Peter. A, AK. Saha, “Loss Study of LCC-based HVDC Thyristor Valves and Converter Transformers using IEC 61803 Std. and Component Datasheet Parameters”, 2018 proceedings of IEEE PES & IAS Power Africa international conference, 26-29 June 2018 Cape Town. Hosted by Tshwane University of Technology, Pretoria, South Africa, pp. 32-37; Electronic ISBN: 978-1-5386-4163-7, USB ISBN: 978-1-5386-4162-0, Print on Demand (PoD) ISBN: 978-1-5386-4164-4, DOI: 10.1109/PowerAfrica.2018.8521016, Publisher: IEEE
Publication 4
Gbadega Peter. A, AK. Saha, “Loss Assessment of MMC-based VSC-HVDC Converters using IEC 62751-1-2 Std. and Component Datasheet Parameters.” 2018 proceedings of IEEE PES & IAS Power Africa international conference, 26-29 June 2018 Cape Town. Hosted by Tshwane University of Technology, Pretoria, South Africa, pp. 38-43; Electronic ISBN: 4163-7, USB ISBN: 4162-0, Print on Demand (PoD) ISBN: 978-1-5386-4164-4, DOI: 10.1109/PowerAfrica.2018.8521180, Publisher: IEEE.
Publication 5
Gbadega Peter. A, AK. Saha, “Loss Assessment of Key Equipment on LCC-Based HVDC Converter Stations” 2018 proceedings of IEEE PES & IAS Power Africa international conference, 26-29 June 2018 Cape Town. Hosted by Tshwane University of Technology, Pretoria, South Africa, pp. 44-52; Electronic ISBN: 978-1-5386-4163-7, USB ISBN: 978-1-5386-4162-0, Print on Demand (PoD) ISBN: 978-1-5386-4164-4, DOI: 10.1109/PowerAfrica.2018.8521107, Publisher: IEEE.
iv
ACKNOWLEDGEMENTS
I want to give all the glory to God for the gift of life and the strength granted to me in the course of this research and for making it a possibility.
I would also like to appreciate my supervisor the person of Prof. A.K Saha, for all his contributions and supports. I cannot imagine the success of this program without him. His criticism and scrutiny have thus helped me a lot. You did turn a better person out of me through your generous support and guidance.
I would also like to express my beloved gratitude to my parents Mr. and Mrs. Gbadega for their advice and encouragement throughout my study period. My profound gratitude also goes to my siblings: Mr. Emmanuel, Mr. Samuel, Miss. Deborah, Miss Favour and little Mr. Jomiloju for their relentless support.
I would also appreciate the person of Engr. Awogbemi Omojola for his motivations, encouragement and support throughout my stay here in South Africa, may God raise help for you in all your endeavors.
I would also show my profound gratitude to the person of Engr. Babatunde Olubayo .M, who was encouraging and mentoring me on what is expected of me as a researcher, I really do appreciate his relentless efforts throughout the tenure of this research work.
Finally, I hereby appreciate my lovely friend Amu Mary, who has been there for me in terms of good advice that strengthen me to carry on with the research when I feel like been reluctant to proceed.
v
ABSTRACT
In transmission systems, particularly when the power is transported over a transmission line of distance 500 km and above, a considerable amount of power is lost during power system operations, which consist of all the components that are used in generation and transmission of power. Therefore, it is imperative to estimate the power losses due to some power equipment on the electrical network during transmission systems. More so, it is of importance to comprehend the pros and cons of both LCC-based and VSC-based transmission systems and subsequently carry out detailed research on power losses of both systems using the calculation methods listed in standards. It is the purpose of this research work to determine and calculate the overall losses of various equipment of high-voltage direct current (HVDC) converter stations under operating and standby modes using standards IEC 61803, IEEE 1158, IEC 62751-1-2 and the component datasheet parameters (Phase Control Thyristor Type DCR3030V42 and Dynex IGBT module DIM1200ASM45-TS000). The loss calculations in this research work are precisely applicable to all parts of the converter station and cover standby, partial-load, and full-load losses using the standardized calculation methods stipulated in the aforementioned standards. Furthermore, Switching losses, as well as conduction losses are included in the calculation using a simplified analytical model, based on the standards IEC 62751-1-2 and power semiconductor (Dynex) datasheet information. Therefore, an analytical method was adopted to estimate the power losses of VSC-based HVDC system of two-level, three-level and modular multilevel VSC configurations. Finally, the various HVDC technologies (circuit simulations) models were implemented in the Matlab-Simulink environment. The Matlab models were used to estimate the power losses of these technologies converter losses for various operating conditions. The simulation technique has been devised to provide an independent crosscheck on the results obtained using idealized mathematical representations (analytical technique). Subsequent to these circuit implementations, some results were obtained and consequently validated with other commercial power loss simulation tools or electronic software, such as Semisel and Melcosim. The use of different contrasting techniques to provide equivalent characteristics losses calculations provide a good method of validating the feasibility of the HVDC technology loss study, giving confidence in the results for the converter losses that have been obtained. This research work is based on an existing method of loss evaluation, but strictly followed the IEEE loss calculation methods stipulated in standards. The major contribution of this research work was the new approach adopted in the power loss evaluation of various HVDC technologies such as the LCC-based and VSC-based topologies of the converter stations using the idealized mathematical representations stipulated in standards IEC 61803, IEEE 1158, IEC 62751-1-2 and the component datasheet parameter, which signifies the novel output of this research work.
vi
TABLE OF CONTENTS
CERTIFICATION ...i
DECLARATION 1 - PLAGIARISM ... ii
DECLARATION 2 - PUBLICATIONS ... iii
ACKNOWLEDGEMENTS ...iv
ABSTRACT ... v
TABLE OF CONTENTS ...vi
LIST OF FIGURES ... xii
LIST OF TABLES... xv
LIST OF ACRONYMS ... xvii
LIST OF SYMBOLS ... xviii
CHAPTER 1 ... 1
INTRODUCTION ... 1
1.1 Background ... 1
1.1.1 LCC-based HVDC Converter Station Losses ... 2
1.1.1.2 Classification of Losses of an LCC-based Converter Valve ... 2
1.1.2 VSC-based Converter Valves Losses ... 2
1.1.2.1 Classification of Losses of a VSC-based Converter Valve ... 3
1.1.3 Loss Characteristics of HVDC Technologies ... 4
1.2 Research Motivation and Problem Statement ... 5
1.3 Research Questions ... 6
1.4 Research Aims and Objectives ... 6
1.5 Structure of the Dissertation ... 7
1.6 Summary ... 8
vii
LITERATURE REVIEW ... 9
2.1 Introduction to HVDC Technology ... 9
2.2 Loss Taxonomy of LCC-HVDC Technology ... 9
2.3 Loss of Main Equipment in LCC-based HVDC Converter Stations ... 10
2.3.1 Loss of Thyristor Valve ... 10
2.3.1.1 Sources of Thyristor Valve Losses ... 11
2.3.1.2 Loss Generation in Thyristor Valves ... 11
2.3.1.3 Loss Determination Procedures of Thyristor Valves ... 11
2.3.2 Converter Transformer Losses ... 12
2.3.2.1 Sources of Converter Transformer Losses ... 12
2.3.2.3 Method I ... 12
2.3.2.4 Method II ... 12
2.3.2.5 Method III ... 13
2.3.3 AC Filter Losses ... 14
2.3.3.1 Filter Resistor Loss ... 14
2.3.3.2 Filter Reactor Losses ... 15
2.3.3.3 Capacitor Bank Losses (Filter Capacitor Losses) ... 16
2.3.4 DC Smoothing Reactor Losses ... 16
2.3.4.1 Standby Losses ... 17
2.3.4.2 Load Losses ... 17
2.3.5 DC-Filter Capacitor Losses ... 18
2.4 Loss of Main Equipment of VSC-based HVDC Converter Stations ... 18
2.4.1 Loss Hierarchy of VSC-based HVDC System ... 19
2.4.2 Valve Losses ... 19
2.4.3.1 Estimating Power Losses of IGBTs ... 20
2.4.3.2 Conduction Losses of IGBT ... 20
2.4.3.3 Switching Losses of IGBT... 23
2.4.3.4 Estimating the Power Losses of Freewheeling Diode ... 24
2.4.3.5 Conduction Losses (Diode) ... 24
2.4.3.6 Reverse Recovery Time ... 25
2.5 Loss Evaluation Method of Modular Multilevel Converters ... 26
2.5.1 Topology of M2C HVDC Technology ... 27
2.6 Summary ... 30
viii
METHODOLOGY ... 32
3.1 Introduction ... 32
3.2 Research Approach and Methods ... 32
3.3 Research Procedure and Process ... 33
3.4 Research Instruments ... 34
3.5 Research Layout ... 35
3.5.1 Losses of HVDC System ... 35
3.5.1.1 Standby Losses ... 36
3.5.1.2 Total Operating Losses ... 36
3.5.2 Methods of Converter Loss Evaluation ... 36
3.5.2.1 Practical Measure or Direct Measurement Method ... 37
3.5.2.2 Test and Measure ... 37
3.5.2.3 Software Model Method ... 37
3.5.2.4 Analytical Method ... 37
3.5.3 Power Losses Evaluation of Two-Level and Three-Level Converter Topologies ... 38
3.5.3.1 Power Losses Calculations in Three-Level Converter ... 39
3.5.3.2 Conduction Losses ... 39
3.5.3.3 Switching Losses ... 40
3.5.3.4 Power Losses Estimation in the DC-Link Capacitor ... 40
3.5.4 Evaluation of the Average Junction Temperature ... 41
3.5.4.1 Calculation of Case Temperature ... 41
3.5.4.2 Calculation of IGBT Junction Temperature ... 41
3.5.4.3 Calculation of Diode Junction Temperature ... 41
3.5.4.4 Thermal Model ... 41
3.5.5 Semiconductor Power Loss Evaluation in M2C VSC-based HVDC Topology ... 43
3.5.5.1 Analytical Calculations of M2C Conduction Losses ... 43
3.5.5.2 Analytical Calculations of Switching Losses ... 44
3.6 Research Strategy and Limitations ... 44
3.7 Research Assumptions ... 45
3.8 Summary ... 45
CHAPTER FOUR ... 46
RESULTS AND ANALYSES OF POWER LOSS DETERMINATION OF LCC-BASED HVDC CONVERTER STATIONS ... 46
ix
4.1 Introduction ... 46
4.2 Results and Analyses ... 46
4.2.1 Thyristor Valve Loss Calculations ... 47
4.2.1.1 Thyristor Conduction Loss per Valve W1 Calcculations ... 47
4.2.1.2 Thyristor Spreading Loss per Valve W2 Calculations ... 48
4.2.1.3 Other Valve Conduction Losses per Valve W3 Results ... 49
4.2.1.4 DC Voltage-Dependent Loss per Valve (DC voltage-related loss) W4 Calculations ... 50
4.2.1.5 Turn- off Loss of Thyristor Valve W7 Results ... 51
4.2.1.6 Reactor Losses per Valve (Saturable Reactor Hysteresis Loss of Thyristor Valves) W8 ... 51
4.2.1.7 Damping Loss per Valve (Loss of Damping Resistor) W5 Results ... 52
4.2.1.8 Loss Due to Charging and Discharging of Capacitors W6 ... 52
4.2.1.9 Total Valve Losses WT Results ... 53
4.2.2 Losses of Converter Transformers ... 54
4.2.3 AC Filter Losses ... 56
4.2.3.1 Filter Resistor Loss Results ... 56
4.3.3.2 Filter Reactor Losses ... 57
4.3.3.3 Capacitor Bank Losses (Filter Capacitor Losses) ... 58
4.2.4 DC Smoothing Reactor Losses ... 59
4.2.5 DC-Filter Capacitor Losses ... 60
4.2.6 Percentage Loss Calculations of Each Converter Station Equipment ... 61
4.3 Summary ... 62
CHAPTER FIVE ... 63
RESULTS AND ANALYSES OF POWER LOSS CALCULATIONS OF VSC-BASED HVDC CONVERTER STATIONS ... 63
5.1 Introduction ... 63
5.2 Results and Analyses ... 63
5.2.1 Power Losses Calculations of Two-Level VSC-based HVDC Converter Stations ... 64
5.2.1.1 IGBT Conduction Losses Calculations ... 64
5.2.1.2 IGBT Switching Losses Calculations ... 65
5.2.1.3 Total IGBT Power Losses Calculations ... 65
5.2.1.4 Diode Conduction Losses Calculations ... 65
5.2.1.5 Diode Switching Losses Calculations ... 66
5.2.1.6 Total Diode Power Losses Calculations ... 66
x
5.2.1.8 Power Losses Estimation of the DC-Link Capacitor for Two-Level Configuration ... 68
5.2.1.9 Evaluation of the Average Junction Temperature... 69
5.2.2 Power Losses Calculations of Three-Level VSC-based HVDC Converter Stations ... 69
5.2.2.1 IGBT Conduction Losses Calculations ... 69
5.2.2.2 Total IGBT Conduction Power Losses Calculations ... 70
5.2.2.3 IGBT Switching Losses Calculations ... 70
5.2.2.4 Total IGBT Switching Power Losses Calculations ... 70
5.2.2.5 Total IGBT Power Losses Calculations ... 71
5.2.2.6 Diode Conduction Losses Calculations ... 71
5.2.2.7 Total Diode Conduction Power Losses Calculations ... 71
5.2.2.8 Diode Switching Losses Calculations ... 72
5.2.2.9 IGBT Module Conduction Losses Calculations ... 72
5.2.2.10 IGBT Module Switching Losses Calculations ... 73
5.2.2.11 Power Losses Estimations of DC-Link Capacitor for Three-Level Configuration ... 73
5.2.2.12 Total Power Losses for 100 Series Connected IGBT Modules in Three-Level Configuration ... 74
5.2.2.13 Power Losses Comparison Between the VSC-based HVDC Technologies ... 75
5.2.3 Loss of Converter Transformers ... 76
5.2.4 AC Filter Losses ... 77
5.2.4.1 Filter Resistor Loss ... 77
5.2.4.2 Filter Reactor Losses ... 78
5.2.4.3 Capacitor Bank Losses (Filter Capacitor Losses) ... 79
5.2.5 DC Smoothing Reactor Losses ... 81
5.2.6 DC-Filter Capacitor Losses ... 81
5.2.7 Percentage Loss Calculations of each Converter Station Equipment... 82
5.2.8 Power Losses Calculations of MMC-based HVDC Converter Stations ... 85
5.2.8.1 IGBT Submodule Conduction Losses Calculations for the Upper (positive) Arm ... 85
5.2.8.2 Diode Submodule Conduction Losses Calculations for the Upper (positive) Arm ... 86
5.2.8.3 Total submodule Conduction Losses at the Upper Arm ... 87
5.2.8.4 IGBT Submodule Conduction Losses Calculations for the Lower (Negative) Arm ... 87
5.2.8.5 Diode Submodule Conduction Losses Calculations for the Lower (Negative) Arm ... 88
5.2.8.6 Total Submodule Conduction Losses at the Lower Arm ... 88
5.2.8.7 Overall Conduction Power Loss ... 89
5.2.8.8 IGBT Submodule Switching Losses Calculations for the Upper (positive) Arm ... 89
5.2.8.9 Diode Submodule Switching Losses Calculations for the Upper (positive) Arm ... 90
5.2.8.10 Total Submodule Switching Losses at the Upper Arm ... 90
5.2.8.11 IGBT Submodule Switching Losses Calculations for the Lower (Negative) Arm ... 91
xi
5.2.8.13 Total Submodule Switching Losses at the Lower Arm ... 92
5.2.8.14 Overall Switching Power Loss ... 92
5.2.8.15 Overall Total Losses of MMC at each Converter Stations ... 92
5.3 Summary ... 93
CHAPTER 6 ... 94
POWER LOSSES CALCULATION OF HVDC TECHNOLOGIES MODEL SIMULATION AND RESULTS .... 94
6.1 Introduction ... 94
6.2 Circuit Simulations of Various HVDC Technologies ... 94
6.2.1 LCC-Based HVDC Technology ... 94
6.2.1.1 Power Losses Calculation of LCC-based HVDC System ... 97
6.2.1.2 Simulation Results using Various Simulation Schemes for Losses Estimation ... 98
6.2.2 VSC-based HVDC Technologies ... 101
6.2.2.1 Power Losses Calculation of VSC-based HVDC System ... 103
6.2.2.2 Simulation Results for VSC Technologies using Matlab-Simulink Algorithm ... 104
6.3 Conclusion... 111
CHAPTER 7 ... 112
CONCLUSIONS AND RECOMMENDATIONS ... 112
7.1 Conclusions ... 112
7.2 Recommendations for Future Research ... 113
REFERENCES ... 115
APPENDICES ... 122
Appendix A ... 122
Appendix B ... 127
xii
LIST OF FIGURES
Figure 1-1: Classification of losses in an LCC-based converter valve unit…… ... 2
Figure 1-2: Classification of losses in a VSC-based converter valve unit. ... 3
Figure 2-1: Loss taxonomy of an LCC-HVDC system [36]……….10
Figure 2-2: Filters used for harmonics reduction and reactive power compensation [39]. ... 14
Figure 2-3: Loss taxonomy of VSC-based HVDC system [16]. ... 19
Figure 2-4: A typical illustration of loss calculation model structure [75]. ... 28
Figure 2-5: Three phase circuit schematic of M2C topology [76]. ... 28
Figure 4-1: Thyristor conduction loss per valve………48
Figure 4-2: Thyristor spreading loss per valve ... 48
Figure 4-3: Other conduction loss per valve ... 49
Figure 4-4: DC voltage-dependent loss per valve ... 50
Figure 4-5: Turn-off loss per valve at the converter terminals. ... 51
Figure 4-6: Reactor loss per valve at station terminals. ... 51
Figure 4-7: Damping loss per valve (loss of damping resistor). ... 52
Figure 4-8: Loss due to charging and discharging of capacitor and total damping losses ... 52
Figure 4-9: Total valve loss per valve, standby loss and 6-valve loss at station terminals. ... 53
Figure 4-10: Converter transformer losses using method 1 ... 54
Figure 4-11: Converter transformer losses using per unit method. ... 54
Figure 4-12: Harmonic loss factor vs harmonic number (n) /harmonic current (I). ... 55
Figure 4-13: Filter resistor losses ... 56
Figure 4-14: Filter reactor losses. ... 57
Figure 4-15: Filter capacitor loss calculations at station terminals. ... 58
Figure 4-16: The total AC filter loss calculations at converter station terminals. ... 59
Figure 4-17: DC-Smoothing reactor losses ... 59
Figure 4-18: Simplified equivalent circuit of a typical HVDC system. ... 60
Figure 4-19: DC-filter capacitor loss calculations at converter station terminals. ... 61
Figure 4-20: The total loss calculations of all the equipment of the converter stations. ... 61
Figure 4-21: Percentage loss calculations of each converter station equipment. ... 62
Figure 5-1: Total power losses at the converter station terminals………67
Figure 5-2: The overall total power losses per device at each converter terminals. ... 68
Figure 5-3: The Conduction and switching power losses at the rectifier terminal. ... 74
xiii
Figure 5-5: Converter transformer losses at the station terminals. ... 76
Figure 5-6: Harmonic loss factor vs harmonic number (n) /harmonic current (I). ... 76
Figure 5-7: Filter resistor loss at station terminals. ... 77
Figure 5-8: Filter reactor loss calculation at station terminals. ... 79
Figure 5-9: Filter capacitor loss calculations at station terminals. ... 80
Figure 5-10: The total AC filter loss calculations at converter station terminals. ... 80
Figure 5-11: DC-Smoothing reactor loss calculations at converter station terminals. ... 81
Figure 5-12: DC-filter capacitor loss calculations at converter station terminals. ... 82
Figure 5-13: The total loss calculations of all the equipment of the converter stations. ... 83
Figure 5-14: Percentage loss calculations of each converter station equipment. ... 84
Figure 5-15: The IGBT power conduction Losses for the upper arm. ... 86
Figure 5-16: Analyses of the diode submodule conduction losses for the upper (positive) arm ... 86
Figure 6-1: Circuit simulation of 6-pulse LCC-Based HVDC technology………95
Figure 6-2: Subsystem components of Alpha Order ... 96
Figure 6-3: Subsystem components of Rectifier current control (Firing angle measurement) ... 96
Figure 6-4: Subsystem components of Inverter gamma control ... 96
Figure 6-5: Matlab-Simulink Losses Block Model (HVDC technologies) ... 97
Figure 6-6: LCC-based converter station losses using Matlab-Simulink algorithm ... 98
Figure 6-7: Source Voltage and current waveforms before applying harmonic filters ... 98
Figure 6-8: Source Voltage and Current waveforms after applying harmonic filters ... 99
Figure 6-9: Variation of converter station’s equipment losses with converter station operating parameters
(Rectifier terminal) ... 99
Figure 6-10: Variation of converter station equipment losses with converter station operating parameters
(Inverter terminal) ... 100
Figure 6-11: Thyristor valves losses on semisel simulator platform. ... 101
Figure 6-12: Block diagram of two-level VSC HVDC technology. ... 101
Figure 6-13: Block diagram of multi-level VSC HVDC technology... 102
Figure 6-14: Arrangement of IGBT modules, which form the subsystems of various VSC configurations
... 103
Figure 6-15: Matlab-Simulink: Conduction calculation block model ... 103
Figure 6-16: Matlab-Simulink: switching losses calculation block model ... 104
Figure 6-17: Two-level VSC technology power losses estimations using Matlab-Simulink algorithm ... 104
Figure 6-18: Three-level VSC technology power losses calculations using Matlab-Simulink algorithm 105
Figure 6-19: Multi-level VSC technology power losses calculations using Matlab-Simulink algorithm 105
xiv
Figure 6-20: The Inverter terminal’s Voltage and current waveforms during 2-Level VSC simulation. . 106
Figure 6-21: The Inverter terminal’s Voltage and current waveforms during 3-Level VSC simulation. . 106
Figure 6-22: The Inverter terminal’s Voltage and current waveforms during Multi-Level VSC simulation.
... 107
Figure 6-23: The 3-D map of IGBT's and FWD's Losses of MMC topology... 108
Figure 6-24: The variation of the switching, conduction and total losses of 6-valves IGBT Module for
2-Level VSC configuration with respect to the Load current ... 108
Figure 6-25: The variation of the switching, conduction and total losses of 6-valves IGBT Module for
3-Level VSC configuration with respect to the Load current ... 109
Figure 6-26: The variation of the switching, conduction and total losses for both upper and lower arm of
Multi-Level VSC configuration with respect to the Load current ... 109
Figure 6-27: Power losses calculations of two-level VSC-based configuration using other loss simulators
... 110
Figure 6-28: Power losses calculations of three-level VSC-based configuration using other loss simulators
... 110
Figure 6-29: Losses Comparisons of HVDC technologies using various Losses calculations simulation
platforms ... 111
xv
LIST OF TABLES
Table 2-1: Types of AC Filters, functions and their mathematical expressions ... 15
Table 3-1: Typical breakdown of HVDC converter station losses ………..38
Table 3-2: Standard values to determine the number of series IGBT's in a valve. ... 42
Table 4-1: Thyristor conduction loss per valve calculations……….47
Table 4-2: Thyristor spreading loss per valve calculations ... 48
Table 4-3: DC voltage-dependent Loss per valve calculations ... 50
Table 4-4: A breakdown of the converter transformer losses using per unit method. ... 55
Table 4-5: DC-filter capacitor loss parameters ... 60
Table 5-1: System parameters………..64
Table 5-2: Calculations of IGBT power conduction losses ... 64
Table 5-3: Calculations of IGBT power switching losses ... 65
Table 5-4: Total power loss in IGBT calculations ... 65
Table 5-5: Calculations of diode conduction losses ... 65
Table 5-6: Calculations of diode switching losses ... 66
Table 5-7: Total diode power losses calculations ... 66
Table 5-8: Calculations of total losses per IGBT module ... 67
Table 5-9: Charge and discharge currents, ESR, losses per unit and total loss. In the calculation of total loss,
the amount of capacitors used in two-level VSC HVDC is 6. ... 68
Table 5-10: Calculations of junction temperature of both IGBT and freewheeling diode... 69
Table 5-11: Calculations of the IGBT conduction power losses of the both terminals of the three-level
converter stations ... 69
Table 5-12: Calculations of total IGBT conduction losses ... 70
Table 5-13: Calculations of the switching power losses of both station terminals of the three-level converter
stations ... 70
Table 5-14: Calculations of total IGBT switching losses ... 70
Table 5-15: Total power loss in IGBT calculations ... 71
Table 5-16: Calculations of the diode conduction power losses of both terminals of the three-level converter
stations ... 71
Table 5-17: Calculations of total diode conduction losses ... 71
Table 5-18: Calculations of the diode switching power losses of both station terminals of the three-level
converter stations ... 72
xvi
Table 5-20: Calculations of total switching losses per IGBT module ... 73
Table 5-21: Charge and discharge currents, ESR, losses per unit and total loss. In the calculation of total
losses, the amount of capacitors used in three-level VSC HVDC is 4. ... 73
Table 5-22: Total power losses for 100 series connected IGBT modules in three-level configuration ... 74
Table 5-23: Total power losses for 100 series connected IGBT modules in three-level configuration. ... 75
Table 5-24: The total losses of all the equipment of the VSC-based converter stations ... 82
Table 5-25: Loss proportion of converter station equipment ... 83
Table 5-26: Comparison of different HVDC technologies based on their loss figures at the converter station
terminals ... 84
Table 5-27: Different HVDC technologies with their respective converter losses ratios ... 85
Table 5-28: Table showing the calculated values of the positive and the negative arms inserted and bypassed
cells and also arm currents of MMC-based HVDC link ... 85
Table 5-29: Table showing the total submodule conduction loss at the upper arm ... 87
Table 5-30: Calculations of IGBT power conduction losses for the lower arm ... 87
Table 5-31: Calculations of diode power conduction losses for the lower arm ... 88
Table 5-32: Table showing the total submodule conduction loss at the lower arm ... 88
Table 5-33: Table showing the overall conduction power loss of MMC-based converters ... 89
Table 5-34: Calculations of IGBT power Switching losses for the upper arm ... 89
Table 5-35: Calculations of diode power switching losses for the upper arm ... 90
Table 5-36: The total submodule switching loss at the upper arm ... 90
Table 5-37: Calculations of IGBT power switching losses for the lower arm ... 91
Table 5-38: Calculations of diode power switching losses for the lower arm ... 91
Table 5-39: Table showing the total submodule switching loss at the lower arm ... 92
Table 5-40: Table showing the overall switching power loss of MMC-based converters ... 92
Table 5-41: Table showing the overall switching power loss of MMC-based converters ... 92
Table 5-42: Comparison of different HVDC technologies based on their converter loss figures at the
converter station terminals ... 93
Table 6-1: Simulation parameters……….98
Table 6-2: Given simulation parameters ... 101
Table 6-3: Simulation parameters ... 104
xvii
LIST OF ACRONYMS
AC Alternating Current BJT Bipolar Junction Transistor CEA Constant Extinction Angle CIA Constant Ignition Angle CTL Cascaded Two-level Converter DC Direct Current
ESR Equivalent Series Resistance FWD Freewheeling Diode
HVAC High Voltage Direct Current HVDC High Voltage Alternating Current
IEC International Electro-technical Commission IEEE Institute of Electrical and Electronics Engineers IGBTs Insulated Gate Bipolar Transistors
LCC Line Commutated Converter MMC Modular Multilevel Converter
MOSFET Metal-oxide-semiconductor Field-effect Transistor PID Proportional Integral Derivative
PLL Phase Locked Loop p.u. Per unit
PWM Pulse Width Modulation RMS Root Mean Square
ROW Right of Way
SSOA Switching Safe Operating Area Std. Standards
VSC Voltage Source Converter
xviii
LIST OF SYMBOLS
Symbols Definitions Units
α converter firing angle (alpha) Degree (°)
β converter ignition angle (beta) Degree (°)
π pi (3.142857143) dimensionless
Ω Unit of resistance ohm
γ converter extinction angle Degree (°)
μ overlap angle Degree (°)
KW/MW Unit of power kilo watt (103)/ megawatt
(106)
kV Unit of voltage kilo-volt (103)
km Unit of distance kilometre
kA Unit of current Kilo-Ampere
𝑅𝑛 Effective resistance Ω
𝑛 Harmonic number dimensionless
𝐼𝑛 Harmonic current kA
𝑃𝑅 Reactor loss kW
𝑋𝐿𝑛 Reactor reactance Ω
𝑓 Frequency Hz
𝑄𝑛 Quality factor dimensionless
𝑃𝑚 Magnetization loss kW
𝑃𝑜 Direct current losses kW
𝑃ℎ Hysteresis loss component p.u
𝑃𝑒 Eddy-current loss component p.u
𝐼𝑜 dc current Ampere
𝐸𝑅 Capacitor bank rated voltage V
𝑅𝐶 Capacitor bank total resistance Ω
𝑃𝐶 Filter capacitor losses Watt (W)
𝑚 Modulation index dimensionless
𝐸𝑜𝑛 IGBT turn on switching energy Watt (W)
𝐸𝑜𝑓𝑓 IGBT turn off energy loss Watt (W)
𝑓𝑠𝑤 PWM switching frequency kHz
𝐷 PWM duty factor dimensionless
𝑉𝑐𝑒.𝑠𝑎𝑡 IGBT saturation voltage drop Volt (V)
∅ Phase angle between output voltage and
current
1
CHAPTER 1
INTRODUCTION
1.1 Background
In power transmission systems, the evaluation of transmission losses is very imperative and it is essential that a transmission system with minimal power losses be designed. The optimization of the overall system performance can be achieved through the power loss estimation in transmission system by evaluating the economic and technical benefits of the system and understanding which of the components on the high voltage direct current (HVDC) network that contribute to maximum power losses. The estimations of losses provide the breakdown and calculation of losses that exist in the operating system for designers and operators to help estimate the economic and technical benefit of the project. For devices that produce large amount of losses, the suppliers need to know how and where losses are generated in order to determine the ratings of component and equipment and further increase operational efficiency of the transmission system by optimization design. Sufficient accurate loss figure is required by the customer which allows effective comparison of cost in a procedure of bid [1, 2].
It is important to study and critically analyze the losses including HVDC system to actually improve the economics of HVDC system [3]. The losses in an HVDC converter station are composed of the losses of various pieces of equipment, each of which has its own loss versus load relationship. The essence of this research work is to determine and calculate the overall losses of various topologies of high-voltage direct current (HVDC) converter stations utilizing both analytical and simulation approaches in order to validate the feasibility of HVDC technology loss study, giving confidence in the results for the converter stations losses that have been obtained. The HVDC technologies considered in this research work are LCC-based and VSC-based (two-level, three-level and modular multilevel topologies), and these losses are calculated during various operating conditions using the idealized mathematical representations stipulated in IEC 61803, IEEE 1158, IEC 62571-1-2 and the component datasheet parameters. It is worthy of note that LCC-based HVDC system uses Thyristor-valve and VSC-based HVDC uses IGBT as their switching electronic component, respectively. As such, the method of estimating their loss profile differs, because they are different electronic component entirely and their mode of operation is different. More so, it is difficult to determine converter stations losses by the traditional method of direct measurement, since losses are usually less than 1% of the power transferred, and it leads to inaccuracy of this method. Therefore, in accordance to the standard IEC 61803 (LCC-based) and IEC 62751-1-2 (VSC-(LCC-based), loss calculation models for converter station equipment under different operational conditions are established [4], [6].
The loss calculation in this research work are precisely applicable to all parts of the converter stations and cover standby, partial-load, and full-load losses and methods of calculation and measurement [4, 5]. HVDC converter-stations consist of a number of various pieces of equipment, the loss calculation procedures vary among various pieces of equipment, and it is the agreement of the industry that the total losses cannot readily be obtained by either factory or field-testing alone [6].
2
1.1.1 LCC-based HVDC Converter Station LossesThe losses of HVDC system are mainly composed of converter station losses, HVDC transmission line and electrode line system. However, the line system losses are sometimes ignored because of its small quantity. The total losses of converter stations are the sum of all equipment losses [7]. The converter station equipment includes the valve, transformer, AC filters, shunt capacitor, DC reactor, DC filters and auxiliary equipment. The standards of IEC 61803 and IEEE 1158 ‘’Determination of power losses in high voltage direct current (HVDC) converter stations’’ list the calculation methods of each equipment in details. It is difficult to determine converter stations losses by the traditional method of direct measurement, since losses are usually less than 1% of the power transferred, and it leads to inaccuracy of this method [4, 6]. In accordance to the standard of IEC 61803, loss calculation models for converter station equipment under different operational conditions are established [8].
1.1.1.2 Classification of Losses of an LCC-based Converter Valve
The thyristor valve of LCC-based converter mainly consists of the following parts; they are thyristors, voltage-grading capacitor, damping capacitors, firing and detecting system of the thyristor and saturated reactors. Note that about 85%-95% of the thyristor valves losses occur at the damping resistors and the thyristors. The LCC-based thyristor valves have the following principal loss mechanisms, which are illustrated in figure 1-1 [3].
Figure 1-1: Classification of losses in an LCC-based converter valve unit [9]
Figure 1-1 shows the breakdown of the classification of the losses in an LCC-based converter valve unit. The summation of these losses results to the total loss contribution by the converter valves. The loss contribution of the converter valve is larger than any equipment on the converter station, so therefore, there is need to analyze these losses to know the actual losses generated by this equipment.
1.1.2 VSC-based Converter Valves Losses
Voltage source converter high voltage dc (VSC-based HVDC) transmission is popular and noticeable due to the recent innovation of controllable semiconductor devices and bulk power transmission for long distance of about 500 km and
LCC-based converter Losses classifications Reactor losses per valve Turn-off losses per valve Damping-capacitor energy term Damping-resistor dependen t term DC-Voltage losses per valve Other valves conduction per valve Thyristor spreading losses per valve Thyristor conduction losses per valve
3
above. VSC-HVDC is most superior to its counterpart, conventional HVDC (LCC) in applications, but the loss contributions of the system is relatively very high. Therefore, in respect of this, it would be an essential technique, practice and application value to determine and evaluate the losses of VSC-HVDC transmission [5, 10].Therefore, it is worth noting that the VSC-based HVDC system configuration is similar to its counterpart technology, LCC- based HVDC and it includes the converter valves, AC filters, DC-Smoothing reactor and transmission lines etc. The analysis and calculation techniques of the losses in VSC-based HVDC transmission is not absolutely the same as the conventional HVDC transmission [1, 6]. The total losses of VSC-based HVDC technology is obtained by summing the losses of individual converter station equipment together utilizing the standards IEC 62751-1-2, “The power losses in voltage sourced converter (VSC) valves for high-voltage direct current (HVDC) systems” [5, 11]. The VSC-based topologies considered in the research work are 2-level, 3-level and modular multilevel converters. The mathematical representations of both 2-level and 3-level VSC-based converter topologies are well explained in these refs. [12, 13].
More so, an example of a unique voltage source converter (VSC) topology with immense potential for applications of high voltage direct current (HVDC) transmission is the modular multilevel converter (M2C). The M2C-based configuration has core features of low switching frequency and flexibly controlled so that its loss figures are smaller than that of the three-level and two-level VSC-based configuration [14]. Moreover, the detailed techniques adopted for estimating the power losses in the valves for a modular multilevel converter HVDC system are done in accordance with standards IEC 62751-1-2, “Power Losses in Voltage Source Converter (VSC) Valves for High-Voltage Direct Current (HVDC) Systems” [5, 15].
1.1.2.1 Classification of Losses of a VSC-based Converter Valve
Figure 1-2: Classification of losses in a VSC-based converter valve unit [16] Total losses of converter valve unit Total losses of IGBT module IGBT Switching losses Turn-on losses Turn-off losses Conduction losses Freewheeling Diode Reverse recovery losses Conduction losses Total losses of accessories Voltage
divider Heat sink
Driver unit
Other facilities
4
Figure 1-2 shows the breakdown of the classification of the losses in VSC-based converter valve unit. The summation of these losses results to the total loss contribution by the converter valves. The loss contribution of the converter valve is larger than any equipment on the converter station due to his high switching frequency, so therefore there is need to analyze these losses to know the actual losses generated by this equipment.In order to implement loss evaluation, the losses of converter valve would be segmented into various parts, as depicted in figure 1-2. The output characteristics curves are mostly used to calculate the IGBT and FWD steady state losses and are calculated based on the collector voltage-current characteristics in the transient state. More so, the conduction and switching losses of an IGBT device generate about half of the converter valve and the switching losses of the freewheeling diode (FWD) generates about one-third of the entire energy dissipation. An infinite proportion of losses results from the other parts of the module [17]. The proportion of the IGBT device and converter losses would reduce as the converter operates in the rectifier state, the reason being that the current flows through the freewheeling diode (FWD) most of the time, therefore, its losses are usually less than that of the IGBTs. Furthermore, changing the operating states and structure of the valves most of the time have an effect on the converter valve losses. The essential aspects to consider are the topology of the converter, types of the converter valve, scheme of valve driver, accessories of valve unit and temperature of the device, which are well explained in these references [18, 19].
The evaluation of power losses basically, provides the analysis and computation of losses that occur during the operating system in order for the designers and operators to assist in evaluating the technical and economic advantages of the project. Therefore, there is a dire need for the supplier to come to the knowledge of how and where the losses are generated in order to determine the equipment ratings and subsequently increase the operation efficiency of transmission system adopting the use of optimization design for the equipment that generates large losses [10, 20]. Power loss evaluation during the design stage of the VSC-based HVDC technology is very imperative, reason being that, it permits the designers to enhance the performance of the overall system through a compromise of various design indices [21].
1.1.3 Loss Characteristics of HVDC Technologies
In HVDC technologies, the main converter station equipment include converter transformer, converter valves, active power compensation equipment, smoothing reactor, DC capacitor filters etc. Firstly, the losses in a practical HVDC converter station are composed of equipment, each of which has its own loss versus load relationship. The valve losses are not proportional to the load current squared. More so, when the converter stations are energized, but in the standby state, the thyristor valves appear blocked, and for this reason, different loss mechanisms then apply from those that are found in normal operation. Secondly, during HVDC operation, a number of harmonics are generated both at the AC side as well as at the DC side of the converter station. Due to the flow of the harmonic current through the smoothing reactor, converter transformer, AC and DC filters, additional losses will be produced in the station. Lastly, note that, the loss varies because at different load levels, the equipment put into operation at converter stations is not exactly the same [6, 10]. As a result, the power loss calculations of the converter station are quite complex. Generally, the converter station losses are evaluated by means of randomly selecting various load points between no-load and
5
full-load conditions. Therefore, the converter station losses are most of the time analyzed or evaluated using two recommended losses, which are standby and total operating losses. [22, 23].1.2 Research Motivation and Problem Statement
Recently, in transmission networks, when bulk of power is to be transmitted over a long distance, high voltage direct current (HVDC) systems have more advantages over high voltage alternating current (HVAC) systems. More so, the advancements in power electronics and reduction in costs serves as the major driving factors, subsequently, making high voltage direct current more reliable and attractive. The prospects of high voltage direct current (HVDC) transmission systems are even greater as the need for cross-country power lines and inter-country intensifies, although this already in existence in the Southern African region.
Globally, there is a constant search for various methods to reduce cost, improve reliability, minimizing the environmental impact of a power line and finally, minimum power loss during transmission. These have over the years increased challenges in the evolution of the design techniques to ensure to meet the problems the power industry faces today. The above problems could be addressed and solved if the transmitted power from the sending end could be monitored to prevent a large amount of power consumed by some of the equipment on the electrical networks.
It is most technically and economically expedient in many circumstances to introduce high voltage direct current (HVDC) links into electrical network during transmission of electrical power, which may be the only feasible technique of power transmission most especially when the distance between the station and load Centre is very far apart that is, a distance of 500 km and above. In application, DC transmission is given priority when the distance by cable or land is too long for economic and stable AC transmission, which results to the introduction of converter stations at both ends of the electrical supply systems. The inclusion of these converters produce a large amount of power losses, that is, they reduce the power transmitted from the rectifier converter to the inverter converter. More so, longer transmission distances lead to higher energy losses as well as higher investment costs [24-26].
However, the HVDC converter station losses are not only produced by the converters alone, some other equipment on the converter stations also produce power losses, some of the equipment are the converter transformer, the AC harmonic filters, the DC-smoothing reactor and the auxiliary equipment like cooling tank. However, the losses of the auxiliary equipment are infinitesimal compared to the losses generated by other station equipment [27].
Voltage source converter based on the HVDC system (VSC-based HVDC) are often used in transmission region and accomplished good operating results. On the other hand, the losses of VSC-based HVDC system are larger than the conventional HVDC, which tends to be the main hurdle to apply VSC-HVDC to high power transmission, in respect of this fact, the loss characteristics of VSC has become an important issue to investigate. The VSC-based HVDC losses have a large converter station loss proportion due to the low voltage level and most especially the high switching frequency characteristics of VSC.
6
Different methods are well known majorly for the prediction of losses in power semi-conduction circuit. One of the methods adopted by researchers is the complete numerical simulation of the circuit by special simulation programs with integrated or parallel running loss calculation. Another method that could be adopted is to estimate the electrical behavior of a typical circuit model analytically using the semiconductor device datasheet parameters given by the manufacturer (i.e. the voltage and current of the power semiconductors) and available standards to determine the loss contribution by the semiconductor device and the other station equipment losses at large. Moreover, extensive and complex mathematical analyzes are required for the computation of the station losses, for quick results and minimized calculation effort, some of these equations are further simplified for easy analysis. For this reason, it is of interest to analytically evaluate the power losses that occur in both VSC-based HVDC technology and the LCC-based HVDC technology and subsequently compare the results obtained with the results obtained using other loss simulation environment in order to draw conclusions based on their loss proportion [11, 28, 29].1.3 Research Questions
Losses on the electrical network are detrimental to the perfect operation of the converter stations and other equipment on the electrical grid. Therefore, it is most pertinent to investigate the sources of these losses on the electrical power system and subsequently adopt critically analyses on the loss proportion of each of the sources of these losses. In respect of the above suggestion, these result to the following research questions.
What are the necessary procedures to determine power losses in both LCC-based HVDC technology and VSC-based HVDC technology?
What are the reasons why the losses of HVDC converter stations need to be accurately measured and evaluated?
What are the loss contributions of each equipment of the LCC-based HVDC converter stations analytically?
What are the loss contributions of each equipment of the VSC-based HVDC converter stations analytically?
What are the other ways the results obtained analytically could be compared in order to validate the genuineness of the results obtained to justify the viability of the HVDC loss study?
Based on the results obtained using other platforms, what are the percentage differences between the analytical approach and the software (simulation) approach?
What are the conclusions drawn on the comparison of the technologies based on their loss measures?
1.4 Research Aims and Objectives
The overall aim of this study is to be able to predict the loss figure or profile of HVDC technologies most exactly, likewise to clearly show the loss dependency on some of the circuit parameters and operating point and besides to have a good basis for the comparison of both converter systems. Furthermore, the objective of this research work is to provide an analytical overview of power losses determination of HVDC converter stations using the following transmission technologies, voltage source HVDC converter and Line-commutated HVDC converter technologies. Furthermore, the feasibility of the loss study of HVDC technologies using standardized calculation method (analytical)
7
is therefore validated using other loss simulator environments such as Matlab-Simulink, Semisel and Melcosim. It is confirmed and accepted that the continuous development of power electronics present cost-effective opportunities for the utilities to exploit. So therefore, HVDC transmission system remains a key technology as far as bulk-power distant transmission is concerned.In order to achieve these aims, the following objectives shall be accomplished, namely:
Investigation and identification of the sources of power losses on HVDC electrical network.
Evaluation of the loss contributions of each of the sources of LCC-based HVDC converter stations losses using datasheet parameters and the available standards.
Estimation of the loss proportions of the individual components of VSC-based HVDC converter stations using datasheet parameters and available standards.
Critical analytical assessments of the percentage losses of key equipment on the converter stations and subsequently comparing the results obtained with the results obtained from simulation environment.
Evaluation of the losses of various HVDC technologies using other loss simulation platforms such as Matlab-Simulink, Melcosim and Semisel to validate the viability of the results obtained using standardized calculation methods (analytical). The feasibility of the loss study of various HVDC technologies was also investigated based on the results of these various loss calculation methods.
Comparison of the various HVDC technologies using the loss mechanism of each technology to measure stability, reliability and efficiency of the power transmitted.
1.5 Structure of the Dissertation
This thesis presents an overview and progressive arrangement of chapters. Four Publications (P4) also support this thesis. The scientific contribution of the thesis is organized as follows:
Chapter 1 introduces the subject matter, and then gives an overview and background of the aim and objectives of the study. The LCC-based and VSC-based converter valves with respect to their various losses classifications were expressly discussed. Chapter 2 presents the literature review on loss taxonomy and losses of main equipment of both LCC-based and VSC-based HVDC technologies, the various methods of determination of power losses in converter stations with reference to standards IEC 61803, IEEE 1158, IEC 62571-1-2 and datasheet parameters and finally, a synopsis of the previous work done on similar studies. Chapter 3 presents the materials and the research methodology followed in the course of the study. Chapter 4 presents the results and analyses of power losses determination of LCC-based HVDC converter stations. Chapter 5 presents the results and analyses of power losses calculations of VSC-based HVDC converter stations. Chapter 6 presents the Model Simulation and results of power losses calculations of HVDC technologies. Chapter 7 concludes the dissertation and provides recommendations for further work applicable in the research field.
8
1.6 SummaryThis section introduces the subject matters of the research work, and further discusses on the essence of the study, why it is very important to investigate and evaluate the transmission losses. More so, all the methods and the instruments utilized during the course of this research were discussed. Furthermore, it was stated that, in HVDC converter station, there is no single piece of equipment that produces dominating losses, unlike in AC substation where the transformer losses are the dominating factor. Thus, in respect of this, the losses in an HVDC converter station are composed of the losses of various pieces of equipment, each of which has its own loss calculation methods. Notwithstanding, there are some equipment that contribute large amount of losses such as converter transformer and the converter valves, but note that, the converter stations total losses is the sum of all the equipment losses of the converter station. Finally, the various types of HVDC converter stations and their classifications were fully explained. More so, the research motivation, problem statement, questions, aim and objectives were stated.
9
CHAPTER 2
LITERATURE REVIEW
2.1 Introduction to HVDC Technology
The advancement of HVDC technology is aided by the recent rapid development of power electronic components such as a thyristor, IGBT etc. in the power electronics field [30]. More so, it is of importance that the converters used during transmission process should be well configured. The reason why the converters are well configured is to increase power transfer capabilities, reduces harmonic, reduce transmission losses and increases reliability, in that, it offers high tolerance to fault along the line. Due to some of the essential benefits of long-distance transmission application, the high voltage direct current has a lot of attention over the past few years, as a result of its inherent benefits. It is widely used for bulk delivery of power over long distances, also for the stability of AC lines, renewable energy integration, power control, long submarine transmission and asynchronous systems interconnections. Furthermore, reduction in the right of way (ROW) is another merit over AC system. [31, 32].
South Africa currently has a single High Voltage Direct current (HVDC) system, which is the Cahora Bassa HVDC link that connects the hydroelectric scheme at the Cahora Bassa dam in Mozambique to the Apollo Station in South Africa. The scheme is rated to transmit 1920 MW at ±533 kV over a distance of 1420km and is predominantly used as a bulk power transmission tool into the South African grid [33]. Due to the following merits obtained from LCC-based HVDC, which are efficient and cost-effective power transmission for many applications and reliability provided from this advanced technology, the LCC-based HVDC will persist to be used for bulk power HVDC transmission over several hundred MW. [33, 34].
2.2 Loss Taxonomy of LCC-HVDC Technology
The losses of HVDC technology are mainly composed of the losses of converter stations, HVDC transmission line and electrode line system as shown in fig 2-1. Sometimes the line system losses are ignored because of its small quantity. The cross-section of the conductor and the length of the transmission line determine the loss of DC transmission lines. Therefore, for long distance transmission, the dc line loss is generally about 5%-7% of the rated transmission capacity, which accounts for the most part of the DC transmission system [35].
10
Figure 2-1: Loss taxonomy of an LCC-HVDC system [36]Fig 2-1 shows the pictorial classification of losses of LCC-HVDC system. The converter stations equipment at both terminal points have several loss mechanisms and types. Therefore, to accurately determine the converter stations losses is quite difficult and complex analytically during the process of evaluating the loss of DC transmission systems. Note that, to determine the converter stations total losses, the converter station main equipment losses are measured and calculated respectively, the individual results of the losses are further added together to obtain the total losses. Generally, converter station loss is nearly 0.5%-1% of the rated transmission capacity of the converter stations [36, 37].
2.3 Loss of Main Equipment in LCC-based HVDC Converter Stations
The LCC-based HVDC converter stations are made up of some equipment such as AC filters, thyristor valves, smoothing reactors, converter transformers etc. Note that, to calculate the converter stations losses, the loss contributions of each equipment must be considered. Therefore, the loss compositions of each equipment are discussed below [6, 37].
2.3.1 Loss of Thyristor Valve
The thyristor valve is composed of saturated reactors, thyristor, damping capacitor, and resistor, DC voltage grading resistors, voltage-grading capacitors and the firing and detection system of the thyristor. The thyristors and damping resistors produce about 85%-95% of the thyristor valves losses. Currently, there is no suitable method available for direct thyristor valve measurement, since the waveform of thyristor valves in operation is quite complicated. As such, it is of common practice to compute the different loss components of the thyristor valves individually, then subsequently sum together the individual component losses to obtain the total thyristor valve losses [8, 38].
Losses of HVDC system Transmission line losses Earth electrode line system Converter station losses
Filter losses Transformer losses Converter losses Thyristor conductio n loss per valve Thyristor spreading loss per valve Other valve conduction per valve DC-Voltage dependent loss per valve Damping resistor dependen t term Damping capacitor energy term Turn-off losses per valve Reactor losses per valve Other losses
11
2.3.1.1 Sources of Thyristor Valve LossesA valve consists of various components, meanwhile, most full-load losses (typically 85%-95%) are produced in just two components, which are the damping resistor and the thyristor. Firstly, the five principal loss mechanisms present in thyristor valves are, thyristor turn-on switching loss, spreading loss, on-state loss, turn-off switching loss, off-state and reverse leakage loss [9]. Secondly, the four principal loss components present in damping resistor are damping-resistor-dependent term, change of capacitor energy term, circuit inductance stored energy term, and damping resistor loss (dispersion effect). Furthermore, there are still other related losses, like current related losses (i.e. conductor losses, reactor core losses) and voltage related losses (i.e. dc grading circuit losses, water circuit losses and electronic losses) [9, 39, 40].
2.3.1.2 Loss Generation in Thyristor Valves
It is worthy of note that, whenever the integral of 𝑉 × 𝐼 product is taken over a full cycle, measured at the valve terminals, is not equal to zero, valve losses are generated. In application, practical valves losses are produced in each power frequency cycle during four distinct periods, at turn-on, during load current conduction, at turn-off, and during the blocking interval between conduction periods [16, 41]. Firstly, the valve is characteristically of a low (but not zero) impedance during the conduction periods and it is often times during these periods that load current flows, as a result of these load currents drift, subsequently leads to conduction losses in the valve. Secondly, the thyristors are fired into conduction most times by the application of a gate pulse at turn-on. Since thyristor valve exhibits very high impedance nature before conduction, at conduction, each thyristor switches to a low but finite impedance state in a time-scale feature of the thyristor adopted [42, 43].
2.3.1.3 Loss Determination Procedures of Thyristor Valves
The recommended procedures stated in IEC standard 61803, “Determination of Power Losses in High-voltage direct current (HVDC) Converter Stations” provide a total loss figure for valves based on the summation of each loss components. Therefore, the individual loss components are determined by applying standardized computation methods using the obtained data from confirmable sources [43]. Due to the fact that, the computations are done on key components of the thyristor valve, which contribute more losses during operating and standby modes, the answers obtained might not be precise. It is certain that all major loss mechanisms are determined and that in terms of accuracy, the results are more accurate than the alternative method of direct measurement at the site. More so, different loss components will assume difference significances [9, 44]. Note that, all losses are evaluated on a per-valve basis, in which a valve is taken to be one arm of a three-phase line commutated Converter Bridge. The equations used in this research work to calculate the eight principal thyristor power losses are elaborately stipulated in reference [9], the IEC standard 61803, “Determination of Power Losses in High-voltage Direct-Current (HVDC) Converter Stations”. The eight principal thyristor loss mechanisms include thyristor conduction loss per valve, thyristor spreading loss per valve, other valve conduction losses per valve, DC voltage-Dependent loss per valve, damping resistor loss per valve, damping-capacitor loss per valve, turnoff losses per valve and reactor losses per valve[16, 45].
12
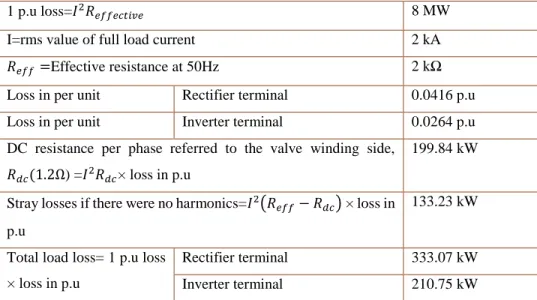
2.3.2 Converter Transformer LossesThe converter transformer losses are of two kinds, which are load loss and no-load loss. The currents that flow through the converter transformers’ windings contain harmonics whose magnitudes depend on the converter station operating parameters. The current-dependent load losses in the transformer due to the non-sinusoidal current wave shapes are greater than those that would occur with a sinusoidal current of the same RMS value at fundamental frequency [9]. No consensus has yet been reached recently, in the industry on how load losses in HVDC converter transformers should be estimated or measured. The major issue is how to account for the load losses caused by the harmonic currents, which vary with load, transformer leakage reactance, and converter fire angle [16, 43].
2.3.2.1 Sources of Converter Transformer Losses
When evaluating the losses of HVDC converter transformer, it is recommended that two types of losses be distinguished: standby losses and operating losses. During standby operation i.e. the transformers energized with the valve blocked, the applied voltage is the normal ac system voltage, which usually contains no appreciable harmonics [9, 46]. During operation with the valves unblocked, harmonic voltages, appear on the valve windings due to the flow of harmonic currents through the transformer. The magnitudes of the harmonic voltages vary with the operating parameters of the converter station. The harmonic voltages on the line windings are much lower in magnitude than those on the valve windings, and this is as a result of the low harmonic impedance of the ac filters. The converter transformer load losses consist of three main components, they are, winding dc resistance loss (𝐼2𝑅 loss), winding stray loss, and stray loss in the structure and external parts, such as the core, clamps, and tanks [16, 47]. Converter transformers load losses can be determined and measured by three methods, which are discussed below.
2.3.2.3 Method I
In this method, the converter transformers load losses are determined by measuring the converter transformer effective resistance at different harmonic frequencies, and subsequently estimating the total load losses as the sum of the losses due to each harmonic currents. The load loss admits expression as [48]:
𝐿𝑜𝑎𝑑 𝑙𝑜𝑠𝑠 = ∑𝑛=49𝑛=1 𝐼𝑛2𝑅𝑛 (2-1) where
𝑅𝑛=The effective resistance, in ohms, at harmonic n.
𝐼𝑛=The current, in amperes, at harmonic n
𝑛= The harmonic number.
2.3.2.4 Method II
This is an approximate method of determining load losses, which do not require measurements at harmonic frequencies. It is based on a typical relationship between the effective resistance of converter transformers (in per unit of fundamental frequency resistance) and frequency. The relationship was developed from the measurement made in accordance with Method 1 on several converter transformers supplied on recent HVDC projects and then the effective
13
resistance is computed. Consequently, the converter transformer losses can be obtained by simply summing together the calculated losses of each harmonic orders.The procedure consists of the following steps:
Measure the load loss of the converter transformer at power frequency in accordance with IEEE C57.12.90-1987.Calculate the effective resistance at the fundamental frequency (𝑅1) from the measurements [4]:
𝑅1= 𝑃𝐿
𝐼2 (2-2) where
𝑃𝐿=The measured load loss in watts for one phase at current I in amperes Determine the effective resistance at other harmonic frequencies
𝑅𝑛= 𝑅1(𝑘𝑛) (2-3) where
𝑘𝑛= relative resistance or harmonic factor.
2.3.2.5 Method III
This method only measures the converter transformers’ losses under power frequency and a frequency higher than 150 Hz, such that it is needless to measure the loss at a frequency of the order of 1 KHz and the measurements are reduced to two. The converter transformer windings eddy-current losses and the stray losses of other structures are calculated by using the measured results, and some well-known equations are used to calculate the total load loss [48]. Method 1 is more precise than method 2, by the virtue of comparing the above three methods, but the required instrumentation and measuring technologies are not owned by all the manufacturers. Furthermore, the Method 1 accuracy is as a result of the measurement accuracy. The converter transformer’s load loss of typical design is intended to be calculated approximately by Method 2. Note that, the accuracy of Method 2 may decrease, if the transformer design is greatly different from the typical design. Method 3 only requires measurement under two frequencies and eliminates the necessity of measuring the losses at frequency of the order 1 kHz. In spite of this, the required measuring accuracy can be achieved [34, 41].
The characteristic harmonic currents are calculated from the following:
𝐼𝑛= 3.𝐹.𝐸𝑝ℎ
𝜋.𝑛.𝑋𝑡 (2-4) where
𝐼𝑛= The current, in amperes, at harmonic n
𝑛= The harmonic number.
𝑋𝑡= The converter transformer reactance at fundamental frequency, in ohms
14
𝑘1= sin[(𝑛−1)𝜇2] 𝑛−1 (2-6) 𝑘2= sin[(𝑛+1)𝜇 2] 𝑛+1 (2-7)𝐸𝑝ℎ= The equivalent line-to-neutral voltage on the valve side of the converter transformer calculated by multiplying the line-to-neutral voltage on the line side by the turns ratio (including the effect of tap position), in volts RMS
𝛼= The firing delay angle, in degrees
𝜇= The commutation overlap angle, in degrees [44].
2.3.3 AC Filter Losses
The principal function of the alternating current filters in an HVDC converter station is to provide a low-impedance shunt for the harmonic currents generated by the converter. Typically, single-tuned, multiple-tuned, and high-pass filters are used in HVDC converter stations. For the purposes of loss determination, the AC system is assumed open-circuited so that all harmonic currents are considered to flow into the AC filters.
In the standby mode, AC filters are not connected to the AC system and, therefore, generate no losses. The AC filters losses include losses of filter reactor, filter resistor and filter capacitor [49].