A Plea for Simpler Electricity Tariffs
Philip E. Coleman and Christopher T. Payne, Lawrence Berkeley National Laboratory Richard G. White, Lawrence Livermore National Laboratory
ABSTRACT
This paper asserts that electric rate structures in the United States are often so confusing that even large commercial customers (and their energy consultants) frequently are not aware of their cost implications. This results in an under-investment in energy conservation and load management approaches. Several case studies are presented and various rate structures are discussed. An argument is made for simpler tariffs, or at least a simplified declaration (in tariffs and/or bills) to electricity customers of what their marginal costs are, such that conservation efforts can be properly valued and designed.
Introduction
In early 2004, an energy services company (ESCO) was working with the U.S. General Services Administration (GSA) on a prospective energy savings performance contract (ESPC) at the Byrne-Green Federal Office Building and Courthouse in Philadelphia. The project appeared to be a “dream” performance contract in the making – enthusiastic customer (GSA had prepared a four-page annotated list of possible energy conservation measures (ECMs) before the ESCO even made its first visit to the site), knowledgeable and driven representatives from the ESCO, strong support from DOE’s Federal Energy Management Program (FEMP, whose umbrella contract was to be used for the project), and fairly high utility prices (e.g., roughly 9¢/kWh for electricity).
However, as the ESCO moved forward with its development of the initial proposal, its representatives started becoming less sanguine on the project. They claimed that their analysis was revealing long payback times for the ECMs due to very low electricity prices, less than 3¢/kWh. FEMP and GSA were incredulous. Byrne-Green’s electric utility, PECO Energy, was known for having high electricity prices and GSA’s facilities had been in the city, under the same tariff, for decades. Select’s assertion that electricity was this cheap seemed patently absurd.
Who was right? Was it 9¢/kWh – roughly, the price GSA claimed it had been paying for years – or just one-third that, as the ESCO was asserting? It turns out that both parties were correct, at least partially. The average cost of electricity at Byrne-Green, which GSA tabulated by dividing its electric costs by its total consumption, was roughly 9¢/kWh. The marginal rate for energy – the appropriate figure with which to value the “avoided cost” from electric conservation measures – was just as the ESCO had identified, about 3¢/kWh.
So, for the purposes of the proposed energy conservation project, the ESCO’s analysts appeared to be “more right” than GSA. However, they were missing something too. The reason that the average cost for Byrne-Green’s electricity was three times the marginal cost was that PECO Energy’s HT (high-tension) rate was a “declining block” rate (i.e., unit costs go down as consumption goes up) and also included an extremely high demand charge – roughly $27 per kW
enough to discover the low energy (kWh) cost, the extent of the HT demand charge was not evident to them (about one half of PECO’s full effective demand charge is hidden by a “kWh per kW” or “block-by-demand” structure). When Lawrence Berkeley National Lab (LBNL) intervened on behalf of FEMP, it discovered this high demand charge and tried to help the parties re-structure the project to take advantage of it, but to no avail. The project died.
Following the demise of the project, GSA and FEMP requested that LBNL investigate another ESPC that had already been completed on two other GSA buildings in Philadelphia that were both under PECO’s same HT rate. In this instance, LBNL revealed that the ESCO (different from the one working on the Byrne-Green site) had completely misunderstood the rate and had mis-valued all of the project’s ECMs. Fortunately, those mistakes both over- and under-valued ECMs such that the project’s savings guarantee was still met. However, by missing the high demand charge, the ESCO had missed several other attractive savings opportunities (one of which GSA began pursuing on its own, with great success).
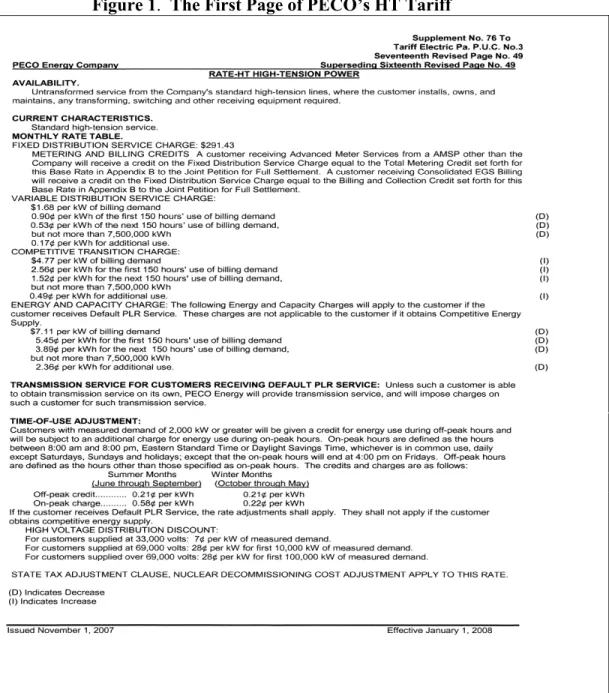
Why was it that a large (10 MW) customer that had been paying for its electricity under the same tariff for several decades, along with two ESCOs that were undertaking performance contracts on which they were required to guarantee savings, all misunderstood the price that PECO was charging for electricity? The first reason is that PECO’s HT rate is a complex block-by-demand rate (the kWh per kW structure essentially imposes an additional demand charge – this is what the ESCO on the Byrne-Green facility missed).
The second reason for the misunderstanding is that PECO’s expression of its HT charges, both in its bills and in its regulated tariff, ranges from uninformative to Byzantine. The tariff shows eight different main components of the charges, four of which have four sub-components each and another of which has two. Consequently, there are 21 discrete calculations (excluding taxes) necessary to determine the total amount of the monthly charge (and four of these require the customer to search for a separate tariff, which deals exclusively with transmission prices). This is remarkable given that the monthly charges can for most HT customers like the Custom House be simplified, albeit with a good deal of algebra, into three components: a fixed customer charge (in dollars), an energy charge (in cents/kWh), and a demand charge (in dollars/kW).
PECO’s bills to its HT customers, on the other hand, merely show the totaled charges per major category: customer charge, generation, transmission, transition, and distribution. The individual charges are not itemized and related to consumption, so there is no way for customers to check that the amounts charged on the bills are accurate.
The Problem of “Rate Incomprehensibility”
The fact that many, if not most, electric utilities, like PECO, do not provide sufficient information on their bills such that customers can check for accuracy is probably less important than the fact that both the tariffs and the bills also leave these customers in the dark regarding the value of their actions to conserve energy. As Payne (2006) discovered from his study of mostly small-and medium-sized business owners and managers, there
is a sense of disempowerment for many consumers. Rather than seeing their energy consumption as something under their control, they instead view the energy bill as an unavoidable component of operating a business, comparing it to other required expenses like rent or taxes.
Though Payne did find a greater degree of understanding among the larger businesses he surveyed, basic concepts such as demand charges were still largely elusive. Another study of businesses in a New Jersey strip mall found similar ignorance: none of the owners or managers interviewed was able to identify the demand charge on their bills (Komor and Kempton, 1991). While both of these studies’ interviews occurred in the 1990s before many states re-structured their electricity markets, there is no reason to believe that the level of understanding has increased. In fact, with charges coming from two suppliers (one usually representing the generation and transmission components, the other distribution), or with these “unbundled” services separately itemized in the bill, the confusion may have increased (Payne, 2006).
Larger commercial and institutional customers, as well as industrial customers, have sufficiently high bills such that they can cost-effectively assign energy managers within their organizations, or at least hire consultants to help them with these matters. However, experiences such as the GSA’s in Philadelphia – and similar though lesser mistaken readings of tariffs by other federal agencies (including the U.S. Architect of the Capitol and the Department of Energy) – reveal that even knowledgeable energy managers, both in-house and at ESCOs and other energy consultancies, often do not understand the electricity charges facing them.
The concept of “search cost” – the effort required to gain accurate information in advance of investment – for energy efficiency is well identified in the literature (e.g., Anderson 1993; Coleman 1998; Hein and Blok 1995; Jaffe and Stevens 1994). However, these studies do not address the lack of transparency of energy rates and the effort required to overcome their complexity – nor the perhaps more formidable cost of failing to overcome it, which appears to be a common phenomenon. This paper assumes that if large customers better understood their tariff structures and marginal costs of electricity, their pursuit of energy conservation and load management strategies would increase significantly.
Electric Utility Economics and Tariff Structures
Electric utility economics are complex. There are energy (generation) costs, transmission costs, distribution costs, and capacity costs, all of which must be accounted for and all of which, ideally, should be distributed among users in a way that reflects those users’ utilization of each component. Electric utilities and their regulators at the federal (wholesale) and state (retail) levels all attempt to account for these services in a way that a) allows for recovery of the costs for the utilities, and b) allots the costs to end-use customers in a fair manner.
However, in accounting for these myriad costs and assigning them to customers, another important aim needs to be the clarity of the price signal to the consumer. Only with this clear understanding of its charges will the consumer be able to estimate the value of conserving energy and match this, at least to some extent, with the cost of achieving that conservation.
While Payne, Komor and Kempton, and others have documented just how misunderstood energy bills can be, another element that may be equally confusing to consumers – even large ones – is the underlying energy rate structure itself. Basic energy (usually in ¢/kWh) and demand (usually in $/kW) charges are common to most utilities, but often in conjunction with:
• demand ratchet charges (which impose repeated monthly demand levies based usually on one summer peak kW mark reached by customers),
• time-of-use charges (where peak time energy use is more expensive than off-peak),
• power factor charges (for not reaching a specified power factor, often 90%),
• standby charges (for customers with large self-generating capabilities that occasionally require substantially greater amounts of utility energy due to failures in this equipment),
• public benefits charges (to fund conservation or renewables programs),
• fuel price adjustment surcharges,
• taxes, and
• other miscellaneous charges (sometimes assessed in terms of fixed fees or more often as a per-kW or -kWh levy).
Moreover, many utilities charge for electricity based not only on what can be found in the assigned tariff, but also on any number of “riders” or other components that are found elsewhere in the utility’s book of tariffs. For instance, as mentioned above, PECO does not list its transmission rates in its HT tariff; these are found in another filing that includes the transmission rates for all the company’s tariffs. Potomac Electric Power Company (PEPCO) has an ostensibly straightforward large commercial tariff (GT 3A) of only one and a half pages – and with only a fixed customer service charge and variable charges for energy and demand. However, at the bottom of this tariff is a listing of a dozen applicable riders (additional conditions and/or charges that may apply to some customers): SOS (standard offer service) – Large Commercial, Administrative Credit, Reliability Energy Trust Fund, Generation Procurement Credit, Power Factor, Delivery Tax, Public Space Occupancy Surcharge, Excess Facilities, Divestiture Sharing Credit – Non-Residential, Net Energy Metering Rider, Reserve Delivery Capacity Service, and Residential Aid Discount Surcharge Rider. There is no explanation of which of these twelve riders might be applicable to which customers nor whether they are levied as fixed or variable (e.g., per kWh or kW) charges.
In lieu of the conventional energy and demand charges, some utilities base their charges solely or primarily on energy (kWh) usage but vary these charges by the time of use. Another structure assesses a sliding scale, such that a first block of energy (kWh) each month is charged at one rate, while subsequent blocks incur either higher (increasing block) or, more commonly, lower (decreasing block) rates. A variation on this is the kWh per kW rate (like GSA’s in Philadelphia), in which the size (number of kWh) of the blocks is dictated by the customer’s load factor (such that customers with higher load factors pay for a greater percentage of their usage at lower rates).
Given this broad diversity in the way electricity is charged to customers, one cannot help but wonder if all the complexity is really necessary. After all, some suppliers (such as PEPCO, the electric utility for the Washington, DC area) merely assess the basic energy and demand charges each month to their large commercial customers (though one or more of the riders can be applicable, as discussed). On the other hand, perhaps some of the more complex structures, such as kWh per kW, are more reflective of actual utility costs and thus defensible in their more economically optimal assignment of these costs to customers.
However, given the lack of comprehension of electricity charges witnessed by Payne and Komor and Kempton, as well as those experienced firsthand by the authors among numerous federal agencies and their ESCOs, we ask if it is worth turning the focus away from a theoretically efficient, though convoluted, cost accounting approach and toward a process whose emphasis is on providing clear information to customers. Although a tenet of neoclassical economics is that market prices should ultimately be reflective of underlying costs, another key is that consumers have sufficient information about, and can respond to, these prices. If even large customers, along with the energy experts serving them, are not fully knowledgeable about the charges they are being assessed, there is clearly a serious failure in the market. Moreover, the complexity of tariffs and customer bills appears, at least in some cases, to be muting the ability of consumers to efficiently respond to electricity prices.
Solutions to the Problem
because of the inherently confusing distinction between energy and demand, along with the multitude of ways in which electricity suppliers recover their charges to large customers, one antidote may simply be some standardization of the way in which prices are represented in tariffs.
Though it might seem unduly draconian, what if utilities were required to present their tariffs in a standardized manner (similar to, for instance, the way in which the U.S. Food and Drug Administration requires the reporting of nutritional information on food labels or states mandate the presentation by gasoline stations of their retail prices)? Certain elements would be required and extraneous information and claims would be explicitly excluded. Cost elements would need to be assigned to just two or three price components. Presentation across the utilities in a given state, or perhaps even the whole country, would be standardized such that consumers could much more easily assess their true costs, and thus also the true value of making both long- and short-term changes to how they use electricity.
Even though it is important for utilities to continue to delineate the various costs facing them to their public service commissions, there is little if any benefit in breaking these costs out for their customers. Indeed, this bombardment of information results in tariffs that are typically between two and ten pages long. Instead, individual tariffs might be mandated to fit on a single page. This would be ideal for helping customers and could be implemented in conjunction with bill simplification.
While this is no doubt a desirable end, such a transition would be enormous, defying decades of utility company and public service commission precedent. Perhaps a more reasonable path would be to require utilities to at least present a simplified box in their customer tariffs (and/or bills) with a pared-down presentation of their charges – or at least their marginal charges, which would be most valuable to consumers for the purposes of their conservation initiatives. This could be expressed in terms of two or three simple components, including, most obviously, energy (kWh) and demand (kW). While this would permit the tariff’s ability to include a multitude of different charges, it would force these to be condensed into one of the few permissible price components. The box might have a standard, required title, such as “Simplified Customer Monthly Rates” or “Monthly Rates for Energy Conservation Valuation.”
A few examples of such a declarations box are provided below. In the most simplified model, only energy and demand charges could be shown (see Figure 1).
Figure 2. Proposed Tariff Declarations Box, with Energy and Demand Charges Only
Since this might be seen as unduly limiting the range of what utilities could charge for, a slightly more expansive set of charges might be shown, such as ratchet charges, as in Figure 3.
Monthly Rates for Energy Conservation Valuation 1) Energy Charge: $0.XX per kilowatthour (kWh)
Figure 3. Proposed Tariff Declarations Box, with Energy and Demand Charges, plus Ratchet Clause
Another option (see Figure 4) might be one that showed some seasonal variation in charges, particularly to accommodate the fact that utility capacity costs tend to be higher in peak (usually summer or winter) seasons.
Figure 4. Proposed Tariff Declarations Box, with Energy and Seasonal Demand Charges
An additional option might be a time-of-use variant, as seen in Figure 5. This option also takes into effect the added cost to serve customers during peak, as well as the generally higher capacity costs also experienced during peak seasons.
Figure 5. Proposed Tariff Declarations Box, with Time-Of-Use Energy Charges Only
These figures represent just a few potential options and there are dozens more possible, including combinations of these. The key point is that the utility or other electricity supplier would be required to simplify its charges, as well as their presentation in tariffs, for the purpose
Monthly Rates for Energy Conservation Valuation 1) Energy Charge: $0.XX per kilowatthour (kWh)
2) Demand Charge: $XX.XX per kWpeak (highest kW level reached during the month)
- Demand Ratchet: XX% of highest demand (kW) in summer/winter (_________ 1st – ________ 31st) becomes minimum demand (kW) charge in non-summer/winter months (___________ 1st – ____________ 30th)*
* This will be the kW level for your demand charge (# 2, above) in any of those eight months unless your facility reaches a higher actual demand level in the same month.
Monthly Rates for Energy Conservation Valuation 1) Energy Charge: $0.XX per kilowatthour (kWh)
2) Winter Demand Charge: $XX.XX per kWpeak (highest kW level reached during each of
the four winter months – December, January, February, March)
3) Summer Demand Charge: $XX.XX per kWpeak (highest kW level reached during each of
the eight non-winter months – April, May, June, July, August, September, October, November)
Monthly Rates for Energy Conservation Valuation
1) Winter Energy Charge: $0.XX per kilowatthour (kWh) – applicable November 1 - April 30.
2) Summer Peak Energy Charge: $0.XX per kilowatthour (kWh) – applicable May 1 - October 31, 12-6 P.M.
3) Summer Off-Peak Energy Charge: $0.XX per kilowatthour (kWh) – applicable May 1 - October 31, all hours except 12-6 P.M.
changes to the tariff. While suppliers might resist such measures as being unduly restrictive, the assignment of various fixed and variable costs is the same phenomenon that occurs in most retail markets, from food to auto parts. Goods may have any number of cost elements that go into them, but their prices usually include just one component (and only rarely more than two or three) – e.g., price per unit or weight.
Electricity has some physical characteristics that distinguish it from other commodities. Specifically, electricity cannot be easily stored so in most cases must be used at the moment it is produced. This property, along with the diurnal and seasonal cycle of demand (peak daily demand can be up to double “base load” demand), can lead to electricity having significantly varying production costs at different times of the day and year when differing quantities must be supplied (e.g., “peak” power is generally more expensive to produce than base load power). This situation, however, is not rare in commodity supply, where supply curves are rarely flat. From an economic efficiency perspective it is important that customers understand how and when these time-of-use components impact their costs and ultimately their end-use options. If not, they will be unresponsive to them.
Expected Impacts
What would be the result of this simplification of tariffs? One likely outcome would be to substantially reduce the intractable (“unavoidable”) quality of electricity costs that Payne’s subjects perceived. Though most large commercial and industrial customers usually have some expertise in managing energy and often institute at least some energy conservation measures, the nuances of their tariffs are generally lost on them.
For instance, in 2005 the U.S. GSA’s Custom House facility in Philadelphia, another federal office building, was paying a steep demand charge (about $27/kW per month) that was largely obscured in the same confusing (HT) tariff that the Byrne-Green facility faced. They were also subject to a demand ratchet of 80% of their highest summer demand (the highest 30-minute interval meter reading of the summer) during each of the eight months from October to May, which was costing them nearly $100,000 per year. They did not realize this nor did the ESCO that had installed a project at the site two years earlier. A simple pre-cooling routine, where the facility’s chilled water system turns on early (at 2 A.M. instead of 6 A.M.) during hot summer nights has resulted in direct demand charge savings of roughly $35,000 each summer and an additional $65,000 in winter ratchet payments each year. This $100,000 savings represents almost 15% of their previous total annual electricity charges and was achieved with virtually no up-front cost.
Another federal example is the U.S. Department of Energy headquarters in Washington, DC. No one that was working on a large performance contract (including the ESCO) in 2007-8 was aware that a supplementary charge assessed to DOE by their third-party electric supplier was actually an auxiliary demand charge from the mid-Atlantic grid operator, PJM. This was adding over $300,000 per year to their electric costs. Because the charge is set by the previous summer’s peak demand and is assessed as a constant dollar amount each month – and because the supplier did not explain the charge on the bill – it was interpreted as a fixed fee that was not subject to reduction through conservation or load management measures.
Mere understanding of electricity charges opens up the whole area of “rate-responsive” building operation, as exemplified by the GSA’s pre-cooling case. While some of this load management activity already occurs in the U.S. – for example, thermal storage systems are not
uncommon in very large facilities – most appears to be as part of special utility-sponsored programs to stimulate it, often with special incentives and technical assistance. In the same way that transparent peak pricing premiums help influence people’s choice of train and flight schedules, buildings would be much more likely to control the timing of their energy use if building operators fully understood the energy cost variations across time (days and sometimes seasons) that they are usually subject to.
Additionally, fuller understanding of electricity charges could open up significantly greater opportunities for conservation. If large customers comprehended their full marginal electricity costs, they would generally find that these costs are greater than they had realized. This is because many electricity charges are either missed altogether or misinterpreted (such as the PJM demand charge at DOE headquarters) in a way that undervalues their full impact on total costs.
Conclusion
Commercial and institutional customers often do not understand their electricity charges fully. This is not because of their stupidity or negligence, but rather due to the complex and confusing rate structures they face. This problem is exacerbated by uninformative and confusing bills. It is important for electric utilities and third-party electricity suppliers to recover their prudently incurred costs, and utility commissions clearly have a duty in requiring fair and accurate accounting of the true costs. However, simplifying and standardizing these rate structures – and presenting them in more intelligible ways – will go a long way to helping make the markets function more efficiently by allowing customers to more easily understand and respond to their actual electricity costs.
References
Andersson, Bo. 1993. “A Search Cost Approach to Energy Efficiency Barriers.” In the Proceedings of the 1993 ECEEE Summer Study 2 (3): 3-9. Stockholm, Sweden: European Council for an Energy Efficient Economy.
Coleman, Philip. 1998. “Reducing ‘Search Cost’ and Risk in Energy-Efficiency Investments: Two Success Stories.” In the Proceedings from the 1998 ACEEE Summer Study on Energy Efficiency in Buildings 4:91-98. Washington, D.C. American Council for an Energy-Efficient Economy.
Hein, Lars G. and Kornelis Blok. 1995. “Transaction Costs of Energy Efficiency Improvement.” In the Proceedings of the 1995 ECEEE Summer Study 1 (2): 107. Stockholm, Sweden: European Council for an Energy Efficient Economy.
Jaffe, Adam B. and Robert N. Stavins. 1994. “The energy-efficiency gap: What does it mean?” Energy Policy 22 (10): 804-810.
Komor, Paul S. and Willett Kempton. 1991. “Maybe somebody forgot to turn the chiller on: Energy information and behavior in small businesses.” Journal of Environmental Systems 20(2): 111-127.
Payne, Christopher T. 2006. “Energy Consumption Behavior in the Commercial and Industrial Sector: An Ethnographic Analysis of Utility Bill Information and Customer Comprehension in the Workplace.” Ph.D. dissertation for the University of Delaware. Newark, Del.: University of Delaware.