Total Harmonic Distortion Performance of The
Grid Connected Solar Photovoltaic System at
Universiti Teknikal Malaysia Melaka
Sin E Chong
*, Chin Kim Gan
*,**, Kyairul Azmi Baharin
*, Pi Hua Tan
****Faculty of Electrical Engineering, Universiti Teknikal Malaysia Melaka, **Advanced Manufacturing Centre, Universiti Teknikal Malaysia Melaka,
***Pöyry Energy Sdn. Bhd., Kuala Lumpur, Malaysia,
(chongsine@gmail.com, ckgan@utem.edu.my, kyairulazmi@utem.edu.my, tan.pi-hua@poyry.com)
‡ Corresponding Author; Sin E Chong, Faculty of Electrical Engineering, Universiti Teknikal Malaysia Melaka, Jalan Hang Tuah
Jaya, 76100 Durian Tunggal, Melaka Tel: +60 62701000, chongsine@gmail.com
Received: 20.08.2019 Accepted:18.09.2019
Abstract- The worldwide installation of solar photovoltaic (PV) system has proliferated in the last decades. This will inevitably introduce power quality issues to the grid as the solar PV penetration increases. The high switching frequency from the solar inverter has produced unwanted electrical signals that will eventually injected into the power grid. Thus, this paper aims to investigate the total harmonic distortion (THD) performance of the solar inverters under real operating conditions. More specifically, it focuses on the THD performance of the single-phase grid-tie inverters which are installed at Universiti Teknikal Malaysia Melaka (UTeM). The well-established K-Means clustering technique has been utilised to perform the characterization of THD current from the collected data. In addition, the correlation between the THD current with the solar irradiance and the inverter’s output power ratio were also presented and discussed. The findings of this study suggest that the THD current from a solar inverter is highly dependent on the solar irradiance of which the recorded THD current values can be as high as over 60% during the starting-up and shutting-down of the inverter. Furthermore, the THD current values can be broadly categorised into four different categories, depending on the level of solar irradiance.
Keywords: Solar photovoltaic system, total harmonic distortion, WEKA tool, K-Means clustering technique
1. Introduction
Energy plays a vital role in human's daily life and fossil fuels are still the main resource of primary energy. However, fossil fuel burning is one of the main factors that cause the emissions of carbon dioxide that lead to global warming [1]. In order to address this problem, research on renewable energy has become one of the main interests worldwide, including Malaysia which is blessed with abundant of solar energy.
Solar energy is known as one of the promising renewable energy sources that offers zero pollutants during the energy production stage and relatively safe. The increase of conventional energy production cost, coupled with the sharp drop of solar modules price with increased efficiency, has prompted the rapid solar PV market growth globally [1]. Besides that, the Ministry of Energy, Science, Technology,
Environment and Climate Change (MESTECC) have targeted to increase Malaysia’s renewable energy sources contribution from the current 2% level to 20% of the total generation mix by 2030.
The penetration of solar PV generation into the power grid in Malaysia has increased over the years. As a result, it introduces various technical issues to the design and operation of the distribution system. It is well understood that distributed energy resources may help to reduce network losses and delay network reinforcement [2]. However, high penetration of distributed energy resources, especially solar PV system will lead to a number of technical challenges, for instance, voltage fluctuation, reverse power flow, power factor variation and islanding and power quality problem [3-4].
S. E. Chong et al., Vol.9, No.4, December, 2019
One of the important elements in a solar PV system is the grid-tie inverter. The output power generated from the inverter produces unwanted electrical harmonics. In this regard, the Sustainable Energy Development Authority (SEDA) Malaysia has published a guideline for the connection of solar photovoltaic plant to the electricity networks. It stated that the total harmonic distortion (THD) for current shall be less than 5 % at inverter rated output [5] as shown in Table 1. Previous study has shown that the overall THD performance is strongly depended on the system output [6]. In this paper, the THD current data which were collected from the single-phase solar inverters, installed at the Faculty of Electrical Engineering (FKE), Universiti Teknikal Malaysia Melaka is analysed and evaluated.
Table 1 : THD current limitation standard based on IEEE 1547-2003 [7].
Solar irradiance can be the key factor that may significantly impact the THD levels from the solar inverter. Several studies have claimed that low PV power output due to low solar irradiance can cause the THD current percentage to increase [8 -13]. Moreover, the THD impact can be more substantial for a sudden drop of solar output power from high solar irradiance [9], [11], [14]. PV plant model have developed in several studies to observe and analyse the relationship between the solar irradiance and the THD current [8 -16] . The studies have modelled the PV plant by using PSIM [15], PSCAD [14], MATLAB Simulink [11] and LabView [10]. However, limited studies have utilised the actual data for the THD analysis.
Rajiv K. Varma deals with the performance of harmonic with the grid-connected PV system [14]. The paper presented to be one of the first studies that focus on the harmonic impact for large photovoltaic plant with 20MW. CYME and PSCAD was used to construct the utility network models for PV farm in Ontario. Both data of high solar irradiance and low solar irradiance days are collected and analysed by doing comparison.
Papaioannou analysed on harmonic performance for small PV systems that connected to low voltage electricity grid [15]. This paper presents for a review for data collected from 20kWp solar arm in Korinos on several days in October 2007. Instruments such as Microvip3 Plus, Fluke Power harmonic Analyser and pyranometer have been used to collect data of current and voltage harmonics, voltage, current inputs to grid and solar radiation. Studies analyses the relationship
THD value. However, the case study also shows that day with overcast weather with low solar irradiance had 17.65% for the average value of current THD.
Schlabbach presented a paper to encourage the concern on harmonic issue in PV system by developing simulation program [16]. MATLAB is the main software that functions to calculate the current harmonic and power generation from PV based on the data obtained on season of summer and winter. These two seasons are selected to represent the weather with relatively low and high solar irradiance. Both current THD results from two seasons are shown and analysed from the display graph. Low current THD during high solar penetration and high current THD due to low penetration is summarized in this paper.
Previous similar studies on the THD performance has been conducted in UTeM laboratory [11] by observing the THD value on both cloudy and sunny day. This study has extended the work by analysing the performance of THD under various solar irradiance levels. In addition, the relationship between the THD current performance and solar inverter output power ratio was established in this work.
2. Methodology
2.1 Data Collection
Clustering is known as the most important and popular unsupervised learning method within the field of machine learning. Clustering divides a collection of unlabelled data into groups according to their similarities [17]. It aggregates the data points with similar characteristics into same groups and assigns the groups with similarities into a cluster. A cluster is a group of gathered data due to their similarities while data without the similarity will be grouped as different clusters. There is no defined class or pre-determined categories in this method [18].In this paper, K-Means clustering technique will be utilised to classify the characteristics of THD current performance for the system installed at FKE, UTeM.
2.2 Data Collection
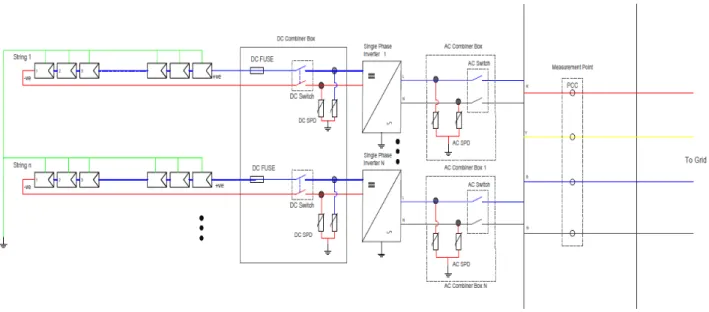
Fig. 1 shows the Single Line Diagram (SLD) of the solar PV system which was installed in FKE, Universiti Teknikal Malaysia with 23.88kWp installed capacity. Data Measurement and collection were carried out at the point of common coupling (PCC) as shown in Fig. 1. THD current measurement is collected for three months (August, September and October 2018) while the time interval for these data is per one minute. IEEE 1547-2003 specifies on the limit on the harmonic current level and focuses on the interconnection of distributed energy resources [7]. Based on this standard, it mentioned that 5% is the THD limit for PV system with 10kW or 30kW.
2.3 K-Means Clustering Technique
S. E. Chong et al., Vol.9, No.4, December, 2019
them into clusters with predefined the number of clusters, k. The squared error between the mean of a cluster with the data points in the respective cluster to be minimized is the goal of
K-means for all the generated clusters. K-Means clustering method has been practised in numerous researches in electrical and power system as well as solar system related studies. These researches comprise studies in energy losses, electricity consumption, electricity usage, voltage control in power
management, black-out detection, solar resources for grid management and etc [19-26].
The data points in a cluster is named as 𝐶"while the mean
or the centroid of a cluster defined as 𝜇". Equation (1) below
shows the squared error between the 𝐶" and 𝜇". This
algorithm aims to obtain the minimum sum of error within all the k clusters.
Figure 1 : Single line diagram for the solar system in FKE, UTeM.
(1)
K-means algorithms randomly select 2 data points as the cluster centroid when the number of k is specified as 2 and it is an iterative algorithm which it will only finish the process when the local maxima for clusters is obtained. Basically, only two steps are repeated in this algorithm, clustering data into groups and re-centre the centroid of the clusters.
K-means algorithm produces result that strongly depends on the selection of optimal number of clusters. There is no definitive answer that can clearly explain how the optimal number of clusters is determined. Two different methods are implemented in this study to determine the optimal number of cluster in WEKA tool, namely, Elbow method and Silhouette method.
The Elbow method can be known as the method in determining the optimal number of clusters which is very common and widely used and at the same time, it has the longest history [27-28]. The Elbow method which was implemented in the K-means algorithm will produce a graph with plotting of the within cluster sum of errors (WCSS) for each k values. The WCSS decreases proportional to the increase of k value. Equation (2) below represents the formulae used for calculating WCSS where 𝑃% are data points
in respective clusters and 𝐶% is the centroid of each cluster.
(2) Distance from each data value within the respective cluster is calculated using Euclidian Distance. From the graph plotted based on the calculation, the optimal number of clusters would be selected by observing the graph as the WCSS drops marginally. At certain level, the WCSS value from the increasing number of cluster will reach its stable state as it does not contribute many changes on the result. The point to be selected would seem like an "elbow" point in the graph plotted from the WCSS calculated for each number of the cluster.
Silhouette method implemented in K-means clustering algorithm helps to determine the best number of cluster by calculating the distance between each data point with the remaining data points in its respective cluster. The distance for each data point with data points in the nearest cluster are calculated as well [29]. The result of all distances to other data points in its own cluster and data points in the nearest cluster are then averaged into a new value. The Silhouette index is then obtained by referring to the rules as shown below.
For a data point in the first cluster defined as i and the silhouette of i is defined as Equation (3) below.
å
Î -= k i c x i k k x C J( ) µ 2å
å
= + = n cluster in P n n n cluster in P C P ce dis C P ce dis WCSS 1 1 2 1 2 1 1 ) , ( tan ) , ( tanS. E. Chong et al., Vol.9, No.4, December, 2019
(3)
where a(i) is the average distance from point i to all other points in the first cluster and b(i) is the average distance from point i to all the points from the nearest cluster to the first cluster.
The silhouette index that is close to 1 implies that all the data points groups into their respective clusters are relatively far from their closest neighbouring cluster. This prove that the dataset is well clustered. Hence, the silhouette index with the highest value would be selected to represent the best number of cluster in the dataset.
2.4 Performing K-Means Clustering in WEKA tool
KnowledgeFlow application is an approach presented in graphical interface to perform algorithm data mining process apart from using Explorer application in WEKA. The reason to utilise KnowledgeFlow application is due to its ability to process multiple algorithms at the same time for single or more multiple dataset.
In this study, the dataset will be clusteredin two different algorithm libraries available in WEKA which are
SimpleKMeans and KValid. KValid is a set of algorithm library that is able to perform K-Means clustering algorithm with both Elbow and Silhouette methods. These set of clustering library which were added manually are
SimpleKMeans and KValid. KValid is a set of algorithm library that is able to perform K-Means clustering algorithm with both the Elbow and Silhouette methods. This library is
added manually to the WEKA in order to perform the clustering algorithm with both methods.
3. Results
3.1 Correlation on Performance of Total Current Harmonic Distortion
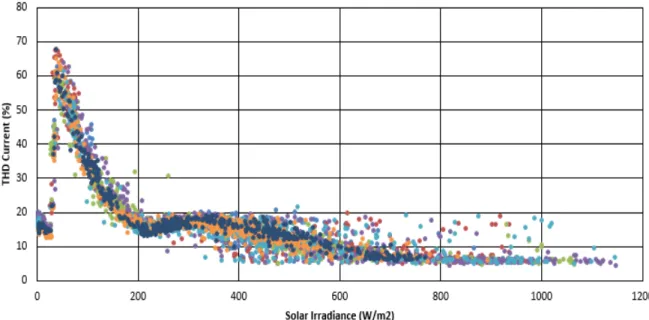
Figure 2 depicts the relationship between solar irradiance and THD current of one week in a scatter diagram. It can be observed that when the solar irradiance is low, the THD current waveform is heavily distorted resulted by high percentage value of THD current. The high THD current of more than 20% was recorded whenever the solar irradiance is below 200 W/m2. The THD current starts to decrease as the
solar irradiance increases. In addition, the figure clearly shows that the THD current reaches its steady state value of 4% - 6% when the solar irradiance’s value is more than 800 W/m2.
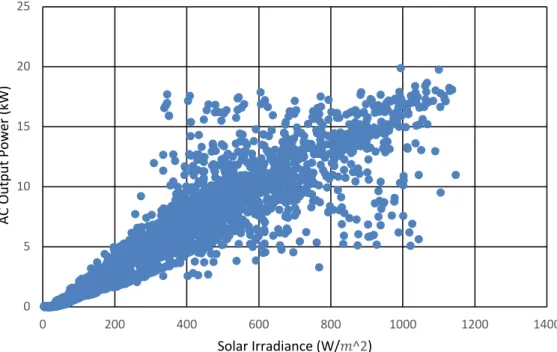
Figure 3 shows the relationship between solar irradiance and the AC output power produced by the solar system. As expected, the increase of solar irradiance results in the increase of the solar system AC output power.
Figure 4 shows the system output ratio calculated from one-week data and plotted corresponds to its THD current. The performance of THD current for the solar PV system in FKE Lab, UTeM is analysed with the output power of the system. It can be clearly seen from Fig. 4 that most of the THD current values that have value more than 20% are contributed by the system output to inverter ratio which is lower than 0.1. As clearly shown in figure below, the THD value for current is getting lower as the output power of the system increases. The THD current achieves its best result for the system at a range of 4% - 6% once the system output to inverter ratio is higher than 0.5 . ï ï î ï ï í ì > -= < -= ) ( ) ( 1 ) ( ) ( ) ( ) ( 0 ) ( ) ( ) ( ) ( 1 ) ( i b i a if i b i a i b i a if i b i a if i b i a i s
S. E. Chong et al., Vol.9, No.4, December, 2019
Figure 3 : Inverter AC output power of the system based on solar irradiance.
Figure 4 : System output to inverter ratio corresponds to THD current for the period of one week.
3.2 Data Simulation
In this study, three different datasets were utilised in the
K-Means clustering technique in WEKA which are data in August, September and October from FKE Lab, UTeM. Clustering validation methods which are Elbow and Silhouette method have been implemented on K-Means clustering. This is to determine the optimal number of cluster on each dataset. The sum of squared errors obtained from the application of Elbow method on K-Means clustering in WEKA on dataset of August, September and October respectively are displayed in Fig. 5, Fig. 6 and Fig. 7, respectively. The selected elbow points in these figures are labelled with red circle. As all three months experienced almost the same conditions for the results
obtained from K-Means algorithm with implementation of Elbow analysis, the number of cluster, k for data from these three months are selected to be 4.
The Silhouette index for all data from these three months obtained from WEKA tool are shown in Fig. 8, Fig. 9 and Fig. 10, respectively. The selection of the best number of cluster by using Silhouette method is completed by choosing the number of cluster, k that gives the highest value of Silhouette index. Based on the graphs plotted, it can be seen that the highest Silhouette index for these three months are all obtained when the number of cluster, k = 2.
0 5 10 15 20 25 0 200 400 600 800 1000 1200 1400 AC Ou tp ut P owe r ( kW ) Solar Irradiance (W/𝑚^2)
S. E. Chong et al., Vol.9, No.4, December, 2019
Figure 5 :Sum of squared errors for K-Means with number of cluster for 𝑇𝐻𝐷* data on August.
Figure 7 :Sum of squared errors for K-Means with number of cluster for 𝑇𝐻𝐷* data on October.
Figure 9 : Silhouette index for K-Means with number of cluster for 𝑇𝐻𝐷* data on September.
Figure 6 : Sum of squared errors for K-Means with number of cluster for 𝑻𝑯𝑫𝒊 data on September.
Figure 8 : Silhouette index for K-Means with number of cluster for 𝑇𝐻𝐷* data on August..
Figure 10 : Silhouette index for K-Means with number of cluster for 𝑻𝑯𝑫𝒊 data on October.
3.3 Application Based Clustering Data
In this study, the objective of applying clustering analysis on THD current is to understand the characteristics and behaviour of solar PV system in FKE Lab, UTeM. By implementing both clustering results obtained by using K -Means algorithm, it can be noticed that clustering result for
k=4 can explain the hidden nature of THD current better than the clustering result for k=2.
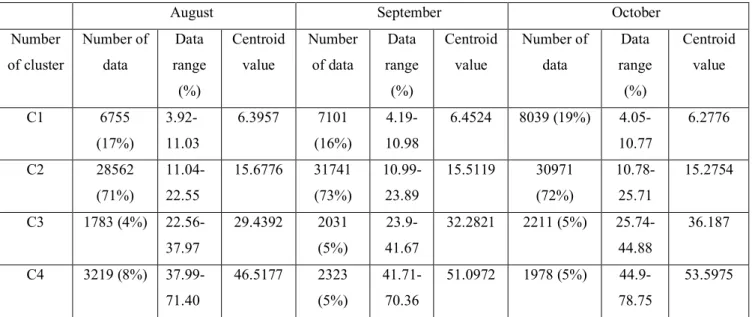
Figure 11 shows THD current on a day in September is applied on the clustering result for k=4 obtained in September. The data ranges for each cluster have been shown previously in Table 2. The THD current that exceed 41.71% in September
the start-up and shut down operation. It can be further observed that the THD current which said to be poorly performed occurs for the first and last 15 to 20 minutes on the morning and evening respectively. Moreover, Cluster 3 gives range from 23.9% until 41.67% which also accounts for 3% of the whole dataset typically happened at small period for 20 to 40 minutes on the morning and evening respectively.
Besides that, Cluster 2 has a THD current range from 10.99% to 23.89% and covers around three quarters of the overall data are listed in this cluster. Aside from the data point measured at the night time, it was found that data points in
S. E. Chong et al., Vol.9, No.4, December, 2019
duration is still relatively low and slowly increasing as time goes by. The same condition occurs at 4.10 pm on the same day. Figure 11 points out that the dropping of solar irradiance during the afternoon period which believes to be caused by passing clouds results in the increase of THD current value and these increased THD current data points are then belonged in Cluster 2.
In addition, it is also worth noting that Cluster 1 that includes data range from 4.19% to 10.98% in September
occurs for quite a long duration during daytime. It can be observed from Fig. 11 that THD current from 10.30 am to 4.00 pm mostly contributed in Cluster 1. There are only certain short durations that the THD current arises to range considered in Cluster 2 (value more than 10.98%) and the longest duration only last for 11 minutes. This is believed to be caused by passing clouds which results in decrease in solar irradiance.
Table 2 : Clustering result for data of August, September and October when k = 4. August September October Number of cluster Number of data Data range (%) Centroid value Number of data Data range (%) Centroid value Number of data Data range (%) Centroid value C1 6755 (17%) 3.92-11.03 6.3957 7101 (16%) 4.19-10.98 6.4524 8039 (19%) 4.05-10.77 6.2776 C2 28562 (71%) 11.04-22.55 15.6776 31741 (73%) 10.99-23.89 15.5119 30971 (72%) 10.78-25.71 15.2754 C3 1783 (4%) 22.56-37.97 29.4392 2031 (5%) 23.9-41.67 32.2821 2211 (5%) 25.74-44.88 36.187 C4 3219 (8%) 37.99-71.40 46.5177 2323 (5%) 41.71-70.36 51.0972 1978 (5%) 44.9-78.75 53.5975
Figure 11 : One day (04/09/2018) THD current data implemented with clustering result (k=4).
4. Conclusions
This paper presents the analysis of the total harmonic distortion performance of the grid connected solar photovoltaic system at Universiti Teknikal Malaysia Melaka. The analysis was performed based on actual data collected
from the solar PV system which was installed in FKE, UTeM. The correlation between THD current and solar irradiance level has been established. From the observed correlation, it can be concluded that when solar irradiance is lower than 200
S. E. Chong et al., Vol.9, No.4, December, 2019
value that exceeds 20%. In addition, the analysis also shows that the THD current reaches its best state of 4%-6% when the solar inverter system produces output power of higher than 0.55 of its rated value.
Apart from that, K-Means clustering technique has been applied on the THD current data. The clustering results have been discussed and analysed. Elbow and Silhouette methods were used as the clustering validation method to determine the optimal number of THD current cluster, k in this study. Elbow method defines that k = 4 while Silhouette method determines
k = 2. It has been observed that by defining the number of cluster, k as 4, it could better represent the behaviour of THD current under various solar irradiance level. Hence, this study suggests that the THD values for current can be broadly categorised into four different categories, mainly depends on the level of solar irradiance.
ACKNOWLEDGEMENT
The article processing fees provided by the Universiti Teknikal Malaysia Melaka through JURNAL/2018/FKE/ Q00012 is highly appreciated.
REFERENCES
[1] E. Kabir, P. Kumar, S. Kumar, A. A. Adelodun, and K. H. Kim, “Solar energy: Potential and future prospects,” Renew. Sustain. Energy Rev., vol. 82, no. August 2017, pp. 894–900, 2018.
[2] A. Akgün, S. C. Yılmaz and M. E. Cebeci, "A study on undesired case of unlicensed PV power plants in Turkey with regard to DSO," 2016 IEEE International Conference on Renewable Energy Research and Applications (ICRERA), Birmingham, 2016, pp. 330-334.
[3] F. Katiraei and J. Aguero, “Solar PV Integration Challenges,” IEEE Power Energy Mag., vol. 9, no. 3, pp. 62–71, May 2011.
[4] K. K. Weng, W. Y. Wan, R. K. Rajkumar, and R. K. Rajkumar, “Power Quality Analysis for PV Grid Connected System Using PSCAD / EMTDC,”
International Journal of Renewable Energy Research, vol. 5, no. 1, pp. 121-132, 2015.
[5] Sustainable Energy Development Authority (SEDA), “Procedure for the Testing and Commissioning of Grid- Connected Photovoltaic Systems in Malaysia Inverter Site Tests - PV Plants Connected At Medium Voltage,” 2014.
[6] C. K. Gan, S. R. Mahmoud, K. A. Baharin, M. H. Hairi, and C. K. Gan, “Influence of Single-Phase Solar Photovoltaic Systems on Total Harmonic Distortion : A Case Study,” Indonesian Journal of Electrical Engineering and Computer Science, vol. 12, no. 2, pp.
[7] IEEE, “IEEE Standard for Interconnecting Distributed Resources with Electric Power Systems,” IEEE Std 1547-2003. pp. 1–28, 2003.
[8] D. Motyka, M. Kajanová and P. Braciník, "The Impact of Embedded Generation on Distribution Grid Operation," 2018 7th International Conference on Renewable Energy Research and Applications
(ICRERA), Paris, 2018, pp. 360-364.
[9] G. Chicco, J. Schlabbach, and F. Spertino, “Experimental assessment of the waveform distortion in grid-connected photovoltaic installations,” Sol. Energy, vol. 83, no. 7, pp. 1026–1039, 2009.
[10] G. Chicco, R. Napoli, F. Spertino, I. Elettrica, and P. Torino, “Experimental Evaluation of the Performance of Grid-Connected Photovoltaic Systems,” IEEE MELECON 2004, pp. 4–9, 2004.
[11] M. Ayub, C. K. Gan, A. Fazliana, and A. Kadir, “The Impact of Grid-Connected PV Systems on Harmonic Distortion,” 2014 IEEE Innov. Smart Grid Technol. - Asia (ISGT Asia), pp. 669–674, 2014.
[12] C. Buccella, M.G. Cimoroni, C. Cecati, “Low-Frequency Harmonic Elimination Technique in Cascaded H-Bridges Multilevel Inverters for Renewable Energy Applications,” International
Journal of Smart Grid, vol.3, no. 1, pp. 1-9, 2019. [13] M. Patsalides, A. Stavrou, V. Efthymiou, and G. E.
Georghiou, “Towards the establishment of maximum PV generation limits due to power quality constraints,” Int. J. Electr. Power Energy Syst., vol. 42, no. 1, pp. 285–298, 2012.
[14] R. K. Varma, S. Member, S. Arifur, and R. Member, “Harmonic Impact of a 20-MW PV Solar Farm on a Utility Distribution Network,” IEEE Power Energy Technol. Syst. J., vol. 3, no. 3, pp. 89–98, 2016. [15] I. T. Papaioannou, A. S. Bouhouras, A. G.
Marinopoulos, M. C. Alexiadis, C. S. Demoulias, and D. P. Labridis, “Harmonic impact of small photovoltaic systems connected to the LV distribution network,” in 2008 5th International Conference on the European Electricity Market, EEM, 2008.
[16] J. Schlabbach and L. Kammer, “Prediction of harmonic currents of PV-inverters using measured solar radiation data,” 2006 IEEE Mediterr. Electrotech. Conf., vol. 0, no. 5, pp. 857–860, 2006. [17] M. R. Wani, M. A. Wani and R. Riyaz, "Cluster based
approach for mining patterns to predict wind speed,"
2016 IEEE International Conference on Renewable Energy Research and Applications (ICRERA), Birmingham, 2016, pp. 1046-1050.
S. E. Chong et al., Vol.9, No.4, December, 2019
(INDIACom), New Delhi, 2015, pp. 410-415. [19] M. Yesilbudak, "Clustering analysis of
multidimensional wind speed data using k-means approach," 2016 IEEE International Conference on Renewable Energy Research and Applications
(ICRERA), Birmingham, 2016, pp. 961-965.
[20] K. Manjang, “Identification of customer profiles from electricity consumption data.” M.S Thesis, School of Engineering Science, Computational Engineering, LUT University, 2018. Available: http://urn.fi/URN:NBN:fi-fe2018090434546
[21] S. Satsangi, A. Saini, and A. Saraswat, “Voltage control areas for reactive power management using clustering approach in deregulated power,” Int. Conf. Sustain. Energy Intell. Syst. (SEISCON 2011), vol. 5, no. 3, pp. 409–415, 2011.
[22] A. K. Tanwar, E. Crisostomi, P. Ferraro, M. Raugi, M. Tucci, and G. Giunta, “Clustering analysis of the electrical load in european countries,” Proc. Int. Jt. Conf. Neural Networks, vol. 2015-Sept, 2015. [23] K. Benmouiza and A. Cheknane, “Forecasting hourly
global solar radiation using hybrid k-means and nonlinear autoregressive neural network models,”
Energy Convers. Manag., vol. 75, pp. 561–569, 2013. [24] S. Li, H. Ma, and W. Li, “Typical solar radiation year construction using k-means clustering and discrete-time Markov chain,” Applied Energy, vol. 205, pp. 720–731, 2017.
[25] O. Ozgonenel, D. W. P. Thomas, T. Yalcin, and I. N. Bertizlioglu, “Detection of blackouts by using K-means clustering in a power system,” 11th IET Int. Conf. Dev. Power Syst. Prot. (DPSP 2012), pp. P18– P18, 2012.
[26] N. Amruthnath, “A Research Study on Unsupervised Machine Learning Algorithms for Early Fault Detection in Predictive Maintenance,” 2018 5th Int. Conf. Ind. Eng. Appl., pp. 355–361, 2018.
[27] A. Sayli, A. D. Alkan, and M. Aydın, “Determination of relational classification among hull form parameters and ship motions performance for a set of small vessels,” Brodogradnja, vol. 67, no. 4, pp. 1–15, 2016.
[28] T. M. Kodinariya and P. R. Makwana, “Review on determining number of Cluster in K-Means Clustering,” IJARCSMS, vol. 1, no. 6, pp. 2321–7782, 2013.
[29] F. Wang, H. H. Franco-Penya, J. D. Kelleher, J. Pugh, and R. Ross, “An analysis of the application of simplified silhouette to the evaluation of k-means clustering validity,” Lect. Notes Comput. Sci., vol.10358, pp. 291–305, 2017.
![Table 1 : THD current limitation standard based on IEEE 1547-2003 [7].](https://thumb-us.123doks.com/thumbv2/123dok_us/9703740.2459757/2.892.75.426.402.579/table-thd-current-limitation-standard-based-ieee.webp)