Procedia Engineering 147 ( 2016 ) 602 – 606
1877-7058 © 2016 The Authors. Published by Elsevier Ltd. This is an open access article under the CC BY-NC-ND license (http://creativecommons.org/licenses/by-nc-nd/4.0/).
Peer-review under responsibility of the organizing committee of ISEA 2016 doi: 10.1016/j.proeng.2016.06.247
ScienceDirect
11th conference of the International Sports Engineering Association, ISEA 2016
The instrumented running shoe
Stefan
Schwanitz
a,*,Stephan Odenwald
aaTechnische Universität Chemnitz, Department of Sports Equipment and Technology, Reichenhainer Str. 70, 09126 Chemnitz, Germany
Abstract
The aim of this study was to proof a sensor concept dedicated to overcome severe limitations of laboratory-based research on running footwear. Therefore, the heel part of a commercial running shoe was equipped with five Hall-Effect sensors and the same number of permanent magnets. Due to a specific calibration routine, it was possible to calculate the local deformation of the midsole during heel strike at each of the five positions from the sensor output voltage. The proof of concept was performed by conducting running trials in a laboratory test set-up. The so obtained deformation related variables were correlated to established kinetic and kinematic parameters.
© 2016 The Authors. Published by Elsevier Ltd.
Peer-review under responsibility of the organizing committee of ISEA 2016
* Corresponding author. Tel.: +0-000-000-0000 ; fax: +0-000-000-0000.
E-mail address: [email protected]
Keywords: Hall effect; running; footwear; instrumentation; sports equipment; smart shoe
1.Introduction
“Fish swims, bird flies, man runs.” This quote by the legendary Czech distance runner Emil Zátopek has become the credo of millions of sportsmen. Thus, divers running footwear has been developed by the sporting goods industry for different gender, seasons, grounds, running styles or distances. Typical studies that aim to investigate the biomechanics of running in order to understand the interaction of athletes and equipment are conducted in laboratories. Subjects are requested to perform repeated running trials with a certain running shoe condition. Force platforms, camera systems, accelerometers and other measurement techniques are then applied to obtain kinetic and kinematic variables used to describe each running trial [1]. On the other hand, latest research findings demonstrated that the arithmetic mean of such variables obtained in repeated measures with a low number of replications (n < 10) did not serve as a valid estimator for the true value of a subject. Hence, it was concluded the necessity to explore alternative measurement techniques that might be applied in field-testing in order to obtain objective data of higher number of gait events for each subject [2].
Thus, the aim of this study was to proof a sensor concept dedicated to overcome some of the limitations of laboratory-based running shoe research described before. The basic idea was to enable the investigator to predict laboratory based characteristic parameters of the heel strike (amplitude and timing of the passive vertical ground reaction force peak, peak acceleration at the tibia, kinematics of the ankle) by measuring the deformation of the running shoe midsole during field testing. It was hypothesized that midsole deformation is directly linked to the acting external loads during heel strike.
2.Methods
2.1.Instrumentation
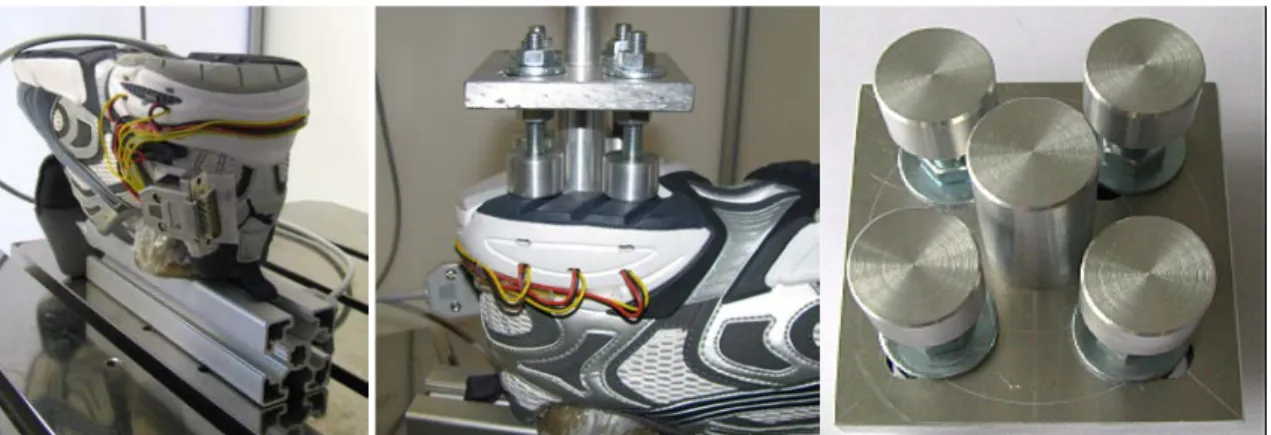
A commercially available running shoe (Puma SE, type Complete Bisley III, size UK 8) was chosen as technical platform and five miniature ratiometric linear sensors (Honeywell Inc., type SS495A) were integrated in the heel part of the right shoe. These sensor elements mainly consist of a Hall effect integrated circuit chip and have a ratiometric output voltage, depending on the supply voltage and the strength of a magnetic field. In a vertical distance of 10 mm to each sensor element, a permanent magnet © 2016 The Authors. Published by Elsevier Ltd. This is an open access article under the CC BY-NC-ND license
(http://creativecommons.org/licenses/by-nc-nd/4.0/).
was integrated into the running shoe’s midsole material (see Fig. 1). Four of the sensors were orientated along a circle with a diameter of 50 mm around the geometric center of the heel part, where the 5th sensor has been placed. Position of each sensor can be described as following:
• Sensor 1: lateral, posterior, • Sensor 2: lateral, anterior, • Sensor 3: central,
• Sensor 4: medial, posterior, • Sensor 5: medial, anterior.
The sensor shoe can be connected by a 9-pin SUB-D plug to any data logging system that is able to provide the support voltage of 5 V and to acquire signal output voltages of 0 V to 5 V.
Application-specific load-deflection measurements [3] performed in a servo-hydraulic testing machine (Zwick Gmbh & Co. KG, type HC 10) before and after the instrumentation process revealed unchanged shock attenuation properties of the shoe.
Fig. 1. The instrumented running shoe: medial (left picture), posterior (center) and lateral (right) perspective.
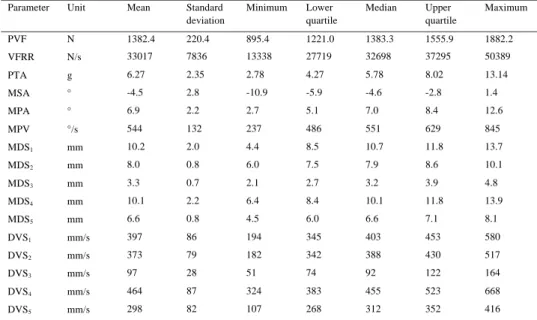
The calibration of each sensor position required to fill the inside space of the shoe with an uncompressible but perfectly fitting material. Therefore, a composite of mineral sand and epoxy resin was poured inside and bonded. Afterwards, the shoe was placed upside-down on the machine base of the same servo-hydraulic testing device mentioned before. By using five individually adjustable stamps, a defined vertical deformation was applied to the instrumented sections of the shoe (see Fig. 2). A data logging system (imc Messsysteme Berlin GmbH, type CS-7008) recorded synchronously the position of the hydraulic actuator and the five sensor outputs. Non-linear regression models were applied to calculate the characteristic curve for each sensor position in order to obtain the transfer function between sensor output and midsole deformation. In theory, magnetic flux density of a permanent magnet changes with its distance. Due to the embedded arrangement of both permanent magnet and Hall effect sensor the relationship of the applied total midsole deformation and the change in the signal output is more complex. Therefore, fifth order polynomial curve fitting functions were used.
2.2. Subjects
Sixteen recreational runners (weight = 71.9 ± 6.5 kg) volunteered in this study. All of them were male, adults and free of any injury of the lower extremities for at least six months. Furthermore, they indicated to wear running shoes in size UK 8.
2.3. Test protocol
Test runs were performed in a motion analysis laboratory. Kinetic data were measured using a force plate (Kistler Instrumente AG, type 9287BA) and a monoaxial accelerometer (Analog Devices Inc, type ADXL78), that was adhered to the tibia. Rearfoot motion was detected by a customized goniometer (MEGATRON Elektronik GmbH & Co. KG, type Megaplast MP10), attached to both the heel counter of the instrumented shoe and the subject’s shank. All data acquisition (ground reaction forces, acceleration, goniometry, midsole deformation) was conducted synchronously with a sampling rate of 1000 Hz. Each subject was asked to perform five runs with a controlled velocity of 3.5 ± 0.1 ms-1.
2.4. Data processing
Each dataset was analyzed in DIAdem 2014 (National Instruments Inc.) regarding the extreme values (amplitude, timing) and rate of change (1st derivative) in order to calculate the established running specific kinetic and kinematic variables and the corresponding local deformations of the running shoe:
• Vertical ground reaction force (PVF: passive peak vertical force; TPVF: time of PVF; VFRR: vertical force rising rate), • Acceleration (PTA: peak tibial acceleration; TPTA: time of PTA),
• Rearfoot motion (MSA: maximum supination angle; TMSA: time of MSA; MPA: maximum pronation angle; TMPA: time of MPA; MPV: maximum pronation velocity),
• Midsole deformation (MDSn: maximum deformation sensor n, TMDSn: time of MDSn; DVSn: deformation velocity sensor n). Statistical data processing was then performed using the software package Past 3.10 [4]. Normal distribution was tested by Kolmogorov-Smirnov test. Correlation between pairs of parameters was calculated using Pearson’s r. Two-sample paired t test were used to investigate statistical significant differences in the deformation parameters at the five sensor positions.
3. Results
All kinematic and kinetic variables (see Table 1 for details) observed in this study are within the typical range reported in similar studies on motion patterns of the human heel strike while running with a comparable velocity [5]. For example, mean passive peak vertical force is in correspondence to approximately twice the runner’s body weight. Midsole deformation at sensor positions 1 and 4, both located in the rear part of the heel, revealed the highest local deformations of around 10 mm. At sensor 3 deformations of only 3.3 mm were detected. At this position, the shoe’s outsole is not in direct contact with the ground, due to the typical horseshoe-like construction of running shoe heel parts. Pairwise comparison of all 10 possible combinations revealed statistically significant differences (p<0.01) in midsole deformations at five positions instead of sensor pair 1 and 4.
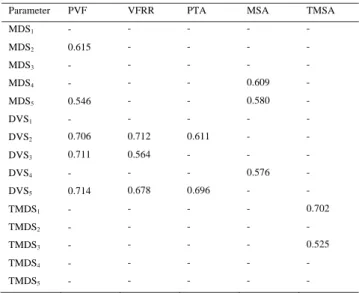
Table 1. Descriptive statistics of selected kinetic, kinematic and deformation variables. Parameter Unit Mean Standard
deviation Minimum Lower quartile Median Upper quartile Maximum PVF N 1382.4 220.4 895.4 1221.0 1383.3 1555.9 1882.2 VFRR N/s 33017 7836 13338 27719 32698 37295 50389 PTA g 6.27 2.35 2.78 4.27 5.78 8.02 13.14 MSA ° -4.5 2.8 -10.9 -5.9 -4.6 -2.8 1.4 MPA ° 6.9 2.2 2.7 5.1 7.0 8.4 12.6 MPV °/s 544 132 237 486 551 629 845 MDS1 mm 10.2 2.0 4.4 8.5 10.7 11.8 13.7 MDS2 mm 8.0 0.8 6.0 7.5 7.9 8.6 10.1 MDS3 mm 3.3 0.7 2.1 2.7 3.2 3.9 4.8 MDS4 mm 10.1 2.2 6.4 8.4 10.1 11.8 13.9 MDS5 mm 6.6 0.8 4.5 6.0 6.6 7.1 8.1 DVS1 mm/s 397 86 194 345 403 453 580 DVS2 mm/s 373 79 182 342 388 430 517 DVS3 mm/s 97 28 51 74 92 122 164 DVS4 mm/s 464 87 324 383 455 523 668 DVS5 mm/s 298 82 107 268 312 352 416
Fig.3 displays the timing for the maximum deformation at all sensor positions in comparison to characteristic time points in vertical ground reaction force, tibia acceleration and rearfoot motion. Obviously, maximum supination angle can be observed as first event during heelstrike, followed by maximum pronation velocity and the maximum deformation at sensor positon 1. Accept of deformation at sensor 5 and maximum pronation angle, only marginal differences of the median timing information of the residual variables can be seen. Variability is highest in the variable time of maximum pronation angle.
Fig. 3: Timing of the most relevant kinetic and kinematic parameters in direct comparison to midsole deformation events.
To proof the hypothesis that midsole deformation is directly linked to the acting external loads and so to strain at the human body during heel strike, Pearson’s r was calculated (see Table 2). As anticipated, there are correlations of moderate (0.5 ≤ r <0.7) or medium ((0.7 ≤ r <0.9) power between the parameters of midsole deformation and some of the typical laboratory-based biomechanical variables of the human heel strike. Interestingly, there are only few systematic connections between the timing variables that were examined in this study. Most correlations were found for the variables that were calculated from the signals of sensor position 5 (medial, anterior).
Table 2. Correlation (Pearson’s r) of deformation and selected kinetic respectively kinematic variables (p<0.01). Parameter PVF VFRR PTA MSA TMSA
MDS1 - - - - - MDS2 0.615 - - - - MDS3 - - - - - MDS4 - - - 0.609 - MDS5 0.546 - - 0.580 - DVS1 - - - - - DVS2 0.706 0.712 0.611 - - DVS3 0.711 0.564 - - - DVS4 - - - 0.576 - DVS5 0.714 0.678 0.696 - - TMDS1 - - - - 0.702 TMDS2 - - - - - TMDS3 - - - - 0.525 TMDS4 - - - - - TMDS5 - - - - -
4. Discussion and Conclusions
Due to viscoelastic material properties, the amount of midsole deformation of running shoes during heel strike is correlated with the forces acting at the interface between the human heel and the ground. On the contrary, it is known that the loads that are required to compress a plastic foam material are dependent on the applied deformation velocity. Both effects can be seen in the data presented in this paper.
In detail, load-deflection curves of running footwear in machine testing showed non-linear material deformation during loading phase [3]. On the other hand, Pearson’s r is a measure for a linear correlation between two variables. Thus, a stronger correlation (r > 0.9) between deformation and vertical ground reaction force based variables obtained in real running tests might not be expected in this context. Furthermore, midsole deformation at the measurement position is not exclusively produced by the vertical ground reaction force component during heel strike. Due to changing orientation of the runner’s foot during touchdown, also horizontal forces will cause deformations. This was not taken into consideration so far.
The correlations between isolated variables of midsole deformation and ankle kinematics are rather poor. In the future it is planned to investigate the compression characteristics of the whole sensor matrix in order to identify parameters that enable the user to predict the ankle kinematics more accurately.
References
[1] Odenwald, S. Test methods in the development of sports equipment. In: The Engineering of Sport 6. Springer New York, 2006, p. 301-306.
[2] Oriwol, D, Milani, TL, & Maiwald, C. Methodological issues associated with the mean value of repeated laboratory running measurements. Footwear Science, 4(3), 2012, p. 183-190.
[3] Schwanitz S, Odenwald S. Long-term Cushioning Properties of Running Shoes (P152). In: Estivalet M, Brisson P, editors. The Engineering of Sport 7. Paris: Springer Paris; 2008, p. 95–100.
[4] Hammer, Ø, Harper, DAT, & Ryan, PD. PAST: Paleontological Statistics Software Package for education and data analysis. Palaeontolia Electronica 4(1), 2001, 9pp.
[5] Heidenfelder, J. Development of a dynamic test procedure to investigate rearfoot cushion properties of running shoes based on biomechanical data. Dissertation. Chemnitz, 2011.