Original article
Solid tumors in patients treated for Hodgkin’s disease:
a report from the German Hodgkin Lymphoma
Study Group
K. Behringer
1*, A. Josting
1, P. Schiller
1, H. T. Eich
2, H. Bredenfeld
1, V. Diehl
1& A. Engert
1 1First Department of Internal Medicine, University Hospital Cologne and the German Hodgkin Lymphoma Study Group (GHSG);2Department of Radiation Oncology, University of Cologne, GermanyReceived 23 November 2003; revised 29 February 2004; accepted 5 March 2004
Background: Long-term survivors of successfully treated Hodgkin’s disease (HD) are at risk for late complications. Among these, secondary solid tumors are most serious because they are often fatal. The aim of this retrospective analysis was to assess the incidence, relative risk and risk factors of secondary solid tumors in HD patients registered in the database of the German Hodgkin Lym-phoma Study Group (GHSG).
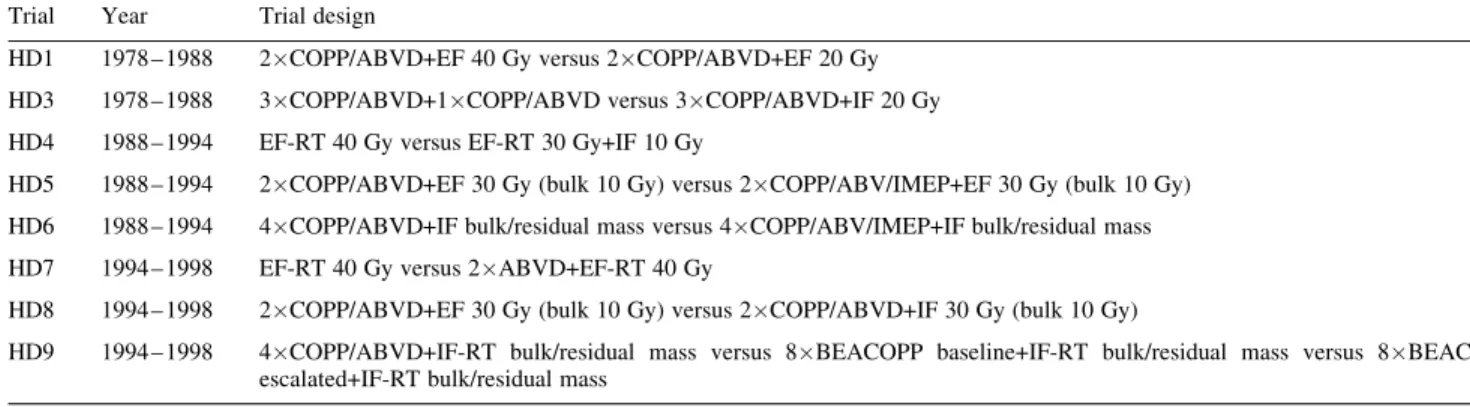
Patients and methods:From 1983 to 1998, the GHSG conducted three generations of clinical trials for early, intermediate and advanced stage HD (HD1 – HD9) involving a total of 5367 patients. Data on incidence, risk factors and relative risk were updated in March 2003.
Results: A total of 127 patients with secondary solid tumors were identified. Among these, lung cancer (23.6%), colorectal cancer (20.5%) and breast cancer (10.2%) were the most frequent. After a median follow-up of 72 months the cumulative risk of developing a solid tumor was 2%, with an overall relative risk (RR) of 2.4 (lung cancer, 3.8; colorectal cancer, 3.2; breast cancer, 1.9). For most patients (n= 67; 52.8%) developing a secondary solid tumor, treatment modality consisted of chemotherapy combined with radiotherapy in extended field technique (RR = 3.3).
Conclusions: With a median follow-up of 72 months, there were 127 patients developing solid tumors out of a total of 5367 HD patients treated in the GHSG studies HD1 – HD9. The cumulative risk of 2% is expected to increase over time due to the rather short median observation time and slow progression of solid malignancies.
Key words:Hodgkin’s lymphoma, risk factors, secondary solid tumors
Introduction
As a consequence of the impressive long-term remission rates in Hodgkin’s disease (HD), the reduction of treatment-related complications is becoming increasingly important for the improvement of long-term survival in this disease. Depending on the stage and risk factor profile, on average, >80% of patients with HD can be cured with first-line treatment [1]. Among treatment-related complications, such as infertility, cardiac, pulmonary or thyroidal dysfunction, secondary malig-nancies represent the leading cause of excess mortality in long-term HD survivors [2, 3]. An increased risk of second cancers has been observed after both chemo- and radiotherapy. The malignancies most frequently observed include acute
myeloid leukemia (AML)/myelodysplastic syndromes (MDS) [4 – 7], non-Hodgkin’s lymphoma (NHL) [8, 9] and solid tumors.
So far, the German Hodgkin Lymphoma Study Group (GHSG) has analyzed their database for secondary non-Hodgkin’s lymphoma (sNHL) [8] and for secondary AML/MDS (sAML/MDS) [7]. The sAML/MDS update in the GHSG database involved 5411 patients treated in the studies HD1 – HD9 from 1978 to 1998. There was an incidence of 1% sAML/MDS after a median observation time of 55 months. Treatment protocols included a variety of treatment options ranging from palliation to allogeneic stem cell transplantation. No difference was observed in overall survival (OS) between patients receiving allogeneic stem cell transplantation and those receiving conventional treatment or palliation. Outcome was very poor: 39 of 46 (85%) patients developing sAML/MDS did not survive >1 year after diagnosis. After 24 months, OS was 8%. The complex karyotype aberration observed in six of 15 patients analyzed does not allow one to link secondary
*Correspondence to: Dr K. Behringer, First Department of Internal Medicine, University Hospital Cologne, Joseph-Stelzmann-Str. 9, 50924 Cologne, Germany. Tel: +49-221-473558; Fax: +49-221-476311; E-mail: karolin.behringer@biometrie.uni-koeln.de
AML/MDS in these patients to one particular cytostatic drug or group of drugs. In addition, 36 of 46 patients had combined modality treatment suggesting that the risk is higher in those patients receiving both chemotherapy and radiotherapy [7].
Analysis of sNHL within the GHSG database showed a 5-year actuarial risk of 0.9% with a median follow up of 46 months. For all patients, the actuarial OS at 2 years was 30%. The outcome was significantly influenced by the time of occurrence after HD. For patients developing sNHL within 3 months of the end of first-line therapy, OS was 20% com-pared with 42% for patients developing their sNHL within 12 months of first treatment [8].
Since solid tumors are the secondary malignancy most often observed after successful treatment for HD, we retrospectively analyzed 5367 patients registered in the database of the German Hodgkin’s Lymphoma Study Group (GHSG) for sec-ondary solid tumors. The aim of the present analysis was to determine incidence, relative risk and risk factors associated with the development of solid tumors in HD.
Patients and methods
Patient selectionFrom 1981 to 1998, 5367 HD patients were enrolled into three generations of clinical trials (HD1 – HD9) and registered in the GHSG database (Table 1). Eligibility criteria were patients between the ages of 16 and 75 years with biopsy-proven HD at diagnosis. Histology of 4025 cases (75%) were reviewed by the GHSG expert pathologists panel. Eligibility criteria before study enrollment included adequate organ function as defined by a creatinine clearance >60 ml/min, serum transaminases <3upper limit of normal and bilirubin >_ 2 ml/dl, left ventricular ejection fraction >_ 0.45, forced expiratory volume in first-second [FEV1] or diffusion capacity of carbon monoxide (DLCO) >60% of predicted, Karnofsky performance score of >60 and WBCs >_ 3500/ml, hemoglobin level >_ 8 g/dl and platelets >
_ 100 000/ml. With the start of the second study generation in 1988, patients were required to test negative for antibodies against the human immunodeficiency virus and to be free of active infection. Consent forms, based on the Institutional Review Board guidelines, were signed by each patient. The analysis for survival data of all patients recorded in the GHSG trial database is based on the analysis of March 2003.
Secondary solid tumors
For patients who developed secondary solid tumors, the following par-ameters were recorded: type of solid tumor, date of diagnosis, age at diag-nosis, time between primary HD and secondary neoplasia, and type of treatment regimen for HD.
Statistics
The cumulative risk of developing secondary solid tumors was assessed according to the Kaplan – Meier method [10]. The time to occurrence of solid tumor was calculated from the date of diagnosis of HD to the date of diagnosis of secondary solid tumor. The incidence of a given solid tumor in HD-treated patients and the incidence in the general population were compared. The relative risks were determined as the ratio of observed (O) and expected (E) number of solid tumors in the study population and 95% confidence limits were calculated. The expected number of solid tumors was calculated based on the listings of the Cancer Registry of Saarland (Germany), 2nd edition. Overall survival (OS) was measured from diagno-sis of solid tumor until death from any cause. OS rates were estimated according to the Kaplan – Meier method [10]. Demographics and disease characteristics were summarized using descriptive statistics, and all stat-istical analyses were performed using SPSS 10.0 for Windows (SPSS, Chicago, IL).
Results
Patient characteristics
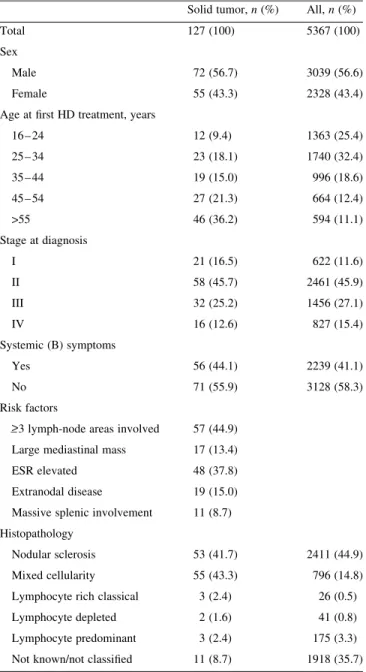
Of 5367 patients registered in the GHSG database, 127 pati-ents with secondary solid tumors were identified (Table 2). Seventy-two (56.7%) were male and 55 (43.3%) female. Most of the patients (n= 58; 45.7%) had stage II disease at first diagnosis, and 56 (44.1%) had B symptoms. The most fre-quent histopathological type was mixed cellularity (43.3%). Primary treatment for HD consisted of radiotherapy alone in 11.0%, chemotherapy alone in 11.8% and combined modality in 77.2% of cases. At the time of HD diagnosis, 36.2% of patients were >55 years of age. When comparing patients who developed solid tumors with all patients included in the analysis, no difference was found in terms of sex, stage or B symptoms at HD diagnosis. However, there were differences
Table 1.GHSG clinical trials between 1981 and 1998 Trial Year Trial design
HD1 1978 – 1988 2COPP/ABVD+EF 40 Gy versus 2COPP/ABVD+EF 20 Gy HD3 1978 – 1988 3COPP/ABVD+1COPP/ABVD versus 3COPP/ABVD+IF 20 Gy HD4 1988 – 1994 EF-RT 40 Gy versus EF-RT 30 Gy+IF 10 Gy
HD5 1988 – 1994 2COPP/ABVD+EF 30 Gy (bulk 10 Gy) versus 2COPP/ABV/IMEP+EF 30 Gy (bulk 10 Gy) HD6 1988 – 1994 4COPP/ABVD+IF bulk/residual mass versus 4COPP/ABV/IMEP+IF bulk/residual mass HD7 1994 – 1998 EF-RT 40 Gy versus 2ABVD+EF-RT 40 Gy
HD8 1994 – 1998 2COPP/ABVD+EF 30 Gy (bulk 10 Gy) versus 2COPP/ABVD+IF 30 Gy (bulk 10 Gy)
HD9 1994 – 1998 4COPP/ABVD+IF-RT bulk/residual mass versus 8BEACOPP baseline+IF-RT bulk/residual mass versus 8BEACOPP escalated+IF-RT bulk/residual mass
ABVD, doxorubicin, vinblastine, bleomycin and dacarbazine; BEACOPP, bleomycin, etoposide, doxorubicin, cyclophosphamide, vincristine, procarbazine and prednisone; COPP, cyclophosphamide, vincristine, procarbazine and prednisone; EF, extended field; GHSG, German Hodgkin Lymphoma Study Group; IF, involved field; RT, radiotherapy.
for age at diagnosis of HD and histopathological subtype: most patients in the solid tumor group (36.2%) were >55 years of age at first treatment, whereas only 594 patients of the whole group of 5367 patients were >55 years of age. Nodular scle-rosis was the most frequently observed histopathological sub-type (n= 2411; 44.9%) in the group of all patients included, while mixed cellularity was most frequent (n= 55; 43.3%) in the group of patients developing a solid tumor (Table 3).
Time of occurrence and relative risk of secondary solid tumors
After a median observation of 72 months, the cumulative risk of developing a solid tumor was 2% [95% confidence interval (CI) 1.6 – 2.4], which increases continuously over time (Figure 1). There were 30 patients with lung cancer (23.6%), 26 patients with gastrointestinal cancer (20.5%) and 13 with breast cancer (10.2%). Several other cancers, such as mela-noma (7.9%), skin (4.7%), thyroid (4.0%), kidney (4.0%), female genitals (4.0%), testes (3.1%), tongue (3.1%), pancreas (2.4%), liver (1.6%) and biliary tract cancer (1.6%) were reported (Table 4). The overall relative risk of developing a solid tumor was 2.4 (95% CI 1.7 – 3.3). For the different enti-ties, the risk was 3.8 for lung cancer (95% CI 1.7 – 8.2), 3.2 for colorectal cancer (95% CI 1.3 – 7.9) and 1.9 for breast cancer (95% CI 0.7 – 4.7) (Table 5).
Relation to first-line treatment modality
Irradiation in ‘extended field’ technique (EF) was adminis-tered to the involved lymph node regions as well as to all ana-tomical and functionally adjacent, but clinically uninvolved, regions. In contrast, the ‘involved field’ (IF) irradiation only included initially involved lymph node areas.
Chemotherapy regimens included a variety of different agents (Table 1) making it difficult to dissect their individual roles in the carcinogenesis of the secondary solid tumor.
Treatment consisting of radiotherapy or chemotherapy alone was rare in the group of patients with solid tumors (RT
Table 2.Number of patients with solid tumors Trial No. of patients
included
No. of patients with solid tumor (%) HD1 180 5 (2.8) HD3 288 15 (5.2) HD4 378 8 (2.1) HD5 975 33 (3.4) HD6 588 11 (1.9) HD7 627 13 (2.1) HD8 1136 28 (2.5) HD9 1195 14 (1.2)
Table 3.Patient characteristics
Solid tumor,n(%) All,n(%)
Total 127 (100) 5367 (100)
Sex
Male 72 (56.7) 3039 (56.6)
Female 55 (43.3) 2328 (43.4)
Age at first HD treatment, years
16 – 24 12 (9.4) 1363 (25.4) 25 – 34 23 (18.1) 1740 (32.4) 35 – 44 19 (15.0) 996 (18.6) 45 – 54 27 (21.3) 664 (12.4) >55 46 (36.2) 594 (11.1) Stage at diagnosis I 21 (16.5) 622 (11.6) II 58 (45.7) 2461 (45.9) III 32 (25.2) 1456 (27.1) IV 16 (12.6) 827 (15.4) Systemic (B) symptoms Yes 56 (44.1) 2239 (41.1) No 71 (55.9) 3128 (58.3) Risk factors >
_ 3 lymph-node areas involved 57 (44.9) Large mediastinal mass 17 (13.4)
ESR elevated 48 (37.8)
Extranodal disease 19 (15.0) Massive splenic involvement 11 (8.7) Histopathology
Nodular sclerosis 53 (41.7) 2411 (44.9) Mixed cellularity 55 (43.3) 796 (14.8) Lymphocyte rich classical 3 (2.4) 26 (0.5) Lymphocyte depleted 2 (1.6) 41 (0.8) Lymphocyte predominant 3 (2.4) 175 (3.3) Not known/not classified 11 (8.7) 1918 (35.7) ESR elevated for patients with B-symptoms >_ 30 mmHg.
ESR elevated for patients without B-symptoms >_ 50 mmHg.
only, 11.0%; CT only, 11.8%) as well as in the group of all other patients included in the analysis (RT only, 12.9%; CT only, 11.8%) (Table 6).
Combined modality was the most commonly used treatment in both groups. A total of 77.2% of patients developing a sec-ondary solid tumor had initial combined-modality treatment. This is very similar to the whole group where 75.4% were treated with combined modality. However, most patients
(n= 67; 52.8%) developing a solid tumor had received irradiation in extended field technique (EF), whereas only 39.1% in the group of all patients had EF irradiation.
The RR of developing a solid tumor was 3.3 (95% CI 2.4 – 4.4) for patients with combined-modality treatment with irradiation in EF technique, 2.4 (95% CI 1.7 – 3.3) for those treated with chemotherapy alone, 2.1 (95% CI 1.5 – 2.8) for radiotherapy alone and 1.6 (95% CI 1.1 – 2.3) for combined treatment with local radiotherapy.
There were seven patients with relapse and salvage therapy before the occurrence of secondary neoplasia.
Relation to first-line treatment modality by type of solid tumor
For patients who developed lung, colorectal and breast can-cers, the combination of chemotherapy and radiotherapy was also the most commonly used treatment modality (Table 7). Within these groups, most of the patients developing second-ary breast (n= 7; 53.8%) or colorectal cancer (n= 11; 57.9%) had received radiotherapy in EF technique. There was no difference for patients with secondary lung cancer concerning treatment with EF irradiation or local radio-therapy (40.0% in each group). Interestingly, all those patients developing secondary breast cancer had been treated with radiotherapy involving EF technique (n= 7), IF (n= 4) or radiotherapy alone (n= 2).
Solid tumors within or adjacent to the initial irradiation field
In four of 13 secondary breast cancer, 12 of 30 secondary lung cancer and four of five secondary thyroid carcinoma patients, the secondary solid tumor developed within the initial irradiation field (Table 8).
Relation to age
Table 9 lists the occurrence of selected solid tumors according to age at treatment of HD. More than half of all patients with secondary solid tumors (57.5%) were aged >_ 45 years at first diagnosis of HD. Interestingly, the age >_ 45 years at first treat-ment for secondary lung cancer (66.7%) and gastrointestinal
Table 5.Relative risk (RR) for the development of SC after HD treatment
Observed Expected RR (O/E) 95%CI
Lung cancer 30 8 3.8 1.7 – 8.2
Colon cancer 19 6 3.2 1.3 – 7.9
Breast cancer 13 7 1.9 0.7 – 4.7
Total 127 53 2.4 1.7 – 3.3
HD, Hodgkin’s disease; SC, secondary cancer. Table 4.Incidence by type of secondary cancer
Secondary cancer Cases,n(%)
Lung cancer 30 (23.6)
Gastrointestinal cancer 26 (20.5)
Breast cancer 13 (10.2)
Melanoma 10 (7.9)
Skin cancer (except melanoma) 6 (4.7)
Thyroid 5 (4.0) Kidney 5 (4.0) Female genitals 5 (4.0) Testes 4 (3.1) Tongue 4 (3.1) Pancreas 3 (2.4) Liver 2 (1.6) Biliary tract 2 (1.6)
Carcinoma of unknown primary 2 (1.6)
Others 10 (7.9)
Total 127 (100.0)
Table 6.Treatment modality (solid tumors and all HD patients included in the analysis)
Treatment modality RT only,n(%) CT+RT EF,n(%) CT+RT local IF,n(%) CT only,n(%) All,n(%)
Solid tumors 14 (11.0)a 67 (52.8)b 31 (24.4)c 15 (11.8)d 127 (100)
All patientse 675 (12.9) 2047 (39.1) 1900 (36.3) 618 (11.8) 5240 (100)
RR 2.1 3.3 1.6 2.4 2.4
95% CI 1.5 – 2.8 2.4 – 4.4 1.1 – 2.3 1.7 – 3.3 1.7 – 3.3
a
One patient with relapse before occurrence of SC.
b
One patient with relapse before occurrence of SC.
c
Three patients with relapse before occurrence of SC.
dTwo patients with relapse before occurrence of SC. e
All patients included in the analysis, except those developing a solid tumor.
cancer (96.2%) was significantly higher as compared with the average age of patients treated. In contrast, most patients (n= 8; 61.6%) who developed secondary breast cancer were between 16 and 34 years at diagnosis/treatment of HD. In addition, all five patients developing a secondary thyroid can-cer were of young age when initially treated (16, 22, 25, 26 and 26 years of age; data not shown). Very similar findings were observed when age at diagnosis of the solid tumor was compared. Age at diagnosis of the most frequent solid tumors is shown in Table 10. Only a very few patients with secondary lung or gastrointestinal cancers were diagnosed before the age of 45 years. In contrast, patients developing secondary breast cancer were mostly aged <34 years at diagnosis of solid tumor (n= 7; 53.8%).
Outcome of secondary solid tumors
The median OS after diagnosis of a solid tumor was 31 months (Figure 2). Prognosis was poor for patients who devel-oped secondary lung cancer, 70% died within 21 months from diagnosis of secondary cancer (Table 11).
Discussion
From this analysis the following findings have emerged. After a median follow-up of 72 months, the cumulative risk of developing a secondary solid tumor in HD patients, according to the GHSG database, is low (2%). With a longer observation time, a more exact estimation of the cumulative risk will be possible, since the carcinogenesis of solid tumors has been demonstrated to be significantly slower than that of secondary haematological malignancies.
Lung cancer (RR 3.8), colorectal cancer (RR 3.2) and breast cancer (RR 1.9) were most frequently observed.
A considerable number of patients (52.8%) in the solid tumor group were treated with irradiation in EF technique (RR 3.3). For patients treated with a combination of che-motherapy and irradiation restricted to local fields (24.4%), RR was 1.6. These data need to be interpreted carefully due to the fact that extended field irradiation represents the older standard treatment. Consequently, observation time for patients treated with this modality is longer than for patients treated with involved field irradiation.
Several reports document the incidence of secondary solid tumors after primary HD. The cumulative risk varies between 7.8% and 23.3% at 15 to 25 years, respectively, after first-line treatment [4, 5, 11 – 14]. An increased overall RR ranges from 2.0 to 6.1 [11 – 13]. The comparatively low cumulative risk found in our analysis may be due in part to the fact that the median follow-up was only 72 months.
The comprehensive list of risk factors for the development of solid tumors after HD is difficult to determine. Disease-related immunosuppression, genetic factors, first-line treat-ment, age at first treattreat-ment, vulnerability of breast tissue, hormonal factors, chemotherapy-induced premature meno-pause, and smoking have been shown to play a role. In the literature, solid tumors are frequently related to radiotherapy as well as to combined modality treatment [11, 15, 16], and they often appear in or adjacent to the initial irradiation field [16 – 20]. This is particularly true for the development of breast cancer, where chemotherapy seems to have a protective effect [12, 19]. Most patients receiving radiotherapy as part of their treatment for HD are at higher risk of developing second-ary breast cancer [11 – 13, 19]. Van Leeuwen et al. [19] found a chemotherapy-associated risk reduction on the development
Table 8.Solid tumors within or adjacent to the initial irradiation field Tumor entity Location within the initial irradiation field
Probable Not probable Unknown
Breast 4 3 6
Lung 12 6 12
Thyroid 4 1 0
Table 7.Treatment modality by type of SC Treatment modality Lung, n(%) Breast, n(%) GI (colon), n(%) Other SC CT only 4 (13.3) 0 4 (21.1) 7 (10.8) RT only 2 (6.7) 2 (15.4) 2 (10.5) 8 (12.3) CT+RT EF 12 (40.0) 7 (53.8) 11 (57.9) 37 (56.9) CT+RT local 12 (40.0) 4 (30.8) 2(10.5) 13 (20.0) All 30 (100) 13 (100) 19 (100) 65 (100) CT, chemotherapy; EF, extended field; GI, gastrointestinal; SC, secondary cancer; RT, radiotherapy.
Table 9.SC by age at first treatment Age at HD diagnosis, years Lung, % Breast, % Gastrointestinal, % Others, % Total, % 16 – 24 0 30.8 0 13.8 9.4 25 – 34 13.3 30.8 3.8 24.1 18.1 35 – 44 20.0 15.4 0 19 15.0 45 – 54 30.0 7.7 30.8 15.5 21.3 >55 36.7 15.4 65.4 27.6 36.2 Total 100 100 100 100 100
HD, Hodgkin’s disease; SC, secondary cancer.
Table 10.SC by age at diagnosis
Age at diagnosis, years Lung, % Breast, % Gastrointestinal, %
16 – 24 0 7.7 0 25 – 34 0 46.2 3.8 35 – 44 16.7 23.1 0 45 – 54 36.7 7.7 15.4 >55 46.7 15.4 80.8 Total 100 100 100 SC, secondary cancer.
of secondary breast cancer. This observation might be related to chemotherapy-induced ovarian failure preventing ovarian hormones promoting tumorigenesis.
The role of specific chemotherapeutics in the etiology of solid tumors is unclear. The data found in previous studies concerning treatment modality do not allow for unanimous conclusions. Some studies report on an increased risk after chemotherapy alone [21, 22] whereas others found no relation to chemotherapeutic treatment [4, 5, 12, 16, 18, 23]. These discrepancies are probably related to the variety of different tumor entities. Some authors report an increased risk for the development of lung cancer after chemotherapy alone [12, 20]. In other studies, the highest RRs for development of solid tumors were observed after combined-modality treatment [13, 18, 24]. Swerdlow et al. found a significantly increased risk for the development of secondary gastrointestinal tumors only in patients who had received combined-modality treat-ment [12]. Several authors report on an increased RR of developing secondary solid tumors with younger age at first treatment [11 – 14, 16]. This is most obvious in female patients who develop breast cancer [11, 17, 24 – 26]. Early onset of menopause seems to reduce the risk of breast cancer [19]. Thus, mammography is recommended for female HD patients between 8 [27, 28] and 10 years [29] after first-line treatment.
In many studies, treatment-related solid tumors appear several years after first-line treatment and the risk remains elevated over a 15- and 20-year follow-up period [2, 11 – 14, 16 – 18, 24, 25, 27]. The increased risk remains higher than expected for up to 30 years [2, 3].
This led to speculation that solid tumors in particular are at least in part irradiation-induced late toxicities. In contrast, Travis et al. reported an increased risk of secondary lung cancer as early as 1 – 4 years after first-line treatment when patients received alkylating agents [30].
In general, the outcome of secondary solid tumors depends on tumor entity and is not different from that of primary solid tumors [27]. The outcome in secondary lung cancer is as poor as it is in primary lung cancer [17, 24, 30]. Very similar findings were observed in the present study.
In conclusion, the cumulative risk of secondary solid tumors in the GHSG trials HD1 – HD9, involving 5367 patients and a median observation time of 72 months, is low (2%). Longer follow-up is needed to assess the final risk.
Acknowledgements
This work was supported in part by the Deutsche Krebshilfe, the Bundesministerium fu¨r Bildung und Forschung (BMBF) and the Kompetenznetz Maligne Lymphome.
References
1. Rosenberg S. The management of Hodgkin’s disease: half a century of change. The Kaplan memorial lecture. Ann Oncol 1996; 7: 555 – 560.
2. Ng AK, Bernardo MP, Weller E et al. Long-term survival and competing causes of death in patients with early-stage Hodgkin’s disease treated at age 50 or younger. J Clin Oncol 2002; 20: 2101 – 2108.
3. Aleman BM, van den Belt-Dusebout AW, Klokman WJ et al. Long-term cause-specific mortality of patients treated for Hodgkin’s disease. J Clin Oncol 2003; 21: 3431 – 3439.
4. Henry-Amar M. Second cancer after the treatment for Hodgkin’s dis-ease: a report from the International Database on Hodgkin’s Disease. Ann Oncol 1992; 3(Suppl 4): 117 – 128.
5. Tucker M, Coleman C, Cox R. Risk of second cancers after treatment for Hodgkin’s disease. N Engl J Med 1988; 318: 76 – 81.
6. van Leeuwen FE, Chorus AM, van den Belt-Dusebout AW et al. Leu-kemia risk following Hodgkin’s disease: relation to cumulative dose of alkylating agents, treatment with teniposide combinations, number of episodes of chemotherapy, and bone marrow damage. J Clin Oncol 1994; 12: 1063 – 1073.
7. Josting A, Wiedenmann S, Franklin J et al. Secondary myeloid leuke-mia and myelodysplastic syndromes in patients treated for Hodgkin’s disease: a report from the German Hodgkin’s Lymphoma Study Group. J Clin Oncol 2003; 21: 3440 – 3446.
8. Rueffer U, Josting A, Franklin J et al. Non-Hodgkin’s lymphoma after primary Hodgkin’s disease in the German Hodgkin’s Lymphoma Study Group: incidence, treatment, and prognosis. J Clin Oncol 2001; 19: 2026 – 2032.
9. Enrici R, Anselmo A, Iacari V et al. The risk of non-Hodgkin’s lymphoma after Hodgkin’s disease, with special reference to splenic treatment. Haematologica. 1998; 83: 636 – 644.
Table 11.Prognosis of patients with SCs Tumor entity No. of patients
who died from SC
Total No. of SC % Lung 21 30 70 Gastrointestinal 12 26 46.2 Breast 1 13 7.7 Others 12 58 20.7 All 46 127 36.2 SC, secondary cancer.
10. Kaplan E, Meier P. Nonparametric estimation from incomplete obser-vations. J Am Stat Assoc 1958; 34: 457 – 464.
11. van Leeuwen FE, Klokman WJ, Veer MB et al. Long-term risk of second malignancy in survivors of Hodgkin’s disease treated during adolescence or young adulthood. J Clin Oncol 2000; 18: 487 – 497. 12. Swerdlow AJ, Barber JA, Hudson GV et al. Risk of second
malig-nancy after Hodgkin’s disease in a collaborative British cohort: the relation to age at treatment. J Clin Oncol 2000; 18: 498 – 509. 13. Dores GM, Metayer C, Curtis RE et al. Second malignant
neo-plasms among long-term survivors of Hodgkin’s disease: a popu-lation-based evaluation over 25 years. J Clin Oncol 2002; 20: 3484 – 3494.
14. Metayer C, Lynch CF, Clarke EA et al. Second cancers among long-term survivors of Hodgkin’s disease diagnosed in childhood and adolescence. J Clin Oncol 2000; 18: 2435 – 2443.
15. Green DM, Hyland A, Barcos MP et al. Second malignant neoplasms after treatment for Hodgkin’s disease in childhood or adolescence. J Clin Oncol 2000; 18: 1492 – 1499.
16. Foss Abrahamsen A, Andersen A, Nome O et al. Long-term risk of second malignancy after treatment of Hodgkin’s disease: the influence of treatment, age and follow-up time. Ann Oncol 2002; 13: 1786 – 1791.
17. Munker R, Grutzner S, Hiller E et al. Second malignancies after Hodgkin’s disease: the Munich experience. Ann Hematol 1999; 78: 544 – 554.
18. Bhatia S, Robison L, Oberlin O et al. Breast cancer and other second neoplasms after childhood Hodgkin’s disease. N Engl J Med 1996; 334: 745 – 751[see comments].
19. van Leeuwen FE, Klokman WJ, Stovall M et al. Roles of radiation dose, chemotherapy, and hormonal factors in breast cancer following Hodgkin’s disease. J Natl Cancer Inst 2003; 95: 971 – 980.
20. Hancock S, Tucker M, Hoppe R. Breast cancer after treatment of Hodgkin’s disease. J Natl Cancer Inst 1993; 85: 25 – 31.
21. Kaldor J, Day N, Bell J et al. Lung cancer following Hodgkin’s disease: a case – control study. Int J Cancer 1992; 52: 677 – 681. 22. Swerdlow A, Douglas A, Hudson G et al. Risk of second primary
cancers after Hodgkin’s disease by type of treatment: analysis of 2846 patients in the British National Lymphoma Investigation. Br Med J 1992; 304: 1137 – 1143.
23. van Leeuwen FE, Klokman WJ, Hagenbeek A et al. Second cancer risk following Hodgkin’s disease: a 20-year follow-up study. J Clin Oncol 1994; 12: 312 – 325.
24. Ng AK, Bernardo MV, Weller E et al. Second malignancy after Hodg-kin’s disease treated with radiation therapy with or without chemother-apy: long-term risks and risk factors. Blood 2002; 100: 1989 – 1996. 25. Cutuli B, Dhermain F, Borel C et al. Breast cancer in patients treated
for Hodgkin’s disease: clinical and pathological analysis of 76 cases in 63 patients. Eur J Cancer 1997; 33: 2315 – 2320.
26. Mauch P, Kalish L, Marcus K et al. Second malignancies after treat-ment for laparotomy staged IA – IIIB Hodgkin’s disease: long-term analysis of risk factors and outcome. Blood 1996; 87: 3625 – 3632. 27. Yahalom J, Petrek J, Biddinger P et al. Breast cancer in patients irradiated
for Hodgkin’s disease: a clinical and pathologic analysis of 45 events in 37 patients. J Clin Oncol 1992; 10: 1674–1681[see comments]. 28. Goss P, Sierra S. Current perspectives on radiation-induced breast
cancer. J Clin Oncol 1998; 16: 338 – 347[see comments].
29. Shapiro C, Mauch P. Radiation-associated breast cancer after Hodg-kin’s disease: risks and screening in perspective. J Clin Oncol 1992; 10: 1662 – 1665[editorial; comment].
30. Travis LB, Gospodarowicz M, Curtis RE et al. Lung cancer following chemotherapy and radiotherapy for Hodgkin’s disease. J Natl Cancer Inst 2002; 94: 182 – 192.