Optimal vs naïve diversification in
cryptocurrencies
Article
Accepted Version Creative Commons: AttributionNoncommercialNo Derivative Works 4.0Platanakis, E., Sutcliffe, C. and Urquhart, A. (2018) Optimal vs
naïve diversification in cryptocurrencies. Economics Letters,
171. pp. 9396. ISSN 01651765 doi:
https://doi.org/10.1016/j.econlet.2018.07.020 Available at
http://centaur.reading.ac.uk/78105/
It is advisable to refer to the publisher’s version if you intend to cite from the work. See Guidance on citing . To link to this article DOI: http://dx.doi.org/10.1016/j.econlet.2018.07.020 Publisher: Elsevier All outputs in CentAUR are protected by Intellectual Property Rights law, including copyright law. Copyright and IPR is retained by the creators or other copyright holders. Terms and conditions for use of this material are defined in the End User Agreement .www.reading.ac.uk/centaur
CentAUR
Optimal vs Naïve Diversification in Cryptocurrencies
Abstract
This paper contributes to the literature on cryptocurrencies by examining the performance of naïve (1/N) and optimal (Markowitz) diversification in a portfolio of four popular cryptocurrencies. We employ weekly data with weekly rebalancing and show there is very little to select between naïve diversification and optimal diversification. Our results hold for different levels of risk-aversion and an alternative estimation window.
1. Introduction
Since the seminal work by Nobel Prize winner Harry Markowitz on mean-variance portfolio construction, a large literature has examined whether this method of optimal diversification outperforms naïve diversification. Black and Litterman (1992) and Kan and Zhou (2007) show that mean-variance struggles with estimation errors in the parameters of the model, while DeMiguel et al (2009) show that employing estimated means and variances performs worse than a naïve strategy of simply holding equal positions in every asset (1/N). However recently, Ackermann et al (2017) show that mean-variance analysis does outperform the naïve 1/N strategy in currency markets, since interest rates provide a predictor of future returns that are free of estimation error.
We add to the debate by examining the performance of optimal and naïve diversification in cryptocurrency markets. Cryptocurrencies have attracted a lot of attention from investors, regulators and the media since the first cryptocurrency, Bitcoin, was proposed by Nakamoto (2008). For example, from December 2016 to December 2017 the price of Bitcoin grew by 1300%, while the total market capitalization of all cryptocurrencies was over $230 billion in December 2017. Given this surge of interest, there has consequently been a stream of literature examining the properties of cryptocurrencies, documenting bubbles in Bitcoin (Cheah and Fry 2015; Corbet et al 2017), the market efficiency of Bitcoin (Urquhart 2016; Nadarajah and Chu 2017; Tiwari et al 2017; Khuntia and Pattanayak 2018), the hedging and diversification benefits of Bitcoin (Bouri et al 2017a; Corbet et al 2018a), the unique features of cryptocurrencies (Gkillas and Katsiampa 2018; Phillip et al 2018), the relationship between transaction activity and Bitcoin returns (Koutmos 2018) and price clustering within Bitcoin prices (Urquhart 2017).1
Given the huge surge of interest by investors in cryptocurrencies, this is the first paper to examine whether forming a portfolio of the four main cryptocurrencies is worthwhile, and whether optimal or naïve diversification generates better performance for investors. Cryptocurrencies have been shown to be held by investors as speculative assets (Baur et al
2018), rather than used as a medium of exchange. Therefore, investors hold portfolios of cryptocurrencies, and we examine whether naïve or optimal diversification produces the best performance for investors. We find very little difference in terms of expected returns, Sharpe ratio and Omega ratio between naïve diversification and optimal diversification indicating that the gain from optimal diversification is more than offset by estimation error, consistent with the findings of DeMiguel et al (2009) for equities.
2. Data and Methodology
We collected weekly data on the four most liquid and long-standing cryptocurrencies, namely Bitcoin, Litecoin, Ripple and Dash from www.coinmarketcap.com over the period 21st
February 2014 to 26th January 2018.2 We also collected the risk-free rate the Kenneth French
database.3 Descriptive statistics of the simple returns on the four cryptocurrencies in this
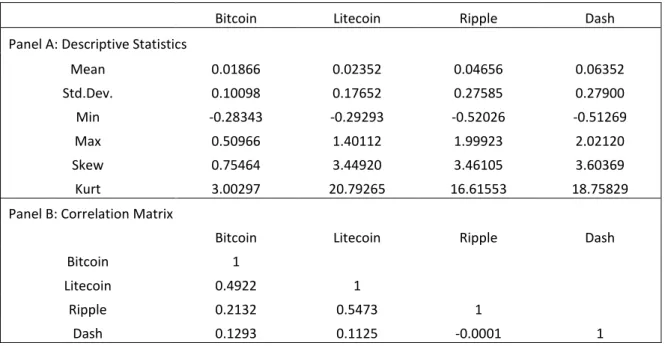
study are reported in Table 1. Dash has the highest mean return and standard deviation, while Bitcoin has the smallest mean return and standard deviation. Bitcoin has slight positive skewness and a normal distribution (according to the kurtosis), while the other cryptocurrencies exhibit strong positive skewness and excess kurtosis, indicating a leptokurtic distribution. Panel B of Table 1 reports the correlation matrix between the cryptocurrencies. We find that most pairs are positively correlated, with a correlation coefficient between 0.1125 and 0.5473, while Ripple and Dash have a negative correlation of -0.0001. Therefore, since the correlation between these cryptocurrencies is not highly positive, it is plausible that investing in a portfolio of cryptocurrencies provides meaningful diversification benefits.
2A. Mean-Variance Portfolio Optimization (Optimal Diversification)
Investors optimize the trade-off between the mean and variance of returns in the mean-variance portfolio optimization model of Markowitz (1952). We estimate the vector of portfolio weights (decision variables), denoted by x, by maximizing the following quadratic utility function with respect to the vector of asset weights
x :-
2 The sample period start date is determined by the available of data for all four cryptocurrencies. 3 Available at http://mba.tuck.dartmouth.edu/pages/faculty/ken.french/data_library.html.
T λ T . 2
U x μ - x x (1)
We use sample (historical) estimates for the mean
μ and covariance matrix
, while the parameter λ denotes the investor’s risk aversion. We additionally impose non-short selling constraints, as well as normalization of the portfolio weights. Hence, the optimization problem for the mean-variance diversification can be described as follows:T T 1 λ 2 . . x 0, x 1 i N i i max s t i
x x μ - x x (2)2B. Equally Weighted Portfolio (Naïve Diversification)
A portfolio weight of 1/N is assigned to each asset in our portfolio, and we use 1/N with re-balancing as in DeMiguel et al (2009), e.g. x 1
N
i i. Hence, the asset weights are independent of the value of λ.
2C. Performance Metrics
The Sharpe ratio (Sharpe 1966), which is a standard metric for measuring risk-adjusted performance, is defined as the average excess return above the risk-free rate per unit of risk (standard deviation) and is computed as follows:-
, p f p R R SR (3)
where Rp Rf is the average portfolio return in excess of the risk-free rate computed over the entire out-of-sample period, and p represents the portfolio standard deviation estimated over the same out-of-sample period.
However, the Sharpe ratio has its limitations since it depends on only the first two moments, (see, for instance, the discussion in Oikonomou el al., 2018; Platanakis and Sutcliffe, 2017b; and Platanakis et al., 2017a, for alternative performance metrics). For this reason we also use the Omega ratio (Shadwick and Keating, 2002) as an additional risk-adjusted measure. The Omega ratio is also known as the gain-loss ratio since it is defined as the ratio of the average gain to the average loss, and is computed as follows:-
T , 1 T , 1 1 max 0, T . 1 max 0, T p t t p t t R Omega R
(4)The main advantage of the Omega ratio is that it does not require any assumption about the underlying distribution of returns.
2D. Transaction Costs
When examining any investment strategy transaction costs are vital since any profit gained may be extinguished by the inclusion of appropriate transaction costs. Therefore we include transaction costs of 50 basis points for all cryptocurrencies, consistent with Lintilhac and Tourin (2017). We incorporate transaction costs by subtracting the total transaction costs from the portfolio returns. Total transaction costs
TCt
at time t are computed as follows:-
, , 1
1 TC T x x , N t i i t i t i
(16)where xi t, 1 denotes the weight of the ith asset at the end of the period t-1, and T
i is the
proportionate transaction cost of trading the ith cryptocurrency.
3. Empirical Results
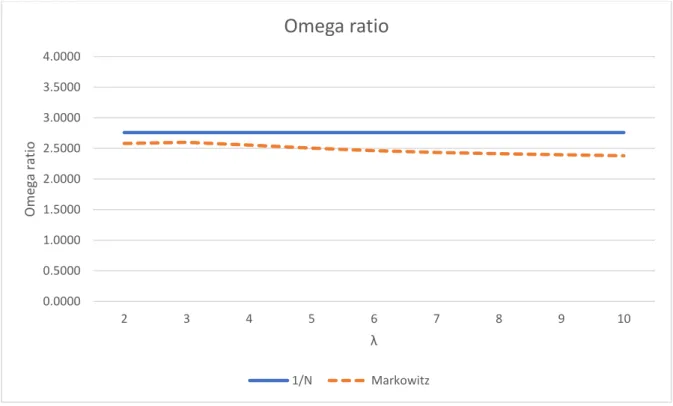
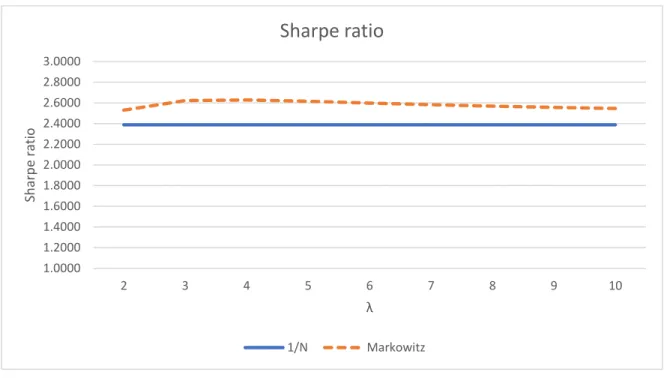
Figures 1 and 2 report the Sharpe and Omega ratios respectively for a 26-week expanding estimation window, rebalanced every week. The difference between naïve diversification
(1/N) and optimal diversification (Markowitz) is very small and statistically insignificant, indicating that there is very little to select between these two methods of diversification. These figures also show that risk-adjusted performance is insensitive to λ. To add robustness to our findings, Figures 3 and 4 report the re-estimation of our models with a 52-week expanding window, rather than a 26-week expanding window. These results are consistent with those for a 26-week expanding window.
4. Conclusions
We add to the literature on cryptocurrencies and portfolio management by examining the performance of naïve diversification (1/N) and optimal diversification (Markowitz) in the context of a portfolio consisting of four popular cryptocurrencies. We find very little difference in performance between the two construction techniques, supporting the findings of DeMiguel et al (2009) that naïve diversification is as good, if not better, than optimal diversification.
Tables
Table 1: Descriptive statistics of the returns of the cryptocurrencies employed in this study, and their correlation
matrix.
Bitcoin Litecoin Ripple Dash
Panel A: Descriptive Statistics
Mean 0.01866 0.02352 0.04656 0.06352 Std.Dev. 0.10098 0.17652 0.27585 0.27900 Min -0.28343 -0.29293 -0.52026 -0.51269 Max 0.50966 1.40112 1.99923 2.02120 Skew 0.75464 3.44920 3.46105 3.60369 Kurt 3.00297 20.79265 16.61553 18.75829
Panel B: Correlation Matrix
Bitcoin Litecoin Ripple Dash
Bitcoin 1
Litecoin 0.4922 1
Ripple 0.2132 0.5473 1
Figures
Figure 1: The Sharpe ratio of the naïve diversification (1/N) and optimal diversification (Markowitz) portfolios at
different levels of risk-aversion, inclusive of transaction costs, for a 26-week expanding window.
Figure 2: The Omega ratio of the naïve diversification (1/N) and optimal diversification (Markowitz) portfolios at
different levels of risk-aversion, inclusive of transaction costs, for a 26-week expanding window.
1.0000 1.2000 1.4000 1.6000 1.8000 2.0000 2.2000 2.4000 2.6000 2.8000 3.0000 2 3 4 5 6 7 8 9 10 Sh ar p e r at io λ
Sharpe ratio
1/N Markowitz 0.0000 0.5000 1.0000 1.5000 2.0000 2.5000 3.0000 3.5000 4.0000 2 3 4 5 6 7 8 9 10 Om ega ra tio λOmega ratio
1/N MarkowitzFigure 3: The Sharpe ratio of the naïve diversification (1/N) and optimal diversification (Markowitz) portfolios at
different levels of risk-aversion, inclusive of transaction costs, for a 52-week expanding window.
Figure 4: The Omega ratio of the naïve diversification (1/N) and optimal diversification (Markowitz) portfolios at
different levels of risk-aversion, inclusive of transaction costs, for a 52-week expanding window.
1.0000 1.2000 1.4000 1.6000 1.8000 2.0000 2.2000 2.4000 2.6000 2.8000 3.0000 2 3 4 5 6 7 8 9 10 Sh ar p e r at io λ
Sharpe ratio
1/N Markowitz 0.0000 0.5000 1.0000 1.5000 2.0000 2.5000 3.0000 3.5000 4.0000 2 3 4 5 6 7 8 9 10 Om ega ra tio λOmega ratio
1/N MarkowitzReferences
Ackermann, F., Pohl, W. & Schmedders, K. (2017). Optimal and naive diversification in currency markets. Management Science, 63, 3347-3360.
Baur, D. G., Hong, K., Lee, A. D. (2018). Bitcoin: Medium of exchange or speculative assets? Journal of
International Financial Markets, Institutions and Money, forthcoming.
Black, F. and Litterman, R. (1992). Global Portfolio Optimization. Financial Analysts Journal, 48, 28-43. Bouri, E., P. Molnár, G. Azzi, D. Roubaud, and L. I. Hagfors (2017). On the hedge and safe haven properties of bitcoin: Is it really more than a diversifier? Finance Research Letters, 20, 192– 198.
Cheah, E.-T. and J. Fry (2015). Speculative bubbles in bitcoin markets? an empirical investigation into the fundamental value of bitcoin. Economics Letters, 130, 32–36.
Corbet, S., B. Lucey, and L. Yarovaya (2017). Datestamping the Bitcoin and Ethereum bubbles. Finance
Research Letters, forthcoming.
Corbet, S., C. Larkin, B. Lucey, A. Meegan, and L. Yarovaya (2018a). Exploring the dynamic relationships between cryptocurrencies and other financial assets. Economics Letters, 165(1), 28–34. Corbet, S., B. Lucey, A. Urquhart and L. Yarovaya (2018b). Cryptocurrencies as a Financial Asset: A
systematic analysis. Available at SSRN: https://ssrn.com/abstract=3143122.
DeMiguel, V., Garlappi, L. and Uppal, R. (2009). Optimal Versus Naive Diversification: How Inefficient is the 1/N Portfolio Strategy? Review of Financial Studies, 22, 1915-1953. Gkillas, K. and Katsiampa, P. (2018) An application of extreme value theory to cryptocurrencies.
Economics Letters, 164, 109-111.
Kan, R., Zhou, G. (2007). Optimal Portfolio Choice with Parameter Uncertainty. Journal of Financial
and Quantitative Analysis, 42, 621-656.
Khuntia, S. and Pattanayak, J. K. (2018). Adaptive market hypothesis and evolving predictability of bitcoin. Economics Letters, 167, 26-28.
Koutmos, D. (2018). Bitcoin returns and transaction activity. Economics Letters, 167, 81-85.
Lintilhac, P. S., Tourin, A. (2017). Model-based pairs trading in the bitcoin market. Quantitative
Finance, 17(5), 703-716.
Markowitz, H. (1952). Portfolio Selection. The Journal of Finance, 7, 77-91.
Nadarajah, S. and J. Chu (2017). On the inefficiency of bitcoin. Economics Letters 150, 6–9.
Nakamoto, S. (2008). Bitcoin: A peer-to-peer electronic cash system. Available at https://Bitcoin.org/Bitcoin.pdf"
Oikonomou, I., Platanakis, E. and Sutcliffe, C. (2018). Socially Responsible Investment Portfolios: Does the Optimization Process Matter? The British Accounting Review, forthcoming.
Phillip, A., J. Chan, and S. Peiris (2018). A new look at cryptocurrencies. Economics Letters, 163, 6–9. Platanakis, E., Sakkas, A., Sutcliffe, C. (2017a) Harmful Diversification: Evidence from Alternative
Investments, ICMA Centre Discussion Paper Number: ICM-2017-09. Available at SSRN: https://ssrn.com/abstract=2911212.
Platanakis, E., Sutcliffe, C. (2017b) Asset-Liability Modelling and Pension Schemes: The Application of Robust Optimization to USS. The European Journal of Finance, 23, 324-352.
Shadwick, W.F., Keating, C. (2002). A Universal Performance Measure. Journal of Performance
Measurement, 6, 59-84
Sharpe, W. F. (1966). Mutual fund performance. Journal of Business, 39, 119-138.
Tiwari, A. K., R. Jana, D. Das, and D. Roubaud (2018). Informational efficiency of bitcoin - an extension.
Economics Letters, 163, 106–109.
Urquhart, A. (2016). The inefficiency of bitcoin. Economics Letters, 148, 80–82. Urquhart, A. (2017). Price clustering in bitcoin. Economics Letters, 159, 145–148.