processes. In: Digital Design in Landscape Architecture 2008: Proceedings at Anhalt
University of Applied Sciences. Herbert Wichmann Verlag, Berlin, Germany, pp. 176-187.
ISBN 9783879074686
Published by: Herbert Wichmann Verlag
URL:
This version was downloaded from Northumbria Research Link:
http://nrl.northumbria.ac.uk/6737/
Northumbria University has developed Northumbria Research Link (NRL) to enable users to
access the University’s research output. Copyright
©and moral rights for items on NRL are
retained by the individual author(s) and/or other copyright owners. Single copies of full items
can be reproduced, displayed or performed, and given to third parties in any format or
medium for personal research or study, educational, or not-for-profit purposes without prior
permission or charge, provided the authors, title and full bibliographic details are given, as
well as a hyperlink and/or URL to the original metadata page. The content must not be
changed in any way. Full items must not be sold commercially in any format or medium
without formal permission of the copyright holder. The full policy is available online:
http://nrl.northumbria.ac.uk/policies.html
This document may differ from the final, published version of the research and has been
made available online in accordance with publisher policies. To read and/or cite from the
published version of the research, please visit the publisher’s website (a subscription may be
required.)
Abstract
Traditional planning processes use two-dimensional drawings, plans, sections, elevations and artists‟ impressions to communicate design intent to interested parties. Three-dimensional computer visualisation technologies that support the planning process raise institutional and organisational challenges as their perceived benefits are considered. Virtual Reality (VR) models add interactivity and immersiveness to landscape visualisations but require appropriate technical input and management.
This paper explores two main themes. Firstly, how interactive 3D computer simulations of planning proposals can be adopted to successfully improve the traditional process. It reports on a pilot study to examine how architects, clients, planning officers and university researchers have worked together to systematically examine and analyse this changing process. It reports on issues concerned with ownership of city models, the roles and the compatibility, accuracy and remote sharing of urban data.
Secondly, we explore the emerging theme of web-based GIS applications and their impact on architectural visualisation. The process of placing urban data onto Google Earth was tested and the resulting issues emerging with this software, including IT and data management and accuracy issues for suitable architectural visualisation are discussed. The study also reports and offers an overview of placing accurate urban landscape data onto Google Earth and a discussion of using this method for online public participation and communicating technical building information.
1
Introduction
Traditional town planning processes use two-dimensional drawings, plans, sections,
elevations and artists‟ impressions to communicate design intent to interested parties.
Three-dimensional computer visualisation technologies that support the planning process raise institutional and organisational challenges as their perceived benefits are considered. Virtual Reality (VR) models of proposed schemes add interactivity and immersiveness to landscape visualisations but require appropriate technical input and management in order to meet the need of diverse audiences (Thompson and Horne, 2006).
This paper explores two main themes. Firstly, how interactive 3D computer simulations of planning proposals can be adopted to successfully integrate with, and support, the traditional planning process. It builds upon previous research which identifies the requirement for an accurate 3D urban model to be managed by an impartial body (Pritchard 2005) and reports on a pilot study to examine how architects, clients, planning officers and a university have worked together to systematically examine and analyse this evolving process. Whilst academic projects have shown the potential of VR models at the urban scale and provide good case study examples, few models built in academia are being used to their full potential in the planning process, by the relevant municipalities (Whyte 2002). Secondly, the paper explores the emerging theme of web-based GIS applications and the role they can play in urban planning. Institutions and organisations may begin to consider
their use in favour of a traditional server and services infrastructure (Stobl 2006). A case study evaluates the process of placing urban landscape data onto Google Earth and discusses the resulting issues emerging with this software, including IT and data management and accuracy issues and its appropriateness for use for online public participation and communicating technical design information.
2
Background
Participation in planning and design processes as Thompson I.(1999) points out dates back to the 1970s. Although there are several different ways to conduct public participation in planning and design, Thompson I (1999) suggests the following methods are more common ones: Charrette, workshops, planning-for-real, design game, public meeting, steering group, focus group(s), and community forum. In all these types of involvements designers and planners refers to some sort of a visual aid in order to disseminate their ideas and engage public in the development. Lang E (2005) believes that so far, visualizations in planning are mainly seen as a tool that allows visualizing a certain pre-defined proposal. Visualizations are not seen as an integrated part of a participatory planning process leading towards a proposal.
In recent years the use of new types of visual aids in participation process are slowly becoming in practice. As Lang E (2005) explains, computer-based visual simulations can potentially function as the link between the classic top-down approach in planning, i.e. experts providing information to the general public, and the bottom-up approach, i.e. the general public being consulted and participating in decision making.
For instance Al-Kodmany (1999) used three different types of visualisation tools in different types of involvement models in a participatory planning in Chicago. In different levels of design workshops they introduced an artist using an electronic sketch pad, Geographical Information Systems and computer photo-manipulation process. Al-Kodmay (1999) suggests that above techniques, visualisation through digital technology provided a common language for the participants and computer-based visualisation techniques could be an important contribution to the evolution of the participatory planning and design. In another example Bishop (2005) goes further and suggests that real-time visualization is important for certain public participation objectives but either not possible or not important for others. Further more Schroth et al (2005) put forward that 3D landscape visualizations applied as tools for participatory workshops in planning do benefit from interactive features.
2.1 Embedding VR into Traditional Planning and Design Process
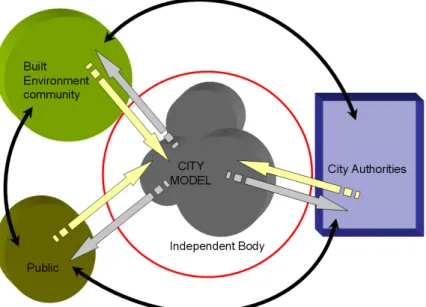
Authors believe that using state-of the-art visualisation technology could be instrumental to establishing an active, engaging and inspired participatory design and planning process. Using tools like virtual reality, web-based GIS systems etc will enhance the quality and the quantity of the participation.Thompson et al (2006) suggests that the relationship between the different stakeholders in the planning process can be enhanced with a different, more open approach. Figure 1 shows
this proposed alternative process and relationship that can start the better commincation and understanding between parties. During a planning process, by allowing academia to take an impartial and independent role on working with different stakeholders in order to maintain the digital city model and coordinate the communication and participation of all parties,
Whyte‟s (2002) observations on lack of utilization of these digital city models can be resolved. Hamilton et al (2005) verifies this notion that, in general, the ability to manage urban planning data leaves much to be desired.
Fig. 1: The role of an independent body between multiple stakeholders in a participatory project.(Thompson et al, 2006).
The use of different visualisation tools in planning particiapation is greatly documented (e.g. Schroth O., Schmid W. A., 2006; Kyungjin A., 2005; Al-Kodmany , 1999; Bishop, 2005; Schroth et al, 2005; Lang E., 2005). In this paper embedding virtual reality techniques to the traditional planning process is determined.
2.2 Pilot Study Approach
A pilot study was undertaken to explore how Northumbria University could work with a local architect, client, and city planners to introduce interactive VR technologies into the existing planning process. The site of a proposed new development was located in an architecturally sensitive area, adjacent to an important listed iconic building in Newcastle upon Tyne and a streak of the medieval city wall. Furthermore, the site at the top of a steep bank above the river is visible from many key view points around the city. The architect and their client sought a more efficient and transparent planning process than the typical consultancy and approval procedure that a large development must typically carry out.
2.3. Existing Process
Currently, the designer is required to produce 'redline images' of the building proposal in its context for visualisation purposes. This involves outlining the proposed building profile over an existing photograph of the site from various angles as stipulated by the planning officials. This is done to give an impression of the scale and impact of the new
development without being distracted by the visual seduction of „artist‟s impressions‟. In addition, multimedia (e.g. video, photomontages and fly-throughs) are becoming common for large developments that are used, to some extent, during the planning approval stage, as well as for marketing exercises. The accuracy of these images relies on the skill of the architect/ designer/ visualiser to properly judge the position and aspect of the design proposal.
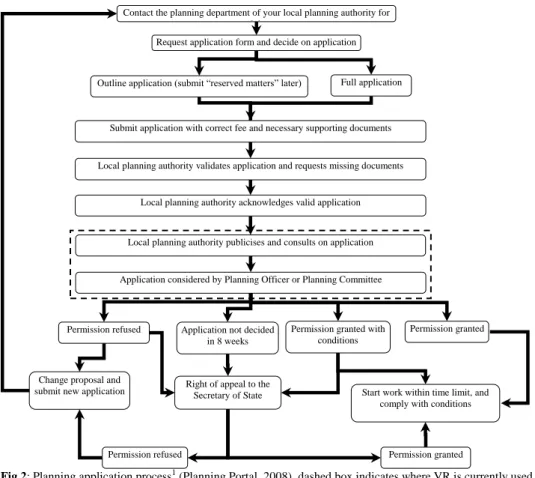
Fig 2: Planning application process1 (Planning Portal, 2008), dashed box indicates where VR is currently used to assist the planning process.
2.4 Compatibility Issues
Having established the details of the project, it was determined that Northumbria University would import the 3D design data created by the architect into the existing 3D model data of Newcastle upon Tyne currently owned by the University. The successful transfer of data
1
Available at: http://www.planningportal.gov.uk/england/genpub/en/1010677919308.html
Contact the planning department of your local planning authority for advice
Request application form and decide on application type
Outline application (submit “reserved matters” later) Full application
Submit application with correct fee and necessary supporting documents
Local planning authority validates application and requests missing documents
Local planning authority acknowledges valid application
Local planning authority publicises and consults on application
Application considered by Planning Officer or Planning Committee
Permission refused Application not decided in 8 weeks
Permission granted with conditions
Permission granted
Right of appeal to the Secretary of State Change proposal and
submit new application Start work within time limit, and
comply with conditions
Permission granted Permission refused
between two different organisations required careful management. Three compatibility categories were identified in this project:
1. Software and data compatibility: this was tested at an early stage, including
verifying backwards compatibility between established software. In this case, the compatibility was verified and the new building development was exchanged in .3ds format, for use in Autodesk's AutoCAD, Revit, 3Ds Max and SketchUp. These are commonly used packages in practice today, all of which now boast improved compatibility and import/ export functions. However, the extent of compatibility between software and file types can be the deciding factor of how much re-work has to be done after the file import process.
2. Modelling protocols: these can vary across all practices, industries and indeed,
countries. Although BS (British Standards) and ISO standards exist to alleviate these problems, these only really apply to 2d drawings as 3D modelling is more difficult to standardise due to its complexity.
3. Geographic Position: similarly, the correct location of building models can vary
depending on the organisation for a number of reasons. It is often the case that architects will conduct a site survey that does not need to be properly geographically located on a national level, merely located in relation to adjacent buildings. The altitude and orientation of a site is a similar issue but are typically true in both cases, as these are normally required to properly indicate the
topography of the building proposal, accurate roof heights, etc2.
2.4 Legal Issues
Due to copyright and licensing restrictions, if an independent body is to host a city model, it will be a requirement from the data provider that city model data is not released to third-parties, or re-sold for commercial purposes. However, with the correct licensing
arrangements in place, model data may be made available in “read-only” format which
could be used for online public viewing purposes without the underlying actual data being extracted, modified and re-used.
In the UK many current city models are based on Ordnance Survey (OS) data. This means
that the model must then conform to OS‟ Intellectual Property rights that restricts the distribution and prevents the re-sale of its data. However some UK data suppliers are providing data using a combination of aerial photogrammetry and GPS surveys, and the use of such data is defined in the licensing agreements provided by the supplier, and not by OS. Such data providers will expect that clients, developers and architects will purchase 3D data for each new development project prior to inserting this into a larger urban model owned by a city authority, or an impartial body working with a city authority.
2
Designs may be deliberately not geo-referenced as a virtual building model may be re-located at 0,0,0 as this is far easier for hardware (desktop PC) to compute. On the other hand, a building that is located at (424037, 563223, 0) must carry out more complex calculations in order to modify or navigate a 3D model
2.5 The Process
The raw data of the city model in this study exists in .dwg (AutoCAD) format. This is usually run and modified in 3dsMax (.max) for its 3D capabilities. The building proposal was created using Autodesk Revit 8, which is compatible with all of the above. Once the two models were merged together, some modifications had to be made to the city model. This included removing any existing buildings and landscape features from the immediate areas that were not to be part of the final design. Furthermore, the topography layer in the city model had to be modified to allow for the new building.
Having successfully imported the new development into the existing city model, interactive elements were added to the scene to make the completed product more presentable. This included some on-screen buttons for match-views, a fly-through button, user instructions (on-screen dialogue box) and company logos (acknowledging the architect, original data provider and Northumbria University (as model host)). Pre-agreed camera views were placed at prominent positions around the model to correspond to those city views usually analysed by the planning committee.
Having satisfied the architects that their building development model import was complete, the final model was presented to the client. Although the geometry of the model was fairly detailed, no materials or texture maps were applied to the building at this stage, as the aim of this task was to analyse the impact of the building within its context, rather than analyse the aesthetics. Introducing this element to the design process was extremely beneficial, as it soon became apparent that the design could be modified to add an extra floor onto the building before the final product was presented to the city planners.
The second presentation of the model involved the architect, the client and two members from Newcastle upon Tyne City planning department. In order to explore all options, the model was updated prior to this meeting in order to include the modified building. A second modified design proposal was also imported into the city model, whose visibility could be toggled on/ off that alternated between the 4 and 5 storey building proposals at the touch of a button. The comparison of the modified building with its shorter predecessor within its surroundings created dynamic discussions that engaged all of the parties.
Finally, a meeting was called by the architects to present the model to a member of English Heritage who assessed how architecturally sensitive the building was to its surrounding buildings. Again, this raised some informative points about the more detailed elements of the building and how they should reflect its surroundings, rather than focusing on the overall scale of the building. Although, this was not a formal assessment by English Heritage (this would be carried out at a later date), the meeting raised issues that would be mentioned during English Heritage's assessment of the building proposal and so could be rectified at these earlier stages.
2.6 Discussion
This pilot study identified some of the issues in adopting a VR city model, hosted by an independent body, into the traditional planning process. The study created an environment in which to assess and discuss an accurate building representation in its context. Although the city planners acknowledged the benefits the VR model offered they still required the
traditional redline images of the building in order to remain fair and consistent to the current process. However, the pilot study succeeded in introducing and testing a new collaborative, accurate and immersive process that would save cost and time over the current methods using two-dimensional representations.
A massive advantage that this 3D approach presents to the planning process is its greater transparency. Providing that the source data is accurate and the hardware which is being used to communicate the model is set up correctly, the analysis of any design proposals can be carried out with reliable accuracy, which cannot be guaranteed using traditional 2d photomontages or 'artists impressions'.
The success of this pilot study strengthens the case of the hosting of a city model by an independent organisation - Northumbria University in this case. Newcastle upon Tyne City Council was assured that the model was not being manipulated to enhance the imported building model. Furthermore, the architects themselves could see their design proposal in a much wider context and this was valuable to the design process, even in the early stages. This need and concern for accuracy and credibility of 3D model data, if to be used to inform urban planning decisions, led to a second case study in order to explore issues emerging in exporting accurate 3D city model data into free web-based services. Institutions and organisations may begin to consider their use in favour of a traditional server and services infrastructure (Stobl, 2006). The following case study evaluates the process of placing urban data onto Google Earth.
3
The Role of web-based GIS Applications
3.1 Introduction
Northumbria University has developed a photorealistic, interactive 3D computer model of
the University‟s City Campus. The competed model enables users to navigate around the
campus, explore future building developments of Northumbria University and has become a useful tool for presenting VR technology in the School of the Built Environment.
Following the tremendous growth of Google Earth and its user-centred approach to 3D building models, the decision was made to publish a modified version of the campus through this software. This was done for the following reasons:
To explore the process of modelling in Google Earth.
To explore the management issues of the platform, including legal and update issues.
To showcase this emerging technology as a tool for the built environment. To explore the use of a network link as a way of communication.
„Do it before someone else does‟- The ability to upload a 3D model of an actual building presents risks to the owners of the building who may not wish to advocate a model of their own building.
To take advantage of this free service that is already used by a vast market.
The 3D mapping programme that Google has begun describes a massive potential for visualisation in the built environment and city modelling.
3.2 Background to Google Earth
Google Earth (GE) is free software that enables users to navigate Earth through satellite
imagery, terrain and a vast amount of geographical features and content shared by a „Google Earth Community‟. The imagery and data is supplied from a range of data providers around the world and varies in resolution depending on its source and contains a digital elevation model (DEM) to form a realistic model of the globe.
In 2006, Google acquired „SketchUp‟, a 3D modelling program particularly suited to visualising the built environment, allowing users to model buildings and place them into the
„3D Warehouse‟, an open database of 3D models.
Another feature of GE is the ability to share a live data feed via a „Network Link‟, which is
a URL that relates to a third party‟s server and allows information to be shared across the
web using GE. An example of this is Berlin City Council‟s network link3 that allows users
to view more detailed 3D buildings of Berlin.
3.3 Exporting accurate 3D data into Google Earth
Although accurate campus data was available and the necessary permissions had been sought to distribute it on the web and much optimisation of the data was necessary to prepare the 3D models for web use and streaming over the internet. Although the existing models could have been uploaded directly into the 3D warehouse, this was not done for two reasons:
1. Large file sizes would have little or no chance of being included (approved) in the
„3D building‟ layer of GE.
2. Some features of the buildings needed checking and removing from the models for
security reasons.
In this way, simplified versions of the models would retain the function of the original, detailed campus model that was commissioned and paid for by Northumbria University. This modification process involved:
Compressing the texture maps (.jpgs) into more suitable sizes (typically 1/10th of their original size). This was significantly the most effective way of reducing the model sizes in this case.
Removing unnecessary geometry.
3
3.4 Issues Emerging
One of the major problems of this process is the inaccuracy and inconsistencies in GE‟s
terrain layer. The existing campus data is based on accurate measurement, wheras the
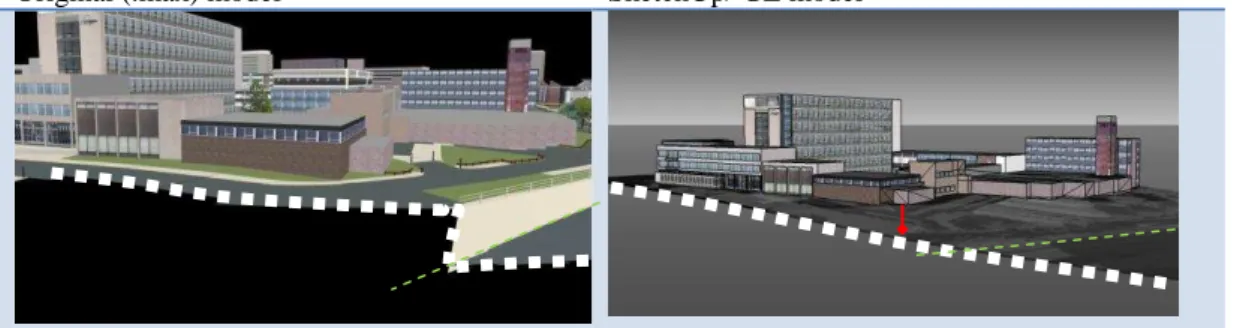
accuracy of Google‟s terrain is varied and height data is based on the average over a large area. This can create a range of problems, especially for large buildings, which means that parts of the building can either be underground or suspended above ground in certain places (see below).
Original (.max) model SketchUp/ GE model
The original building model lies true on its terrain, which steps down to the motorway.
The imported terrain causes the building model to float above the terrain. The motorway boundary is indicated in both images.
Fig 3: Issues in GE terrain data.
The terrain layer can be modified temporarily when uploaded into SketchUp, but any
changes made would contravene the „3D warehouse‟ criteria for modelling and so will be
omitted from the 3D buildings layer. However, some exceptions have been made by
Google, such as the town of Westport4 in Co. Mayo, Ireland. Originally developed as a
planning tool, a photo-realistic virtual model of the town has been added to the „3D
buildings‟ layer of GE.
3.5 Discussion
The discrepancies between the two levels of accuracies are not uncommon in city modelling. Some city models are based on two different datasets, such as OS building footprints and LIDAR terrain data. This can depend on the age of the data, technology used, and calibration of the equipment or even human error.
Given these issues, it is clear that GE has not yet developed sufficiently as tool for detailed architectural planning. The program, as well as SketchUp has seen huge success in architectural and landscape design. The problem herin lies in the attention to detail and what is now required is accurate terrain data and imagery. This also relies upon the constant improvement of data exchange over the internet, as the performance of the
4
program very much relies upon the speed at which large quantities of data can be streamed and must therefore allow for users with slower internet connections.
A further development of note is the introduction of Microsoft Virtual Earth. This program is similar to GE in many ways but has taken a different approach to its data collection. Microsoft has planned an extensive mapping program over the next five years, which involves the scanning and modelling of 3000 major cities around the world. Much research and development has been carried out by Microsoft in the field of remote sensing and automatic modelling techniques. These highlight the different approaches between Microsoft and Google, with the latter offering a more user-centric approach to develop their content.
4
Conclusions
The two case studies in this paper have:
Raised some of the issues in incorporating VR technologies into the traditional planning process.
Explored the role of an independent body to host a city model
Offered an overview of placing accurate urban landscape data onto web-based GIS applications, such as Google Earth, for different usage such as public participation. Emerging technologies in the fields of visualisation and web-based GIS applications are beginning to converge due to their cross-compatibility and advances in web 2.0. Although there are few examples of where applications such as Google Earth have been used for urban planning activities, the two disciplines are becoming increasingly connected in terms of ICT.
In an attempt to create a 3D DTM map that covers the entire globe, Google has avoided becoming a tool for accurate visualisation during its early stages. This highlights a continued need for such technologies for applications within the Built Environment, as well as the careful management and hosting of its data. But with the ensuing rivalry between Google and Microsoft may drive both developers to compete for accurate (and realistic) model data at street and micro level. Much research is being carried out by the latter in remote sensing and automatic modelling techniques, although much manual input is still required. Furthermore, the update of this data is also a major concern as urban areas are continually changing and expanding.
There is a requirement for city data to be accurate and credible if to be used as a decision making tool for planning process. If data accuracy could be preserved on freely available web-based applications they afford a way for the communication of 3D models remotely. They offer advantages such as:
Free access to software
Ease-of-use, requiring little or no technical knowledge Widely available and run off a standard desktop PC. Original raw data cannot be manipulated.
Access could be given to clients, planners, design teams and the public to view building developments in some context.
Although the issues mentioned above do lack the technical basis for accurate planning, their simple interface and usability of the software lends itself well to better planning participation. Designs can be shared more easily and to a far greater audience than using specialist software.
5
Areas for Future Research
An extensive list of architecturally sensitive features relating to the category and location of a building would be a useful resource for any modeller. The question
of „what to model?‟ is left to the discretion of the modeller. Although CityGML5 does outline certain features for their official levels-of-detail, a comprehensive list of features exists only as separate theoretical guidelines.
The legal rights to virtual models remain unresolved in many situations. For
example, when a model is built „based on OS data‟, to what extent does this basis
tie the modeller to the copyright restrictions of OS data, such as when only one (OS)dimension has been referred to base a model upon. Furthermore, there may be no evidence that this is neither enforceable nor even traceable.
6
References
3D Geo GmbH. Berlin 3D. [Online]. Available at: http://www.3d-stadtmodell-berlin.de/3d/en/seite0.jsp (Accessed: 7/2/08).
Al-Kodmany K., (1999): Using visualization techniques for enhancing public participation in planning and design: process, implementation, and evaluation, Landscape and Urban Planning Volume 45, Issue 1, Pages 37-45.
Bishop I. D., (2005): Visualization for Participation: The Advantages of Real-Time? , 6th International Conference on Information Technologies in Landscape Architecture "Trends in Real-Time Landscape Visualization and Participation", Dessau, Germany, Anhalt University of Applied Sciences, Buhmann, Paar, Bishop, Lange (Eds.)
Hamilton, A., Wang, H., Tanyer, A. M., Arayici, Y., Zhang, X. & Song, Y. (2005) 'Urban Information Model for City Planning', Journal of Information Technology in Construction, 10, pp. 55-67.
Kolbe T, (2007): “CityGML”: What is CityGML? Available at: http://www.citygml.org/1523/ accessed 10/2/08
Kyungjin A., (2005): Implementation of Real-Time Landscape Visualisation for Planning Process, 6th International Conference on Information Technologies in Landscape Architecture "Trends in Real-Time Landscape Visualization and Participation", Dessau, Germany, Anhalt University of Applied Sciences, Buhmann, Paar, Bishop, Lange (Eds.)
Lange E, (2005) : Issues and Questions for Research in Communicating with Public through Visualisation, Trends in Real Time Landscape Visualisation and Participation- Conference Proceedings at Anhalt University of Applied Sciences 2005, Buhmann E., Paar P., Bishop I., Lange E. (Eds.)
Pritchard (2005): Capturing the City: the Development of the 3d Urban model of Glasgow,
5
Stobl (2006): , 7th International Conference on Information Technologies in Landscape Architecture "Knowledge-Based Landscape Modelling", Dessau, Germany, Anhalt University of Applied Sciences, 2006, Buhmann, Ervin, Jörgenson, Strobl (Eds.)
Schroth O., Schmid W. A., (2006): How Much Interactivity does the Public Want? An Assessment of Interactive Features in Virtual Landscapes, 7th International Conference on Information
Technologies in Landscape Architecture "Knowledge-Based Landscape Modelling", Dessau, Germany, Anhalt University of Applied Sciences, 2006, Buhmann, Ervin, Jörgenson, Strobl (Eds.)
Schroth O., Lange E., Schmid W., A., (2005): From Information to Participation – Applying Interactive Features in Landscape Visualizations, , 6th International Conference on Information Technologies in Landscape Architecture "Trends in Real-Time Landscape Visualization and Participation", Dessau, Germany, Anhalt University of Applied Sciences, Buhmann, Paar, Bishop, Lange (Eds.)
Thompson and Horne, (2006): Diversity in Virtual Reality Landscape Modelling, 7th International Conference on Information Technologies in Landscape Architecture "Knowledge-Based Landscape Modelling", Dessau, Germany, Anhalt University of Applied Sciences, 2006, Buhmann, Ervin, Jörgenson, Strobl (Eds.)
Thompson E., Horne M., Fleming D., (2006): Virtual Reality Urban Modelling – An Overview, CONVR2006 6th Conference of Construction Applications of Virtual Reality, Orlando, Florida, USA, 3-4 August 2006
Thompson, Ian H. (1999): Ecology, Community, and Delight – sources of values in Landscape Architecture, Spon Press, London, UK.