Generating Semantic Information from 3D Scans of Crime Scenes
Anna Topol
1Michael Jenkin
1Jarek Gryz
1Stephanie Wilson
1Marcin Kwietniewski
1Piotr Jasiobedzki
2Ho-Kong Ng
2Michel Bondy
2 1York University, Department of Computer Science and Engineering
4700 Keele St., Toronto, ON, Canada, M3J 1P3
2MDA, 9445 Airport Rd., Brampton, ON, Canada, L6S 4J3
Abstract
Recent advancements in laser and visible light sensor technology allows for the collection of photorealistic 3D scans of large scale spaces. This enables the technology to be used in real world applications such as crime scene investigation. The 3D models of the environment obtained with a 3D scanner capture visible surfaces but do not pro-vide semantic information about salient features within the captured scene. Later processing must convert these raw scans into salient scene structure. This paper describes on-going research into the generation of semantic data from the 3D scan of a crime scene to aid forensic specialists in crime scene investigation and analysis.
1. Introduction
The last ten years have seen a significant improvement in the capability of 3D scanning technology to obtain dense surface scans of large scale spaces. Laser and visible light technology now exists that can be used to capture such envi-ronments (see [4] and [9] for laser-based examples and [13] and [6] for examples that use visible light). This ability has enabled 3D scanning technology to move out into the field to permit the capture of complex unstructured scenes. This paper describes ongoing work within the CBRN (Chemical, Biological, Radiological and Nuclear) Crime Scene Mod-eler (C2SM) project that is researching the application of 3D scanning in crime scene investigation. The project re-lies on the iSM sensor [13] for real time data acquisition at CBRN crime scenes and the development of custom soft-ware for the fast recreation of such scenes as virtual envi-ronments.
Models obtained using the iSM sensor are available as textured polygonal surface representations that permit vir-tual walkthroughs of the scene. For such representations to be effective for crime scene investigation this information
must be processed into a more useful form and merged with other sensor and forms-based data. The C2SM project is de-veloping sensors and software tools to enable crime scene investigators to conduct an investigation of a contaminated scene using iSM sensor data. Traditional crime scene in-vestigation techniques are not well suited for CBRN scenes as they expose investigators to chemical and other hazards present in the environment. It is desirable to investigate these scenes while minimizing first responders’ exposure to the contamination. While 3D scanned models allow an investigator to view and navigate the virtual scene as it ex-isted at the time of capture, the models in and of themselves are not directly useful to an investigator.
The 3D representation obtained by the sensor consists of a large textured mesh describing that portion of the scene that has been obtained by the scanner in a single sweep. Multiple sweeps may be integrated into one large mesh through a registration process, but in either event the re-sulting mesh does not separate out salient objects (e.g., any bodies that may be present, furniture, or other evidence) from each other or from the background. In order to be able to manipulate the scene more effectively it is neces-sary to segment the single environmental scan into semantic primitives and to provide tools and techniques to manipulate these primitives in an effective manner.
This paper summarizes work to date within the C2SM project and describes the techniques used to generate se-mantic information about individual objects within the 3D model of a crime scene.
2. CBRN Crime Scene Modeler System
Overview
2.1. Motivation
The goal of the CBRN Crime Scene Modeler project is the development and field evaluation of technologies for
Figure 1. A 3D model of a simulated crime scene viewed from above. The scan was obtained with the visible light sensor described in [13]. The scanner has been placed at a number of locations in the environment and the visible portion of the environment from each camera position has been recovered. Multiple scans have been combined to produce the 3D model shown.
real time data acquisition at CBRN crime scenes, the de-velopment of appropriate multi-modal database technology to support representation and query of both the 3D scan data as well as other multi-modal data obtained at the scene, and fast recreation of such scenes as virtual environments with access to all of the multi-modal data and heterogeneous ev-idence associated with the scene.
Investigating crime scenes in which chemical, biologi-cal, radiologibiologi-cal, nuclear or explosive (CBRN) agents have been deployed poses great dangers to first responders and forensic investigators. As a result of environmental contam-ination the normal process of crime scene investigation may be harmful to the personnel involved. Any prior decontami-nation of the scene to make it safe for the investigators may destroy evidence essential for later investigation and crim-inal proceedings. Nor is it always practical for the crime scene to be fully processed while investigators wear appro-priate protective gear. In scenes contaminated with radioac-tive materials it is not always possible to ensure personnel protection. In many cases it is also necessary to return the
scene to normal use in a rather short period of time which poses additional constraints on the investigative process.
Effective investigation of these crime scenes requires the development of technologies that enable remote crime scene investigation (image capture, collection of multi-dimensional measurements and detector readings, sample collection) while marking their locations and recording ob-servations from a properly shielded location. At the very least it is necessary to minimize personnel exposure to contaminants by reducing dramatically the time spent in the hazardous zone by developing devices and techniques that enable investigations to be conducted more effectively while wearing restrictive protective clothing. These require-ments call for autonomous and semi-autonomous systems and technologies to acquire crime scenes and to record rel-evant data prior to subsequent decontamination. An inte-grated approach is required that can acquire surface scans of the environment and other complex sensor data along with traditional crime scene reports. The recovered data and extracted information must be represented in formats
Figure 2. C2SM sensor mounted on a mobile robot platform. The sensor provides stereo, IR, chemical and radiological modalities.
that allow intuitive and fast access to vast amounts of het-erogeneous information.
2.2. Data Collection
Fundamental to the operation of the C2SM system is the ability to collect dense, accurate and photo realistic 3D representations of the crime scene itself. The iSM sensor uses a commercial stereo camera pair to obtain raw depth measurements at each time instant. A specially-designed patterned illuminant is used to break up camouflage in the scene. Sensor head egomotion between image captures is estimated through the motion of detected scene points. The 3D data obtained at each time step is then mapped to a com-mon reference frame based on this egomotion. The result-ing 3D point cloud provides a textured 3D representation of the local environment around the sensor. (See [13] for fur-ther details.) The sensor is directed throughout the scene in a sweep either in a precomputed manner (e.g., by rotating the sensor 360 degrees about a vertical axis) or through di-rect user control. Once a sensor sweep has been collected, the raw 3D point cloud data is meshed into a textured polyg-onal mesh representation for later processing. Data sets collected from disparate scene locations are mapped into
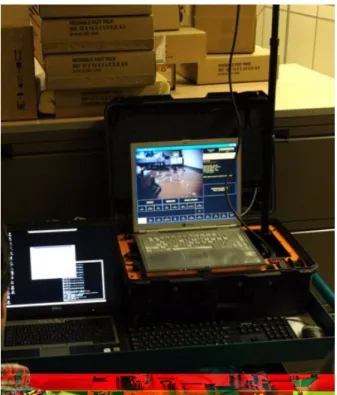
Figure 3. Remote mobile robot platform tele-operation station.
a common reference frame through a mesh registration pro-cess that is based on both manual and automatic registration procedures. Figure 1 illustrates the capture of a complex and extensive scene using the iSM. Portions of the scene were not scanned and these regions appear as voids in the resulting mesh representation.
The C2SM sensor provides additional sensing modali-ties including IR, chemical and radiological sensing above those provided by the iSM. The modified iSM sensor [13] system is normally mounted on a mobile platform (Figure 2) and the vehicle and sensor are remotely operated from a protected position (Figure 3). Alternatively, in less con-taminated environments the C2SM hand-held unit can be separated from the vehicle and operated manually by an in-vestigator in protective clothing in the hot zone supported by other staff at a safe remote location.
Raw scans from the C2SM sensor are made available to other users and software modules via a communications in-frastructure. Scans collected using the C2SM sensor are processed and merged with traditional and non-traditional crime scene data and made available to investigators both on site and elsewhere. In order to provide a coherent and consistent interface to the heterogeneous crime scene data a multimedia database system has been developed (see [8, 7]). A central concept in the resulting representation is that
entities in the database have a specific pose that they oc-cupy in the reconstruction of the scene. The database or-ganization applies the notion of a hierarchical relationship between objects to reflect the hierarchical relations between objects in the world. Entities are associated with larger structures. Objects may contain one another (e.g., the gun is in the drawer). Additionally, the process of data collec-tion enforces specific relacollec-tionships between entities (e.g., the coroners report is associated with the body of the vic-tim). The relationships are represented visually in the vir-tual environment by allowing the user to select an object of interest within a scene and perform various actions on it. For example, if the selected object is the entire crime scene then the user may choose to zoom in on one of the rooms, so that the model of that room alone replaces the current model on the screen. If an object has other data associated with it, such as lab reports, audio-visuals, or digital still photos, the user is able to click on an object and see a list of available actions, so (s)he may choose to view an existing document or associate another item of evidence with that object. In order to be able to select and manipulate salient objects in the environment they must first be segmented from the main model of the scene. A description of the segmentation pro-cess is given below. Details of the structure of the database system and the user interface that has been developed to manipulate information within the database are described elsewhere (see [8, 7]).
3. 3D Crime Scene Model Segmentation
The model shown in Figure 1 is of a simulated crime scene extending over a number of rooms. The 3D model was constructed by merging together 3D scans obtained us-ing the iSM [13] visible light sensor from different view-points in the environment. It represents a virtual environ-ment that can be navigated and rotated for different points of view. The salient objects within the scene are indistin-guishable from the rest of the environment. For crime scene investigators the scene is of interest because it contains po-tentially vital evidence that can be examined, annotated, and further analyzed. One of the goals of the Crime Scene Mod-eler system is to provide a convenient user interface where all multimodal data comes smoothly together to create a sin-gle fusion of evidence pieces that can be associated with each other and investigative and laboratory analysis reports. Each object in the scene can have multiple views that can be freely interchanged without having to navigate through var-ied applications and a multitude of physical evidence. This is difficult to achieve when the system is unable to distin-guish salient features in the model from one another.
A critical requirement of the C2SM project is being able to decompose the 3D scan into salient structures. A number of segmentation techniques exist for 2D images
[5, 14, 12, 2, 1] and for 3D [2, 1]. Segmenting 3D models is a great deal more complicated than segmenting 2D images. In 2D the entire image is visible all at once and the informa-tion can be processed as a two dimensional array of pixels. In 3D some parts of the object being segmented may not be visible. Manually segmenting 2D images is a daunting and time consuming task. Nonetheless, if the user wanted to manually segment a 2D image (s)he has the ability to outline a segmentation boundary. In 3D an object boundary describes a volume and cannot be outlined by simply drag-ging a mouse around it as is possible in 2D. The user would have to manually identify each polygon in a 3D mesh. The larger is the model and the higher its resolution, the greater is the number of polygons in the virtual environment. This task would be very time consuming and inapplicable for the real life settings. Given the importance of 3D segmentation a number of algorithms have begun to emerge to address this problem. Boykov and Jolly [2] have applied a min-cut/max-flow approach to voxel representations. We follow a similar approach, and this is described below.
To allow for the assisted segmentation of the 3D repre-sentation of a crime scene we have adopted the Lazy Snap-ping technique [10] based on the graph-cut algorithm de-scribed in [2] to a voxelized representation of the model. The 3D segmentation process begins by converting the in-put 3D polygon or point cloud (Figure 4) representation into a discrete 3D voxel grid (Figure 5). Once a voxel represen-tation of the model has been created the next task is to allow the user to specifyseed voxels. These are non-empty vox-els tagged by the user as being eitherforegroundor back-ground, as in Figure 6. The user swipes a mouse through the 3D voxel scene. An arbitrary number of voxels may be marked by the user and the view of the 3D scene can be translated and rotated to mark voxels that may be not visible from the current viewpoint. In addition to each voxel pos-sessing a color intensity value, a voxel has astateattribute. This state attribute can be one of the following four values: empty, colored, foreground, or background. A voxel with either a foreground or background state implies it is colored and has a valid RGB value.
The task of marking the voxels is an instance of the prob-lem of 3D ray-picking. When a user wishes to mark a voxel, the 2D window-coordinate of the mouse position is con-verted into a 3D ray directed into the 3D voxel grid. Each voxel intersected along the ray into the grid is tested. The first non-empty voxel encountered is tagged.
Next a graph is created where a node in the graph is used to represent each non-empty voxel. Adjacent non-empty voxels are considered connected nodes. A sink node and a source node are also added to the graph, with edges to each voxel node. Weighting heuristics are applied to the voxel graph based on the mean colour difference between two regions in a similar fashion to that performed on the
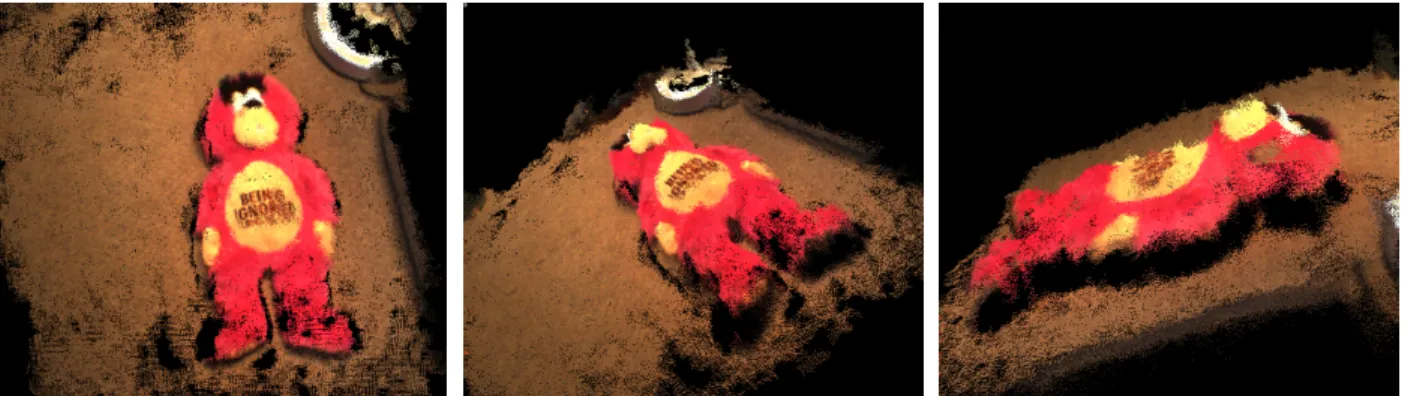
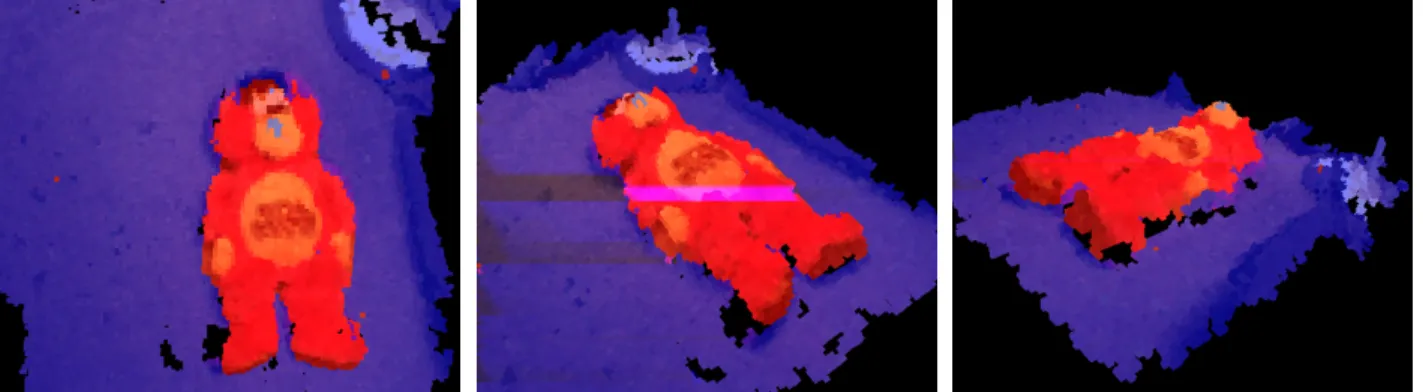
Figure 4. 3D point cloud scan of the scene
Figure 5. Scene voxelized at 28resolution.
Figure 6. User markup of foreground (red) and background (blue). Rotating and translating the model allows the user to mark surfaces not visible from the current viewpoint.
pixels of a 2D image in [10].
At this point the goal is to find the graph cut with mini-mum cost, where the cost of a cut is the sum of the weights of the edges that are cut. The min-cut represents the di-vision between foreground and background. Using a min-cut/max-flow algorithm [3] all nodes which are connected
to the source in the resulting cut are foreground nodes, and all nodes which are connected to the sink are background nodes. The voxels associated with each node are then la-belled either foreground or background based on the min-cut. The data set is now fully labelled and can be redis-played using this semantic information (Figure 7).
Figure 7. Model view after the system completed segmentation.
Figure 8. Foreground object extracted as a 3D mesh.
Because the boundary in 3D cannot be defined by a path as is the case in 2D the boundary editing step in 2D Lazy Snapping [10] approach has been modified to suit the vol-ume boundary editing of 3D objects. At this point if the user is not satisfied with the results of segmentation performed by the system (s)he may add additional markup lines to the 3D model and the system will adjust the segmentation ac-cordingly.
Once the nodes in the graph have been marked to the user’s satisfaction surface reconstruction can be performed. Only points contained within voxels with corresponding graph nodes marked as foreground will be considered by the algorithm. The remaining points are culled from the point-cloud. The surface reconstruction algorithm uses a variation of Marching Cubes [11] to retrieve a 3D texture-mapped triangle mesh from the resulting point-cloud. A segmented model of the foreground is redisplayed to the user (Figure 8). The user may now save the object model to the database for later retrieval and analysis.
4. Discussion
When the point cloud is converted into voxels the color of each voxel is determined by averaging the color of all points that fall within its bounding volume. Segmenting the object using a lower voxel resolution reduces the precision of the boundary between the object and the background. This problem is similar to attempting to draw a curve in 2D where the curve is approximated by square pixels and would appear jagged at a lower resolution and smoother when drawn at a higher resolution. In 3D curved surfaces are approximated by square volume pixels. Thus the lower the voxel resolution, the coarser is the curvature and color approximation. When the Marching Cubes [11] algorithm is applied to the segmented voxel representation the result-ing mesh is an estimate of the best polygon configuration for each voxel based on its properties. This can result in the final model retaining a portion of the background immedi-ately adjacent to the object (see Figure 8).
The environmental model is created by scanning a large scale space and therefore smaller objects within the envi-ronment will be of lower resolution and less detailed. As many such objects might be of great interest to the
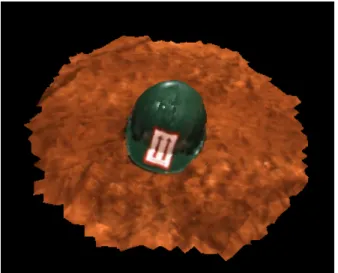
foren-Figure 9. High resolution scan of an object of interest within a scene.
sic investigators, they can be re-scanned at a high resolution range to obtain a more detailed model (see Figure 9). The goal is for the investigators to be able to access all of the data from within the view of a single environment model. To increase the fidelity of the viewed scene it may be desir-able to replace salient objects in the large scene with their higher resolution versions. As it is not possible to collect a clean scan of a single object without a background, the object has to be segmented from its background in the de-tailed scan. While it is possible to plug the entire object model with the surrounding wedge of the background di-rectly into the scene after re-calculating it’s proper align-ment, it would be extremely inefficient. The iSM sensor [13] collects approximately 500GB of data per hour result-ing in rather large environmental model data sets. It is of-ten desirable to display unimportant features at lower res-olution to increase rendering speed of the overall model. Thus only the objects that carry essential information need to have more detailed models available to the user. Given that the environment portrays the real world there can be a great number of such objects. In addition each object can consist of multiple scans from different points of view that have been aligned together.
5. Summary
Segmenting dense photorealistic 3D models of crime scenes is important for crime scene analysis, model manip-ulation, and object representation. Semi-automatic segmen-tation provides an easy to use method for a user to generate extensive semantic information for a 3D representation of
a crime scene. The data set is first captured using a visible light sensor. The raw 3D point cloud or 3D polygon mesh is processed and converted into voxels. The user indicates a rough segmentation by marking a few distinct foreground and background lines. These lines are projected into the data set and the foreground and background seeds are com-puted. These represent the voxels which the user has indi-cated are definitely foreground or background. The voxel grid is converted into a graph, with nodes representing vox-els, and edges representing adjacencies between voxels. A source node and a sink node are added, with edges between themselves and every voxel node. Adjacent voxel nodes are weighted according to their colour similarity. Similarly, the source and sink edges are weighted based on colour similarity between the voxel node and the foreground and background seeds. The minimum-cut of the graph is found which represents the segmentation. Once segmented out of the scene the model is re-displayed to the user and may be saved into the multimedia database for later retrieval and have other heterogeneous data associated with it.
Being able to segment a 3D surface scan of a crime scene into salient features is an essential functionality to foren-sic investigators. This enables investigators to use virtual models of the environment as important crime scene inves-tigation tools and a single convenient point of access for all crime scene evidence information while easily maintaining proper relationships between heterogeneous evidence data.
Acknowledgments
The financial support of NSERC, the CBRN Research Technology Initiative (project number CRTI-05-0122) and MDA is gratefully acknowledged.
References
[1] Y. Boykov and G. Funka-Lea. Graph cuts and efficient n-d image segmentation. International Journal of Computer Vision, 70:109–131, 2006.
[2] Y. Boykov and M.-P. Jolly. Interactive graph cuts for opti-mal boundary & region segmentation of objects in n-d im-ages. InEighth International Conference on Computer Vi-sion (ICCV’01), 2001.
[3] Y. Boykov and V. Kolmogorov. An experimental compar-ison of min-cut/max-flow algorithms for energy minimiza-tion in vision. IEEE Transactions on Pattern Analysis and Machine Intelligence, 26:1124–1137, 2004.
[4] M. Brizzi, S. Court, A. d’Andrea, A. Lastra, and D. Sepio. 3d laser scanning as a tool for conservation: the experiences of the Herculaneum Conservation Project. InThe 7th In-ternational Symposium on Virtual Reality, Archaeology and Cultural Heritage (VAST), 2006.
[5] L. Cohen. On active contour models and ballons. Com-puter Vision, Graphics, and Image Processing: Image Un-derstanding, 53:211–218, 1991.
[6] A. Hogue, A. German, and M. Jenkin. Underwater environ-ment reconstruction using stereo and inertial data. In Pro-ceedings of IEEE Int. Conf. on Syst. Man Cybegn., 2007. [7] M. Kwietniewski, S. Wilson, A. Topol, S. Gill, J. Gryz,
M. Jenkin, P. Jasiobedzki, and N.-K. Ng. A multimedia database system for 3d crime scene representation and anal-ysis. InProc. 3rd Int. Workshop on Computer Vision meets Databases (CVDB’07), 2007.
[8] M. Kwietniewski, S. Wilson, A. Topol, S. Gill, J. Gryz, M. Jenkin, P. Jasiobedzki, and N.-K. Ng. Med: A multi-media event database for 3d crime scene representation and analysis. In Proc. 24th Int. Conf. on Data Engineering, 2008. (Demo) To appear.
[9] M. Levoy, K. Pulli, B. Curless, S. Rusinkiewicz, D. Koller, L. Pereira, M. Ginzton, S. Anderson, J. Davis, J. Ginsberg, J. Shade, and D. Faulk. The digital Michelangelo project: 3d scanning of large statues. InProc. SIGGRAPH, 2000. [10] Y. Li, J. Sun, C.-K. Tang, and H.-Y. Shum. Lazy snapping.
ACM Trans. Graph., 23(3):303–308, 2004.
[11] W. E. Lorenson and H. E. Cline. Marching cubes: A high resolution 3d surface construction algorithm. InProceedings of the 14th Annual Conference on Computer Graphics and Interactive Techniques, pages 163–169, 1987.
[12] S. Osher and N. Paragios. Geometric Level Set Methods in Imaging, Vision, and Graphics. Springer Verlag, 2003. [13] S. Se and P. Jasiobedzki. Photorealistic 3d model
recon-struction. InProceedings of IEEE International Conference on Robotics and Automation, ICRA2006, pages 3076–3082, 2006.
[14] S. Zhu and A. Yuille. Region completion: unifying snakes, region growing, and bayes/mdl for multiband image seg-mentation.IEEE Transactions on Pattern Analysis and Ma-chine Intelligence, 18:884–900, 1996.
![Figure 1. A 3D model of a simulated crime scene viewed from above. The scan was obtained with the visible light sensor described in [13]](https://thumb-us.123doks.com/thumbv2/123dok_us/982791.2629087/2.918.113.784.108.557/figure-model-simulated-viewed-obtained-visible-sensor-described.webp)