NEW ZEALAND FIXED WING
AVIATION ACCIDENTS
A review of all reported New Zealand registered
aeroplane accidents from 1995 to 2004
This study used the Australian Transport Safety Bureau’s (ATSB) Paper B2004/0010 (General Aviation Fatal Accidents: How do they happen?) as a
template. The author acknowledges the ATSB’s paper B2004/0010 as an important guide for grouping and preparation of this data.
EXECUTIVE SUMMARY
This report aims to identify what caused New Zealand fixed wing aviation accidents over the ten year period from 1995 to 2004. The report did not identify any causes that were common to all fixed wing accidents. However, several trends and factors have been identified.
For the purposes of this report fixed wing aircraft means a “power-driven heavier-than-air aircraft deriving its lift in flight chiefly from aerodynamic reactions on surfaces which remain fixed under given conditions of flight”. The sample does not include microlight aircraft, amateur built aircraft, gliders or any sports category aircraft.
There were 461 fixed wing accidents (80 involving fatalities and/or serious injuries) involving New Zealand registered aircraft between 1995 and 2004. These accidents resulted in 123 fatalities. The data indicated a very low chance of any person escaping an aircraft accident involving fatalities.
Since the year 2001 there has been a downward trend in the rate of fixed wing accidents. However, the fatal fixed wing accident rate has shown a strong upward trend since 2002.
Private flights recorded the highest number of accidents and the highest rate of
accidents. Agricultural aviation accidents also scored high numbers, but a lower rate. Transport passenger accidents were among the highest count of accidents, but scored the lowest rate of any operational group. Solo and dual training operations have close actual numbers of accidents, yet their rates (one of the lowest compared with other groups) differ significantly, with the solo training accident rate nearly double that of dual training operations.
The average age of accident aircraft was 26 years. Single engine aircraft recorded a higher rate of accidents than multi engine aircraft but had a similar fatal accident rate. Single crew pilots were 42 times more likely to have an accident than multi crew pilots and 13 times more likely to have a fatal accident.
Saturday was the most frequent day for fixed wing accidents while Friday was most common for fatal accidents. Midday to mid afternoon was the most common time for accidents, with most fatal accidents occurring between 1400 and 1500 local time. No clear explanation can be given for these results, although end of week fatigue and increased private flying during weekends may have played a part.
The data showed that the risk of a pilot being involved in an accident increased with age, with the highest risk occurring in the 55 to 64 age bracket. Those pilots who gained their licence at an older age were more likely to be involved in an accident than those who gained their licence at a younger age. The longer the pilot had held their licence the less chance they had of having an accident (the most common licence
held by accident pilots was a Commercial Pilots Licence [CPL]). This agrees with the findings of a study conducted by the National Transportation Safety Board (NTSB)1. Pilots who had between 200 and 2000 flight hours were more likely to have an accident than other pilots. The data showed that time on type of aircraft was a good safety indicator with greater time equating to less risk of an accident. The greater the 90 day currency of the pilot the less risk they had of being involved in an accident. The data indicated that total flight time was not a good indicator of safety risk.
Pilot gender did not seem to play a significant part in reducing the risk of an accident, although slightly less female pilots were involved in fatal accidents than were
represented in the whole pilot population.
Nearly half of all fixed wing accidents occurred during the landing stage of flight. However, there were no fatalities and few serious injuries as the result of these
accidents. The majority of fatal accidents occurred during the cruise and after takeoff. The majority of accidents involved aircraft operating to Visual Flight Rules (VFR). There was a slight increase in Instrument Flight Rules (IFR) fatal accidents when compared to the percentage of IFR accidents for the total population.
The most common type of fatal or serious injury fixed wing accident was
Uncontrolled Flight into Terrain (UFIT) followed by Controlled Flight into Terrain (CFIT) and Managed Flight into Terrain (MFIT) accidents (see Appendix A for definitions).
UFIT accidents happened for a variety of reasons but it is worth noting that
inappropriate control inputs featured strongly as a contributing cause in most of these accidents. It is also worth noting that a high number of these accidents involved stalls (resulting in spins) while the aircraft was turning. Icing was a common cause for loss of control by IFR aircraft.
Agricultural operations featured strongly among the CFIT low level accidents with a majority hitting trees or hills. This is consistent with New Zealand terrain. Most of the CFIT accidents during ‘normal’ operations involved VFR aircraft with limited or zero external visibility. All the IFR CFIT accidents occurred during instrument approaches.
The MFIT accidents resulted in more serious injuries than fatalities. Most of the fatalities for MFIT accidents were the result of ditching. All these fatalities resulted from drowning rather than impact forces. All those who drowned were not wearing lifejackets.
All the MFIT accidents were initiated by engine failure or lack of performance. Only one accident was the direct result of mechanical failure that was beyond the control of the pilot. A large percentage of these accidents involved fuel starvation or
exhaustion. Overloading also featured as a common cause.
1
Safety Study: Risk Factors Associated with Weather-Related General Aviation Accidents. NTSB Report number SS-05-01.
It was determined that air transport passenger accidents were linked to inappropriate decisions rather than control inputs, while private accidents were a combination of inappropriate control inputs and decisions.
The study concludes that many factors can put a fixed wing pilot at risk. Flight skills and decision making are vital in preventing accidents. The study suggests that IFR multi crew passenger transport flights are among the safest flights from a risk factor perspective, while VFR single pilot private operations are among the highest risk groups.
The highest risk pilots are those who have only held their licence for 1 to 2 years and gained that licence after their 50th birthday. Those pilots with the lowest risk are those who have held their licence for more than 8 years and gained that licence before their 35th birthday. These pilots also have substantial time on the type of aircraft they are flying and logged 40 hours (or more) flight time every 90 days.
Competency and currency were identified as key safety indicators. The data showed that training flights produce relatively few accidents compared to other types of operations. The data also showed that pilots with very low total time were less at risk than those with moderate amounts of flight time (200 to 2000 hours). Pilots with low 90 day currency were also at risk. This would suggest that pilots (particularly Private pilots) who are no longer under the supervision of an instructor and fail to maintain their skill base place themselves at risk.
Pilots who blatantly disregard the rules (regardless of experience and age) present the greatest risk for having a fatal accident.
TABLE OF CONTENTS
1 INTRODUCTION ... 11 2 RESEARCH OUTLINE ... 12 2.1 Objectives ... 12 2.2 Methodology ... 12 2.3 Design ... 123 FIXED WING AVIATION ACCIDENT DATA ... 13
3.1 General data ... 13
3.2 Aircraft demographics ... 17
3.2.1 Aircraft categories ... 17
3.2.2 Pilot numbers required by accident aircraft ... 19
3.2.3 Aircraft age ... 21
3.2.4 Aircraft engine type ... 23
3.3 Type of operation ... 25
3.3.1 Total accidents sorted by type of operation ... 25
3.3.2 Fatal accidents sorted by type of operation ... 26
3.3.3 Accident rates sorted by type of operation ... 26
3.4 Injuries ... 29
3.4.1 Fatal injuries ... 29
3.4.2 Fatal injuries by aircraft category ... 31
3.4.3 Fatal injuries by type of operation ... 33
3.4.4 Survivors ... 35
3.5 Number of fixed wing accidents by day-of-week ... 42
3.6 Accident rates by time of day ... 48
3.7 Pilot demographics ... 52
3.7.1 Pilot age ... 53
3.7.2 Pilot licence details ... 55
3.7.3 Pilot flight experience ... 59
3.7.4 Pilot gender ... 62
3.8 Phase of flight that accident occurred ... 64
3.9 Flight rules at time of accident ... 66
4 FATAL AND SERIOUS INJURY ACCIDENTS ... 68
4.1 Categorisation of fatal and serious injury accidents ... 68
4.2 Controlled Flight into Terrain (CFIT) fatal and serious injury accidents ... 70
4.2.1 CFIT fatal and serious injury accidents during low-level operations. ... 71
4.2.4 CFIT fatal and serious injury accidents occurring during ‘normal’ operations ... 74
4.3 Managed Flight into Terrain (MFIT) fatal and serious injury accidents ... 78
4.4 Uncontrolled Flight into Terrain (UFIT) fatal and serious injury accidents ... 80
4.4.1 UFIT fatal and serious injury accidents during low level operations ... 81
4.4.2 UFIT fatal and serious injury accidents during ‘normal’ operations ... 82
4.4.2.1 Inappropriate control inputs ... 82
4.4.2.2 Loss of visual reference ... 82
4.4.2.3 Weather related ... 83
4.4.2.4 Icing conditions ... 83
4.4.2.5 Aerobatics ... 83
4.4.2.6 Loss of engine power ... 83
4.4.2.7 Flight controls failure ... 84
4.4.2.8 Avoiding obstacles ... 84
4.4.2.9 Undetermined causes ... 84
4.5 Remaining fatal and serious injury accident types. ... 86
4.5.1 Impact to external parties ... 86
4.5.2 Take-off impacts ... 87
4.5.3 Fatal and serious injury accidents resulting from landing impacts. ... 88
4.5.4 Fatal and serious injury in-flight break-ups ... 89
4.5.5 Fatal and serious injury accident with unknown causes. ... 90
4.5.6 Fatal and serious injury accident with ‘other’ causes. ... 90
5 SEPARATE EVENT ANALYSES ... 92
5.1 Agricultural fatal and serious injury accidents ... 93
5.2 Private fatal and serious injury accidents ... 95
5.3 Transport passenger fatal and serious injury accidents ... 97
6 CONCLUSION ... 100
7 APPENDIX A ... 102
1 INTRODUCTION
Accidents have been a part of aviation since well before the Wright Brothers’ first flight. These accidents fascinate as well as horrify the public. They also kill and injure people.
The mission of the New Zealand CAA is to take action that ensures people and property are not harmed or threatened by New Zealand civil aviation operations. In order to help carry out its mission the New Zealand CAA keeps a record of each accident involving a New Zealand registered aircraft and aircraft involved in New Zealand aviation. This information is stored on the CAA’s database along with other details and is used to identify trends to prevent further accidents occurring.
Without a clear understanding of the causes associated with New Zealand aviation accidents it is difficult to develop effective safety initiatives that will help reduce the number of aviation accidents.
If the causal factor chains are identified and understood by the aviation community it will allow for more preventive safety measures rather than reactionary responses. This study contains valuable data relating to fixed wing accidents, and if used correctly could reduce risk factors and increase the effectiveness of the regulator’s role by increasing safety.
2 RESEARCH OUTLINE
2.1 Objectives
The aim of this research is to examine fixed wing aviation accident data from the beginning of 1995 to the end of 2004 to identify any common active or latent failures (See Appendix B for definitions).
Fixed wing aircraft means a “power-driven heavier-than-air aircraft deriving its lift in flight chiefly from aerodynamic reactions on surfaces which remain fixed under given conditions of flight”. The sample does not include microlight aircraft, amateur built aircraft, gliders or sports category aircraft.
Fixed wing aircraft were chosen as the study sample because these aircraft represent the majority of New Zealand registered aircraft as well as a broad base of pilot skill and experience levels and a diverse range of flight operations and environments. All fixed wing accidents will be included for the first half of the study in order to provide the numbers necessary to give a meaningful sample size.
2.2 Methodology
The study is based on New Zealand fixed wing aviation accidents from 1995 to 2004. The CAA’s database will serve as the main source of data for this study. The data collected by the CAA has been gathered using CAA occurrence forms, personal interviews, and investigations. For the most part this data will be examined using a quantitative methodology and statistical analyses.
2.3 Design
This is a causal study looking at what caused New Zealand fixed wing aviation accidents between 1995 and 2004. Using a quantitative methodology the study examines variables ranging from the type of aircraft involved and operational groupings, through to pilot demographics and environmental factors.
The study is structured so that the first half looks at the variables such as pilot experience, aircraft type, time of day and day of week, fatalities and numbers of survivors, age of pilot, gender of pilot, years the licence had been held and flight currency. The first half of the study includes all fixed wing accidents.
The second half of the study groups fixed wing fatal and serious injury accidents into different causational groups and then compare finding types for those accidents. The classification scheme used to group the fatal and serious injury accidents was
3 FIXED WING AVIATION ACCIDENT DATA
3.1 General data
There were 461 fixed wing aviation accidents between 1995 and 2004 involving at least one New Zealand registered aircraft. The total number of aviation accidents (including fixed wing aircraft) for the same time period was 947. From the 461 fixed wing accidents, 55 resulted in fatalities totalling 123 persons.
Table 1 below shows the number of fixed wing and fatal fixed wing aviation accidents, their rates (defined as the number of accidents per 100,000 flight hours) and the three-year moving average for both. Figures 1 and 2 depict the rates and associated three-year moving average for each group.
Table 1:
New Zealand Fixed Wing Aviation Accidents 1995-2004
Year 1995 1996 1997 1998 1999 2000 2001 2002 2003 2004
Non Fatal Accidents 49 50 39 38 33 58 52 32 31 25
Fatal Accidents 7 5 5 5 7 3 2 6 10 4
Fatal Rate (acc/100,000 flight hr) 1.2 1.0 1.0 1.0 1.4 0.6 0.4 1.2 1.9 0.8 Total Rate (acc/100,000 flight hr) 9.7 10.9 8.5 8.4 7.8 11.8 10.9 7.7 7.9 5.7
Fatal 3-year Moving average (rate) 1.0 1.0 1.1 1.0 1.1 1.0 0.8 0.7 1.2 1.3 Total 3-year Moving average (rate) 11.9 11.3 9.7 9.3 8.2 9.3 10.2 10.1 8.8 7.1 Source: NZ CAA Database
Figure 1:
Fixed Wing Fatal Aviation Accidents per 100,000 Flight Hours 1995 to 2004 0.0 0.5 1.0 1.5 2.0 2.5 1995 1996 1997 1998 1999 2000 2001 2002 2003 2004 Year F at al A c c idents per 100,000 F light H our s Fatal Rate Fatal 3-year Moving Average
Source: NZ CAA Database
Figure 2:
Fixed Wing Aviation Accidents per 100,000 Flight Hours 1995 to 2004 0.0 2.0 4.0 6.0 8.0 10.0 12.0 14.0 19951996 1997 199 8 1999 20002001 2002 20032004 Year A c c ident s per 100, 000 F light H our s Total Rate Total 3-year Moving Average
Source: NZ CAA Database
The annual accident rate for fatal fixed wing accidents varied from a high in 2003 of 1.9 fatal accidents per 100,000 flight hours to a low of 0.4 in 2001. The average rate for fatal fixed wing accidents for the ten year study period was 1.1 accidents per 100,000 flight hours. The three year moving average for fatal accidents was almost constant from 1995 to 2000 before taking a slight dip to a low of 0.7 in 2002 and then rising sharply to finish at 1.3 in 2004.
The annual accident rate for fixed wing accidents varied from a high of 11.8 accidents per 100,000 flight hours in 2000 to a low in 2004 of 5.7 accidents per 100,000 flight hours. The average rate for fixed wing accidents during the ten year period was 8.9 accidents per 100,000 flight hours. The three year moving average for total fixed wing accidents fell from a high of 11.9 in 1995 to 8.2 in 1999, before rising again to a high of 10.2 in 2001 and then falling to 7.1 in 2004.
The average number of fixed wing aviation accidents per year during the ten year study period was 40.6, while the average fatal number was 5.5 accidents per year. Not all the fixed wing accidents took place within New Zealand airspace. A total of eight fixed wing accidents involving New Zealand registered aircraft occurred in foreign airspace. Two overseas accidents resulted in fatalities. One accident involved the death of a motor bike rider who collided with a Cresco aircraft that was
commencing its takeoff roll for agricultural operations in Malaysia. The other fatal overseas accident was the result of a ditching of a 750XL in the Pacific Ocean between Hawaii and the west coast of the USA.
One other offshore accident involved two seriously injured crew members (flight attendants) as the result of turbulence while operating in Australia.
Two fixed wing accidents involved a collision between two aircraft. Both accidents occurred while the aircraft were taxiing. One involved two Boeing 747s at Los Angeles, while the other involved a Tomahawk and another unidentified aircraft at Ardmore. There were no mid air collisions of fixed wing aircraft between 1995 and 2004.
3.2 Aircraft demographics
3.2.1 Aircraft categories
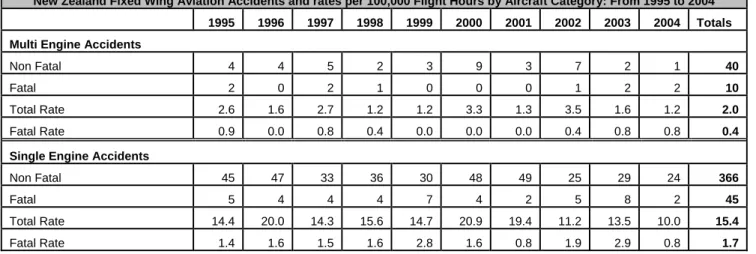
Table 2 shows the numbers and rates per 100,000 flight hours for total fixed wing aviation accidents and fatal fixed wing accidents by the category of aircraft involved. (Total flight hours have been estimated using CAA statistical returns. A ratio of those returns received against those sent out was used to achieve the total figures used in this report).
Table 2:
New Zealand Fixed Wing Aviation Accidents and rates per 100,000 Flight Hours by Aircraft Category: From 1995 to 2004
1995 1996 1997 1998 1999 2000 2001 2002 2003 2004 Totals
Multi Engine Accidents
Non Fatal 4 4 5 2 3 9 3 7 2 1 40
Fatal 2 0 2 1 0 0 0 1 2 2 10
Total Rate 2.6 1.6 2.7 1.2 1.2 3.3 1.3 3.5 1.6 1.2 2.0
Fatal Rate 0.9 0.0 0.8 0.4 0.0 0.0 0.0 0.4 0.8 0.8 0.4 Single Engine Accidents
Non Fatal 45 47 33 36 30 48 49 25 29 24 366
Fatal 5 4 4 4 7 4 2 5 8 2 45
Total Rate 14.4 20.0 14.3 15.6 14.7 20.9 19.4 11.2 13.5 10.0 15.4
Fatal Rate 1.4 1.6 1.5 1.6 2.8 1.6 0.8 1.9 2.9 0.8 1.7
Source: NZ CAA Database
Figures 3 and 4 depict total, as well as fatal, rates of fixed wing accidents per 100,000 flight hours by the different categories.
Figure 3:
Total Fixed Wing Aviation Accidents per 100,000 Flight Hours 0 5 10 15 20 25 1995 1996 1997 1998 1999 2000 2001 2002 2003 2004 Year A c c ident s per 100,000 F light H our s Multi Engine Accidents Single Engine Accidents
Figure 4:
Fixed Wing Fatal Aviation Accidents per 100,000 Flight Hours 0.0 0.5 1.0 1.5 2.0 2.5 3.0 3.5 1995 1996 1997 1998 1999 2000 2001 2002 2003 2004 Year F atal A c c ident s per 1 00, 000 F light H our s Multi Engine Accidents Single Engine Accidents
Source: NZ CAA Database
There were 10 multi engine aircraft involved in fatal accidents from 1995 to 2004. These resulted in 39 fatal injuries (an average of 4.5 deaths per accident). For the same time period there were 45 fatal single engine accidents. These resulted in 84 fatal injuries (an average of 1.9 deaths per accident).
The number of multi engine accidents per 100,000 flight hours varied from a high of 3.5 in 2002 to a low of 1.2 in 1998, 1999 and again in 2004. The fatal rate for multi engine aircraft varied during the same time period from a high of 0.9 in 1995 to a low of 0.0 in 1996, 1999, 2000 and 2001.
The number of single engine accidents per 100,000 flight hours varied from 20.9 in 2000 to 10.0 in 2004. The fatal rate for single engine aircraft during the same period varied from a high of 2.9 in 2003 to a low of 0.8 in 2001 and 2004.
3.2.2 Pilot numbers required by accident aircraft
Figures 5 and 6 below show the type of aircraft involved in fatal, as well as all, fixed wing accidents over the ten year study period. The aircraft have been grouped by the numbers of pilots needed to operate them as stipulated by the flight manual and operating procedures (some single pilot accident aircraft had two licensed pilots on board at the time of the accident – there was no evidence to suggest these flights were operating as a multi crew or had been trained to do so and therefore were grouped with the single crew aircraft).
Figure 5:
All Fixed Wing Accidents
Sorted by the Minimum Number of Pilots Required to Operate the Aircraft
Multi Crew 2%
Single Pilot 98%
Source: NZ CAA Database
Figure 6:
Fatal Fixed Wing Accidents
Sorted by the Minimum Number of Pilots Required to Operate the Aircraft
Multi Crew 7%
Single Pilot 93%
For both fatal and total fixed wing accidents, multi crew aircraft make up only a small percentage of accidents. However, it is interesting to note that multi crew aircraft make up a larger percentage of fatal accidents than for the whole fixed wing population.
Table 3 below shows fixed wing accidents per 100,000 flight hours sorted by the minimum number of pilots required to operate the aircraft.
The results of table 3 indicate that a single crew pilot is 42 times more likely to have an accident than a multi crew pilot, and 13 times more likely to have a fatal accident. Although multi crew aircraft are far less likely to have a fatal accident than a single pilot aircraft, the number of fatalities from a multi crew accident are likely to be greater due to the larger aircraft involved and the nature of the operations.
There are many possible reasons why there are fewer multi crew aircraft accidents per 100,000 flight hours than single crew aircraft accidents. Crew experience levels, available organisational resources, type of operations, operating rules, crew work loads, and flight environment are just some of the factors that must be considered when comparing multi and single crew aircraft.
Multi crew aircraft usually require more capital investment than single crew aircraft. Companies that operate multi crew aircraft usually have more funds to invest in training and safety initiatives than single crew operators. They also seek to employ more experienced crews, leaving the less experienced pilots for single crew operators to employ. Almost all multi crew aircraft are operated on IFR flight plans. The work load for pilots operating as a multi crew can also be less than that of a pilot operating solo.
It is outside the scope of this report to investigate all these contributing factors. However, it is believed that the above mentioned factors contribute towards multi crew aircraft having fewer accidents than single crew aircraft.
Table 3:
Fixed Wing Accidents/100,000 flight hours 1995-2004 Sorted by minimum number of pilots required to operate the aircraft
Total Accidents Fatal Accidents Estimated Flight Hours 95-04 Accidents/100,000 flight hours Fatal Accidents/100,000 flight hours Multi Crew 11 4 2590010 0.42 0.15 Single Crew 450 51 2565022 17.54 1.99 Totals 461 55 5155032
3.2.3 Aircraft age
The average age for New Zealand registered fixed wing accident aircraft was 26 years with a standard deviation of 12.7. The range of aircraft ages was 0 to 70 years. The average age for fatal and serious injury accident aircraft was also 26 years with a standard deviation of 12.4. The range of aircraft ages for fatal and serious injury accidents was 0 to 61 years.
Figures 7 and 8 below show the distribution of accident aircraft by age. The majority of fixed wing aircraft were between 16 and 30 years old (this holds true for both groupings).
Figure 7
Total Fixed Wing Accidents: Sorted by aircraft age
1995 to 2004 0 20 40 60 80 100 120 0-5 6-10 11-15 16-20 21-25 26-30 31-35 36-40 41-45 46-50 51-55 56-60 61-65 66-70 Aircraft age N um b er of A c c id en ts
Source: NZ CAA Database
Figure 8
Fatal and Serious Injury Fixed Wing Accidents. Sorted by aircraft age
1995 to 2004 0 5 10 15 20 0-5 6-10 11-15 16-20 21-25 26-30 31-35 36-40 41-45 46-50 51-55 56-60 61-65 Aircraft age Nu m ber of A c c ident s
Figure 9 below shows total fixed wing accidents sorted by the aircraft age and normalised against recorded flight hours between 1995 and 2004. The graph shows an increasing risk of having an accident as the age of the aircraft increases. Other variables such as the age of the pilots flying older aircraft and cause factors were not examined.
However, mechanical failures only formed a very small percentage of fixed wing accident causes between 1995 and 2004.
Figure 9
Fixed Wing Accidents/100,000 Flight Hours. Sorted by aircraft age 1995 to 2004
-200 0 200 400 600 800 0-5 6-10 11-15 16-20 21-25 26-30 31-35 36-40 41-45 46-50 51-55 56-60 61-65 66-70 Aircraft age- years
A c c ide nt s /1 00 ,0 00 F lig ht Ho ur s
3.2.4 Aircraft engine type
Figures 10 and 11 below show total and injury accidents sorted by the type of engine the accident aircraft had. In both groups the majority of aircraft had piston
reciprocating engines. There were slightly higher percentages of fatal and serious injury accidents involving turbo prop and jet turbine powered aircraft than for the total fixed wing group. The breakdown for all New Zealand registered fixed wing aircraft was: Turbo prop 9%, Jet Turbine 4%, and Piston reciprocating 87%. The representation of turbo props and jet turbine aircraft for total accidents was slightly lower than all registered aircraft. The percentage split for fatal and serious injury accidents was almost identical to that for all registered aircraft.
Figure 10:
Total Fixed Wing Accidents Sorted by engine type
1995 to 2004 Piston - reciprocating 92% Turbo-prop 6% Turbine - Jet 2%
Source: NZ CAA Database
Figure 11:
Fatal and Serious Injury Fixed Wing Accidents Sorted by engine type
1995 to 2004 Piston - reciprocating 87% Turbine - Jet 3% Turbo-prop 10%
3.3 Type of operation
3.3.1 Total accidents sorted by type of operation
Tables 4 to 7 below show fixed wing accidents by the type of operation they were conducting at the time of the accident.
Table 4:
New Zealand Fixed Wing Aviation Accidents by Operational Groups. 1995 to 2004 Operational Groups 199 5 199 6 199 7 199 8 199 9 200 0 200 1 200 2 200 3 200 4 95-04 AGRICULTURAL 11 11 7 6 7 13 17 12 12 3 99 FERRY/POSITIONING 1 1 1 1 1 1 2 8 FREIGHT ONLY 2 2 1 1 2 8
OTHER AERIAL WORK * 2 4 1 2 2 8 2 2 1 24
PRIVATE OTHER 22 21 21 22 22 26 18 13 14 16 195 TRAINING DUAL 2 2 3 5 1 5 3 4 3 3 31 TRAINING SOLO 9 4 4 5 2 5 4 4 3 40 TRANSPORT PASSENGER 10 12 7 3 5 9 1 5 3 1 56 Totals 56 55 44 43 40 61 54 38 41 29 461
* Other Aerial Work Breakdown
Advertising 1 1 Aerial Application/dropping 1 2 1 1 5 Parachuting 1 1 1 2 2 7 Experimentation 1 1 Flight Test 1 1 2 Air Ambulance 1 1 Other 1 1 2 1 5 Towing 1 1 2 Totals 2 4 0 1 2 2 8 2 2 1 24
Source: NZ CAA Database
Table 4 above shows the total number of fixed wing aviation accidents by type of operation. The category of “Other Aerial Work” has been broken down at the bottom of the table into sub-categories.
Of the eight operational groups, Private operations had the most accidents with a total of 195 between 1995 and 2004 (an average of 19.5 accidents per year) which
accounted for 42% of fixed wing accidents. Although the private operations group scored the highest number of accidents it has had a downward trend over the last four years.
The next highest group was Agricultural operations with a total of 99 for the ten year period (an average of 10 accidents per year).
When the “Other Aerial Work” category was broken down, Parachuting operations scored the highest number of accidents between 1995 and 2004 (an average of 0.7 accidents per year).
It is also worth noting that solo training operations had higher numbers than dual operations. The raw numbers of solo training accidents were 1.3 times higher than that of dual operations.
3.3.2 Fatal accidents sorted by type of operation Table 5:
New Zealand Fatal Fixed Wing Accidents by Operational Groups. 1995 to 2004 Operational Groups 199 5 199 6 199 7 199 8 199 9 200 0 200 1 200 2 200 3 200 4 95-04 AGRICULTURAL 2 1 2 1 2 2 2 1 13 FERRY/POSITIONING 1 1 FREIGHT ONLY 2 1 1 4
OTHER AERIAL WORK 1 1 2
PRIVATE OTHER 2 1 2 2 5 3 3 2 20 TRAINING DUAL 1 1 2 TRAINING SOLO 1 1 2 TRANSPORT PASSENGER 2 1 3 1 1 1 1 1 11 Totals 7 4 6 5 7 4 2 6 10 4 55
Source: NZ CAA Database
Table 5 above shows fatal fixed wing accidents by operational groups. Once again the private group generated the most accidents with a total of 20 between 1995 and 2004 (an average of 2 fatal accidents per year). Agricultural operations were the next highest with 13 fatal accidents over the ten year period and then transport passenger operations were third with 11 fatal accidents resulting in 48 deaths (an average of 4.4 deaths per accident).
3.3.3 Accident rates sorted by type of operation Table 6:
Total Fixed Wing Accident Rates Per 100,000 Flight Hours. By Operational Group 1995 to 2004 Operational Groups 1995 199 6 199 7 199 8 199 9 200 0 200 1 200 2 200 3 200 4 Averag e AGRICULTURAL 18.1 22.4 13.3 12.5 13.4 23.3 28.3 19.4 21.7 5.4 17.8 FERRY/POSITIONING 0.0 11.4 0.0 13.1 11.7 13.0 13.6 12.5 21.4 0.0 9.7 FREIGHT ONLY 0.0 0.0 10.5 0.0 0.0 0.0 10.6 5.6 5.5 12.7 4.5
OTHER AERIAL WORK 25.9 21.9 0.0 4.8 11.2 12.3 48.7 12.2 10.3 4.6 15.2
PRIVATE OTHER
107.
9 58.2 48.9 43.5 42.1 53.3 39.9 25.7 29.6 33.9 48.3
TRAINING DUAL 2.1 2.4 3.6 6.1 1.4 7.1 3.6 4.7 3.2 3.5 3.8
TRANSPORT
PASSENGER 3.5 5.6 3.2 1.4 2.2 3.8 0.5 2.6 1.4 0.5 2.5
Average 21.3 16.2 10.9 11.4 10.8 15.4 19.1 10.3 12.6 8.2 13.6
Source: NZ CAA Database
Table 6 (previous page) and Figure 12 show the total fixed wing accident rates per 100,000 flight hours by operational groups. The data shows that even when the different operational groups were normalised against the number of flight hours for that group, private operations resulted in the highest number of accidents per 100,000 flight hours (Average rate of 48.3 – almost three times the average rate of the next category).
Note:
Transport Passenger operations scored the third highest number of accidents over the ten years, but had the lowest average rate over the same time period. Solo and dual training operations had similar actual numbers of accidents, yet their rates differed significantly, with solo accident rates nearly double those of dual training operations.
Figure 12:
Fixed Wing Aviation Accidents Per 100,000 Flight Hours Sorted by Operational Group
1995 to 2004 0 10 20 30 40 50 60 AG RICUL TU RA L FE RR Y/P OS ITIO NIN G FR EIG HT ON LY OT HE R AE RIA L W OR K PR IVAT E OT HE R TR AIN ING DUA L TRA INING SO LO TR AN SPO RT PA SS EN GE R A c c ident s per 100, 000 F li ght H o urs
Source: NZ CAA Database
Table 7 and Figure 13 (next page) show the fatal rates per 100,000 flight hours for fixed wing aviation accidents involving New Zealand registered aircraft between 1995 and 2004, sorted by operational group. Private operations resulted in the highest average rate of fatal accidents at 4.7 per 100,000 flight hours. Agricultural operations were the second highest, with a rate that was less than half of that for private
operations (2.3 fatal accidents per 100,000 flight hours). Freight operations had an average rate of 2.2 fatal accidents per 100,000 flight hours. The total number of freight accidents between 1995 and 2004 was 8, with 4 of those resulting in 6 fatalities.
The lowest rate per 100,000 flight hours for fatal accidents was achieved by training flights. Transport passenger accidents had one of the highest counts of fatal
accidents, but one of the lowest rates when normalised against flight hours.
Table 7:
Fatal Fixed Wing Accident Rates Per 100,000 Flight Hours: By Operational Group 1995 to 2004 Operational Groups 199 5 199 6 199 7 199 8 199 9 200 0 200 1 200 2 200 3 200 4 Averag e AGRICULTURAL 3.3 2.0 3.8 0.0 1.9 0.0 3.3 3.2 3.6 1.8 2.3 FERRY/POSITIONING 0.0 0.0 0.0 0.0 0.0 0.0 0.0 0.0 10.7 0.0 1.1 FREIGHT ONLY 0.0 0.0 10.5 0.0 0.0 0.0 0.0 0.0 5.5 6.3 2.2 OTHER AERIAL WORK 0.0 5.5 0.0 0.0 0.0 0.0 0.0 0.0 5.1 0.0 1.1 PRIVATE OTHER 9.8 2.8 4.7 4.0 9.6 6.2 0.0 5.9 4.2 0.0 4.7 TRAINING DUAL 0.0 0.0 0.0 0.0 0.0 0.0 0.0 0.0 1.1 1.2 0.2 TRAINING SOLO 1.5 0.0 0.0 0.0 0.0 0.0 0.0 0.0 1.8 0.0 0.3 TRANSPORT PASSENGER 0.7 0.5 0.0 1.4 0.4 0.4 0.0 0.5 0.5 0.5 0.5 Average 1.9 1.3 2.4 0.7 1.5 0.8 0.4 1.2 4.1 1.2 1.6
Source: NZ CAA Database
Figure 13:
Fatal Fixed Wing Aviation Accidents Per 100,000 Flight Hours 1995 to 2004 by Type of Operation 0.0 0.5 1.0 1.5 2.0 2.5 3.0 3.5 4.0 4.5 5.0 AG RIC ULT UR AL FER RY /POS ITIO NIN G FRE IGH T O NLY OT HE R A ER IAL WO RK PR IVAT E O TH ER TR AIN ING D UA L TRA INING SO LO TR AN SPO RT P ASS ENG ER F atal A c c idents per 100, 000 F light H our s
3.4 Injuries
This Convair freight aircraft impacted with the sea off the coast of Paraparaumu in late 2003. Both crew members were killed.
3.4.1 Fatal injuries
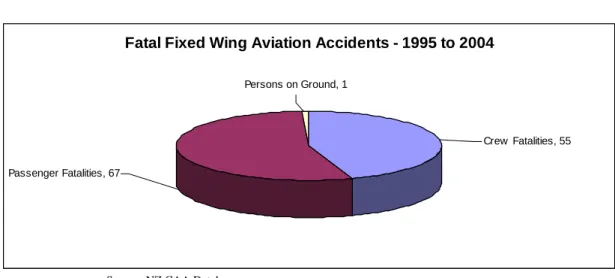
The 55 fatal fixed wing aviation accidents between 1995 and 2004 resulted in 123 fatalities. Table 8 and Figure 14 show the number of fatalities per year for crew members, passengers and persons on the ground.
Fixed Wing Aviation Fatalities 1995 1996 1997 1998 1999 2000 2001 2002 2003 2004 95-04 Crew Fatalities 8 3 5 5 7 4 2 6 11 4 55 Passenger Fatalities 10 5 6 8 11 8 0 8 9 2 67 Persons on Ground 0 0 1 0 0 0 0 0 0 0 1 Total Fatalities 18 8 11 13 18 12 2 14 20 6 123
Source: NZ CAA Database
The highest number of fatalities (20) occurred in 2003 and the lowest number (2) occurred in 2001. The average number of fatalities for the ten year period was 12.3 per year.
The one death of a person on the ground in 1997 involved a motor cyclist who rode out in front of the Cresco aircraft on take off. The propeller struck the motor cyclist who died as a result of the injuries. The accident took place in Malaysia.
There were slightly higher numbers of passenger deaths (67) when compared with crew fatalities (55).
Figure 14:
Fatal Fixed Wing Aviation Accidents - 1995 to 2004
Passenger Fatalities, 67
Crew Fatalities, 55 Persons on Ground, 1
Source: NZ CAA Database
Table 9 below shows the total number of fatalities for all aircraft classifications involving New Zealand registered aircraft between 1995 and 2004.
Table 9:
Total fatalities by Aircraft Classification: 1995-2004 Aircraft Classification Fatalities % of Total Fatalities
Fixed Wing Aeroplanes 123 56% Amateur Built Aeroplanes 13 6%
Balloons 3 1% Gliders 7 3%
Helicopters 56 25%
Microlights 18 8%
Total Fatalities 220 100%
There were 220 deaths from 114 fatal accidents (55 fixed wing fatal accidents) for all aircraft classifications between 1995 and 2004. Fixed wing aircraft fatalities represented 56% of the total fatalities, while helicopter fatal accidents contributed 25% of all fatalities. The aircraft classification with the lowest number of fatalities was balloons. The 3 balloon fatalities were the result of a single accident where the balloon was swept out to sea near Christchurch. There were 9 people on board the balloon.
Table 10 shows the frequency of fatal injuries in fixed wing fatal accidents. Seventy percent of fatal fixed wing accidents resulted in either one or two fatalities. The highest number of fatalities in a single accident was eight.
Table 10:
Fixed Wing Fatalities - by number of fatal injuries per fatal accident Number of fatalities per fatal accident Number of fatal accidents % of all fatal accidents Fatalities 1 27 49.1% 27 2 12 21.8% 24 3 7 12.7% 21 4 1 1.8% 4 5 3 5.5% 15 6 4 7.3% 24 7 0 0.0% 0 8 1 1.8% 8 Total 55 100% 123
Source: NZ CAA Database
3.4.2 Fatal injuries by aircraft category Table 11:
Fixed Wing Fatalities by Aircraft Category 1995-2004
1995 1996 1997 1998 1999 2000 2001 2002 2003 2004 95-04 Multi Engine Fixed Wing
Crew fatalities 3 0 2 1 0 0 0 1 3 3 13
Passenger fatalities 7 0 5 4 0 0 0 2 7 1 26
Total multi engine fatalities 10 0 7 5 0 0 0 3 10 4 39
Single Engine Fixed Wing
Crew fatalities 5 3 3 4 7 4 2 5 8 1 42
Passenger fatalities 3 5 1 4 11 8 0 6 2 1 41
Persons on Ground 0 0 1 0 0 0 0 0 0 0 1
Total single engine fatalities 8 8 5 8 18 12 2 11 10 2 84 Total Fatalities 18 8 12 13 18 12 2 14 20 6 123
Table 11 above and Figure 15 (next page) show the number of fatalities sorted by aircraft category. There were 10 fatal multi engined fixed wing accidents resulting in 39 fatalities (13 crew members and 26 passengers). During the same time period there were 45 fatal single engined fixed wing accidents resulting in 84 fatalities (42 crew members, 41 passengers and 1 third party fatality).
Figure 15:
Fatalities by Aircraft Category: Fixed Wing 1995 to 2004
Single Engine Fixed Wing, 84
Multi Engine Fixed Wing, 39
This Chieftain multi engine aircraft hit trees while on an instrument approach to Christchurch International Airport killing eight people and seriously injuring two (2003).
3.4.3 Fatal injuries by type of operation Table 12:
Fixed Wing Fatalities by Type of Operation: 1995-2004
199 5 199 6 199 7 199 8 199 9 200 0 200 1 200 2 200 3 200 4 95-04 AGRICULTURAL (total) 2 1 2 0 1 0 2 2 3 1 14 Crew fatalities 2 1 1 1 2 2 2 1 12
Passenger fatalities/ persons on
Ground 1 1 2
FERRY/POSITIONING (total) 0 0 0 0 0 0 0 0 1 0 1
Crew fatalities 1 1
Passenger fatalities 0
FREIGHT ONLY (total) 0 0 2 0 0 0 0 0 2 2 6
Crew fatalities 2 2 1 5
Passenger fatalities 1 1
OTHER AERIAL WORK (total) 0 1 0 0 0 0 0 0 1 0 2
Crew fatalities 1 1 2
Passenger fatalities 0
Passenger fatalities 3 6 7 7 3 1 27
TRAINING DUAL (total) 0 0 0 0 0 0 0 0 1 2 3
Instructor fatalities 1 1 2
Student fatalities 1 1
TRAINING SOLO (total) 1 0 0 0 0 0 0 0 1 0 2
Crew fatalities 1 1 2 Passenger fatalities 0 TRANSPORT PASSENGER (total) 10 5 0 11 5 2 0 6 8 1 48 Crew fatalities 3 3 1 1 1 1 10 Passenger fatalities 7 5 8 4 1 5 7 1 38 Source: NZ CAA Database
Table 12 above shows fatalities by type of operation. When examining this data it must be kept in mind that the number of fatalities per operational grouping is a function of the activity level and relative risk of that group. For example, an agricultural operation will have fewer people on board than other types such as transport passenger operations, but will have greater associated risks such as planned low flying.
The highest number of fatalities by operational group was the transport passenger group, followed closely by private operators. When looking at the split between crew and passenger fatalities, the transport category has nearly four times as many
passenger deaths compared with crew deaths, where as, private operator accidents have approximately a 50/50 split. This is to be expected given the different nature of each operation.
Although transport passenger operations had the most fatalities, this category’s rate of fatal accidents per 100,000 flight hours was among the lowest at 0.5. Private
operations scored the highest accident rate of 4.7 fatal accidents per 100,000 flight hours.
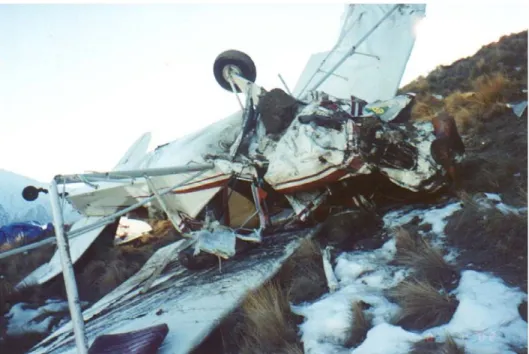
This single engined Auster aircraft was on a flight from Hokitika to Alexandra when it went missing. Both occupants were killed in the crash. (Alexandra 2002)
Figure 16 below shows the number of fatalities for fixed wing aircraft by operational groupings. Transport passenger and private operations make up over three quarters of all fatalities from fixed wing accidents over the last ten years.
Figure 16:
Number of Fatalities by Type of Operation: Fixed Wing 1995 to 2004 TRANSPORT PASSENGER , 48 TRAINING SOLO, 2 TRAINING DUAL, 3 PRIVATE OTHER, 47 FREIGHT ONLY, 6 FERRY/POSITIONING, 1 OTHER AERIAL WORK, 2 AGRICULTURAL, 14
Source: NZ CAA Database
3.4.4 Survivors
resulted in both injuries and deaths of the occupants. A total of 110 accidents involved deaths or injuries, leaving 351 fixed wing aviation accidents resulting in no deaths or injuries.
There were 123 fatalities and 141 serious or minor injuries as a result of fixed wing aviation accidents involving New Zealand registered aircraft between 1995 and 2004,. There were 26 fatal fixed wing accidents where the crew were the only occupants onboard the aircraft. (2 accidents involved aircraft with 2 or more required flight crew members).
There were 22 fixed wing fatal accidents with more than one occupant where all the crew and passengers (66 persons) were fatally injured (2 of these accidents involved crew only, where the number of crew members was greater than 1).
Photo courtesy of TAIC
This Cessna 185 Skywagon had an engine failure just after takeoff. The pilot made a forced landing which resulted in five serious injuries and one minor injury. (Motueka 2001)
The injuries other than fatalities sustained by persons involved in fixed wing accidents are shown in Table 13 below.
Table 13:
Non Fatal Injuries Resulting From Fixed Wing Aviation Accidents 1995 to 2004
Serious Minor Nil Total
Crew 29 29 366 424
Passenger 37 46 1053* 1502
Total 66 75 1419 1560
* From the total number of people involved in fixed wing aviation accidents three accidents represented 44% of the total (Boeing 747 with POB 435, Boeing 767 with POB 190 and Boeing 737 with POB of 122). From these three accidents only two people were injured.
Source: NZ CAA Database
Table 14 and Figure 16 (next page) show the severity of the injuries sustained for the 110 fixed wing accidents that resulted in injury to at least one person on board the aircraft.
Table 14:
All Fatal and Injury Accidents (110 Accidents) for Fixed Wing Aviation Accidents: 1995 to 2004 Injuries Persons Fatalities 123 Serious Injuries* 64 Minor Injuries 75 Nil Injuries* 31 Total 293 * One accident involved 2 serious injuries in a Boeing 737 with POB of
122. This accident has been excluded from these figures as the POB deviation from the mean (2.5) and the mode (1) distorted any trends associated with the data.
Source: NZ CAA Database
Fatalities and Injuries Resulting From All Fatal And Injury Fixed Wing Aviation Accidents
1995 to 2004 123 64 75 31 0 20 40 60 80 100 120 140
Fatalities Serious Injuries* Minor Injuries Nil Injuries*
Injury Level
P
er
s
ons
Source: NZ CAA Database
Table 15 below shows the severity of the injuries sustained to persons on board a fixed wing accident aircraft where at least one person on board the aircraft was killed.
Table 15:
Injuries Sustained from all Fatal Fixed Wing Accidents 1995 to 2004
Injuries Persons
Fatalities (24 were the only occupant of the aircraft) 123
Serious Injuries 26
Minor Injuries 6
Nil Injuries 1
Total 156
Source: NZ CAA Database
To assess the survivability of the fixed wing accidents that involved fatalities, the injuries sustained by persons involved in the 33 fatal accidents where there was more than one person on board the aircraft at the time of the accident are graphed in Figure 18. Accidents where people were fatally injured while outside the aircraft and those with only one person on board were not included.
Fatalities and Injuries From All Fatal Fixed Wing Aviation Accidents With More Than One Occupant
- 1995 to 2004 99 26 6 1 0 20 40 60 80 100 120
Fatalities Serious Injuries Minor Injuries Nil Injuries
Injury Level
One accident - Dash 8 had 21 POB of w hich 4 w ere killed, 14 w ere seriously injured and only 3 received minor injures.
P
er
s
ons
Source: NZ CAA Database
Figure 18 shows that the probability of coming out of a fatal fixed wing accident unharmed is low. A major contributing factor towards this is the higher speeds and therefore higher energy dissipation in an aircraft accident when compared with other forms of transport accidents.
Table 16:
Percentage of survivors in fatal fixed wing accidents where there were multiple persons on board the aircraft
1995-2004 Number of Accidents 0% 24 1-25% 2 26-50% 4 51-75% 2 76-99% 1 Total 33 Source: NZ CAA Database
Table 16 above and Figure 19 (next page) show the percentage of survivors for fatal fixed wing accidents where there was more than one person on board the aircraft at the time of the accident. Of the 33 fatal accidents, there were no survivors in 24 of them; between 1 percent and 25 percent of persons survived in 2 of the fatal
accidents; between 26 and 50 percent of persons survived in 4 of the accidents; between 51 and 75 percent of the persons on board survived in 2 of the fatal accidents and more than 75 percent of persons on board survived in only 1 accident.
Percentage of Survivors in Fatal Fixed Wing Aviation Accidents Where There Were Multiple
Persons On Board - 1995 to 2004 0 5 10 15 20 25 30 0% 1-25% 26-50% 51-75% 76-99%
Percentage of persons on-board w ho survived
N u mber of F a tal A c c idents
Source: NZ CAA Database
The aeroplane was on a private flight in the vicinity of Kaitaia. In the last few seconds of the flight the aeroplane was seen in a vertical climb, which was followed by a manoeuvre resembling a stall turn to the right, and an almost vertical dive toward the ground. The height at which the manoeuvre occurred precluded recovery before the aeroplane struck the ground. The pilot was killed. The aircraft was destroyed by impact forces and fire. CAA Occurrence Number: 00/1179
3.5 Number of fixed wing accidents by day-of-week
Figure 20 below shows all fixed wing accidents by the day of the week on which they occurred. The results have been sorted into revenue and non revenue as defined by the type of operation they were involved in during the time of the accident.
Figure 20:
Fixed Wing Aviation Accidents -1995 to 2004,
by day of week accident occurred
30 39 38 45 41 47 26 21 21 19 27 22 40 45 0 20 40 60 80 100 Mo nday Tuesd ay Wed nesd ay Thurs day Frid ay Satu rday Sund ay N u m ber of A cci dent s
Revenue Non Revenue Source: NZ CAA Database
From Monday to Saturday the number of revenue fixed wing accidents exceeded those of non revenue operations. The ratio of revenue to non revenue accidents on the days where revenue was higher was 1.6:1. Saturday was the exception with a ratio of 1.2 revenue accidents to one non revenue accident.
Saturday and Sunday combined had a ratio for revenue to non revenue accidents of only 0.86:1.
Sunday was the only day of the week where there was a higher ratio of non revenue to revenue accidents (1.7:1).
Figure 21 (next page) shows all fatal fixed wing aviation accidents by the day of the week that they occurred. The graph shows a clear increase in fatal accidents for the non-revenue group during weekends. This most likely relates to the fact that most private and non-revenue flying in New Zealand is conducted during the weekends.
Friday had the highest frequency of fatal accidents with a total of 15 fatal accidents occurring on a Friday for the ten year study period. However, the ratio of non revenue verses revenue fatal accidents on a Friday was the lowest at 0.15:1.
Figure 21:
Fatal Fixed Wing Aviation Accidents 1995 to 2004
sorted by day of week accident occurred
2 2 7 3 13 5 3 2 3 2 2 7 4 0 2 4 6 8 10 12 14 16 Mond ay Tues day We dnesda y Thur sday Frid ay Satu rday Sund ay N umber of A c c ident s
Revenue Non Revenue Source: NZ CAA Database
The New Zealand CAA does not record flight hours by the day of the week, and therefore flight hours could not be used as a measure of exposure when examining fixed wing accidents by the day they occurred. The number of occurrences recorded in the CAA’s database involving fixed wing aircraft was used to provide an indication of the level of flying activity occurring on each day of the week.
Figure 22 below shows all fixed wing occurrences recorded in the CAA’s database grouped by the day of week they occurred and revenue groups. Not all occurrences in the CAA’s database had their corresponding revenue group recorded. A simple ratio method was used against the total fixed wing occurrences to estimate the total numbers for each revenue group.
There are comparatively low numbers of non revenue occurrence reports compared to those of the revenue group. It is not certain if the difference between the occurrence groups is a true reflection, or the result of different reporting cultures between the two groups. For this reason it has been decided that only the total occurrence numbers for each day of the week will be used when comparing them against accidents on the same day.
Figure 22:
Total Fixed Wing Occurrences by Day of Week of Occurrence
1995 to 2004 0 1000 2000 3000 4000 5000
Mon Tue Wed Thu Fri Sat Sun
Day of Week N um ber of O c c ur renc es Non Revenue Revenue
Figure 23 and 24 (next page) show the percentage of total fixed wing accidents and fatal fixed wing accidents against the percentage of total reported occurrences by the day of the week they occurred.
There was a higher percentage of total fixed wing accidents on Thursday, Saturday and Sunday than percentage of reported occurrences for the same days. Saturday showed the greatest difference with 19% of all accidents occurring on that day while only 12% of occurrences were on a Saturday.
There is no positive explanation for the higher accident rate on Saturday and Sunday when compared to occurrences, although reporting habits and reduced air transport activity may be possibilities.
When comparing fatal accidents against occurrences, Friday and Saturday stand out as days where the percentage of accidents outnumbered the percentage of occurrences. Once again no positive explanation for the increased rates could be found. End of the week fatigue and increased private flying during weekends were possible causes.
Figure 23:
Percentage of Total Fixed Wing Aviation Accidents Vs Percentage of Total Occurrences 1995 to 2004 by day of week 0% 2% 4% 6% 8% 10% 12% 14% 16% 18% 20%
Mon Tue Wed Thu Fri Sat Sun
Day of the w eek
% o f t o ta l a c ci d e n ts/ o c cu rr e n ce s Accidents Occurrences
Figure 24:
Percentage of Total Fatal Fixed Wing Aviation Accidents Vs Percentage of Total Occurrences
1995 to 2004 by day of week 0% 5% 10% 15% 20% 25% 30%
Mon Tue Wed Thu Fri Sat Sun
Day of the w eek
% of to ta l ac c ide nt s /oc c u rr enc es Accidents Occurrences
Source: NZ CAA Database
The Cessna 206 had taken off at 1058 hours from Queenstown for Paraparaumu. At approximately 1145 hours the aircraft was observed executing a turn near the summit of the Lindis Pass. The aeroplane was observed to strike the valley floor in a steep, descending, left turn. The left wing struck the ground first, cart wheeling the aeroplane on to its nose, then the outboard leading edge of the right wing. The aeroplane had rotated to the left through approximately 110º from the first point of impact. The pilot and five occupants were killed as a result of the impact forces.
3.6 Accident rates by time of day
Figure 25 below shows the number of fixed wing accidents that occurred during each hour of the day.
Figure 25:
Fixed Wing Aviation Accidents - 1995 to 2004, by time of day 0 10 20 30 40 50 60 0 0 0 0 0 1 0 0 0 2 00 0 3 0 0 04 0 0 0 5 0 0 0 6 0 0 0 70 0 0 8 0 0 0 9 0 0 1 0 00 1 1 0 0 12 0 0 1 3 0 0 1 4 0 0 1 50 0 1 6 0 0 1 7 0 0 1 8 00 1 9 0 0 20 0 0 2 1 0 0 2 2 0 0 2 30 0 Hour (Local) N u m ber of A c c ide nt s
Source: NZ CAA Database
The number of fixed wing accidents showed peaks at 0900-0959, 1100-1159, 1400-1459 and 2300-2359.
Figure 26:
Fatal Fixed Wing Aviation Accidents 1995 to 2004
sorted by time of day
0 2 4 6 8 10 00 00 01 00 02 00 03 00 04 00 05 00 06 00 07 00 08 00 09 00 10 00 11 00 12 00 13 00 14 00 15 00 16 00 17 00 18 00 19 00 20 00 21 00 22 00 23 00 Hour (Local) N u mb er of A c c id e n ts
Source: NZ CAA Database
The number of fatal accidents showed peaks at 0900-0959, 1100-1159, 1400-1459 and 1900-1959.
To establish if there was any hour of the day that had a higher rate than other days, the level of activity for each hours of the day was required. This was not possible as the New Zealand CAA does not record flight hours by the time of day they occurred. Therefore, the total number of occurrences involving fixed wing aircraft was used as an approximate level of flight activity occurring during each hour of the day.
This New Zealand registered 750XL ditched in the Pacific Ocean between Hawaii and the west coast of America, killing the pilot. (2003)
Figure 27 shows the percentage of all fixed wing accidents that occurred during each hour of the day along with the percentage of fixed wing occurrences that occurred for each hour of the day during the same time period.
Figure 27:
Percentage of Total Fixed Wing Aviation Accidents Vs Percentage of Total Occurrences - 1995 to 2004 by time of day 0% 2% 4% 6% 8% 10% 12% 00 00 01 00 02 00 03 00 04 00 05 00 06 00 07 00 08 00 09 00 10 00 11 00 12 00 13 00 14 00 15 00 16 00 17 00 18 00 19 00 20 00 21 00 22 00 23 00 Hour % o f T o ta l A cci d e n ts/ O c cu rr e n ce s Accidents Occurrences
Source: NZ CAA Database
The period of time from 1100 to 1859 (daylight hours – afternoon) consists of eight consecutive hours where the percentage of accidents exceeds the percentage of
recorded occurrences. If the rate of occurrence reporting is consistent for occurrences happening at different times of the day, then during this period of the day pilots are 1.5 times more likely to be involved in an accident than at other times of the day.
3.7 Pilot demographics
As part of its normal business the New Zealand CAA collects data on pilots including date of birth, flight hours and licences held. Similar details are recorded for those pilots involved in aviation accidents. The data was collated to provide the following data groups for accident pilots as well as non-accident pilots. This enabled a
comparison between the two datasets.
• The age of the pilot at the time of the accident.
• The age of the accident pilot when they gained their pilot qualification or licence.
• The highest licence held by the accident pilot at the time of the accident.
• The total number of years that a pilot qualification had been held at the time of the accident.
• The total flying experience at the time of the accident.
• The total time on the type of aircraft involved in the accident.
• The pilot’s flight currency for the 90 days leading up to the accident.
• The accident pilot’s gender.
The pilot was on a solo circuit after being checked out by an instructor and authorised for the flight. The aircraft reached the approximate point for a turn from downwind onto base leg when it was observed to spiral out of the sky and crash into the front
3.7.1 Pilot age
Figure 28 below shows the age of all fixed wing accident pilots at the time of the accident. Of the 461 fixed wing aviation accidents between 1995 and 2004, 419 had the pilot's date of birth recorded.
Figure 28:
Fixed Wing Aviation Accidents - 1995 to 2004 by pilot age 0 20 40 60 80 100 120 16-24 25-34 35-44 45-54 55-64 65-74 75-84 85+ Age N u m ber of pi lo ts in v o lv ed i n ac c ident s
Source: NZ CAA Database
The highest number of pilots recorded was for the 25 to 34 years of age group. The lowest number of pilots was recorded for the 75 to 84 years of age group. Figure 28 shows a downward trend for fixed wing accidents as age increases.
Figure 29:
Number of Active Fixed Wing Pilots - by pilot age (December 2004) 0 500 1000 1500 2000 2500 16-24 25-34 35-44 45-54 55-64 65-74 75-84 85+ Age N um ber of pi lot s
Source: NZ CAA Database
Figure 29 above shows the total number of licensed fixed wing pilots by pilot age. Although the numbers are higher than those in Figure 28 the distribution and associated trend for the data displayed in Figure 29 is similar.
Figure 30:
Ratio of Fixed Wing Aviation Accident Pilots per 1000 Active Fixed Wing Pilots
1995 to 2004, sorted by age 0 20 40 60 80 100 16-24 25-34 35-44 45-54 55-64 65-74 75-84 85+ Age N um ber of A c c ident P ilo ts /N umber of A c tiv e P ilot s *1000
Source: NZ CAA Database
Figure 30 above shows the ratio of fixed wing accident pilots per 1000 active pilots sorted by age. The graph suggests that the risk of a pilot being involved in an aviation accident increases with age.
Note: The 75-84 age group only had 24 active pilots and 2 accidents over the last ten years. This makes a ratio of 83 in every 1000 or nearly 10% of these pilots having accidents. These numbers were considered statistically insignificant.
It is important to note that the number of pilots involved in fixed wing accidents is relatively low when compared to the whole pilot population. When these pilots were sorted into age and experience groups the numbers were even lower. Therefore, even a small change in the demographics of the accident pilots could noticeably change the risk associated with each group.
3.7.2 Pilot licence details
Figure 31 below shows the highest licence held at the time of the accident by fixed wing pilots between 1995 and 2004. A total of 389 of the 461 fixed wing accidents (84%) had licence details recorded against them. The highest licence held was not necessarily the licence that the pilot was using at the time of the accident, but does reflect the level of aviation knowledge the individual pilot had at the time of the accident.
Over half of all fixed wing accidents between 1995 and 2004 involved pilots who held a commercial pilot’s licence (CPL). Two thirds of fixed wing accidents involved pilots with professional licences (CPL or ATPL).
Figure 31:
Fixed Wing Aviation Accidents - 1995 to 2004 Sorted by Highest Licence Held at Time of Accident
ATPL (Aeroplane) 8% CPL (Aeroplane) 57% PPL (Aeroplane) 35%
Figure 32:
Number of Pilots Involved in Fixed Wing Aviation Accidents - 1995 to 2004,
sorted by age when licence was acquired
133 145 71 27 13 0 50 100 150 200 15-24 25-34 35-44 45-54 55-64
Age Licence Acquired
N u mber of P ilo ts Inv ol v ed i n A c c ident s
Source: NZ CAA Database
Figure 32 above shows the age at which the pilots involved in fixed wing accidents were when they acquired their licence. The majority of pilots involved in accidents gained their licences between the ages of 15 and 34 years.
Figure 33 below shows the age at which all pilots holding active fixed wing licences were when they acquired their licence.
The majority of pilots gained their licences between the ages of 15 and 34 years. Relatively few pilots gain licences after the age of 34 years.
Figure 33:
Pilot Age When Highest Licence was First Acquired
All Fixed Wing Pilots Holding Active Licences During Decem ber 2004
0 500 1000 1500 2000 2500 3000 15-24 25-34 35-44 45-54 55-64 65-74
Age of Pilot When issued
N um ber s of Li c en c es Is s ued
Figure 34 shows the ratio of fixed wing accident pilots per 1000 active fixed wing pilots sorted by the age they were when they first gained their highest licence. The highest ratio of 206 accident pilots per 1000 total pilots was for those pilots who gained their highest licence between the ages of 55 and 64 years. The lowest group with a ratio of 54/1000 was the 25 to 34 years group.
When examining Figure 34 it must be kept in mind that the 55 to 64 age group only had a total population of 63 pilots who gained their licences at this age and only 13 accidents over the ten years involving pilots who gained their licences between 55 and 64 years of age.
Figure 34:
Ratio of fixed wing accident pilots per 1000 active fixed wing pilots
sorted by age w hen pilot's highest licence w as issued.
0 50 100 150 200 250 15-24 25-34 35-44 45-54 55-64 65-74
Age of Pilot When issued
N umber of A c c ide nt s /A ll Li c enc es Is s ued * 1000
Source: NZ CAA Database
Figure 35:
Number of Pilots Involved in Fixed Wing Aviation Accidents -1995 to 2004, sorted by years that licence had been held
26 4 49 92 218 0 50 100 150 200 250 1-10 11-20 21-30 31-40 41-50
years licence held
N umber of pi lot s inv ol v ed in ac c idents
Figures 35 (previous page) and 36 show fixed wing accidents sorted by the number of years the pilot had held a licence before the accident. Figure 35 shows that the
majority of accidents involved pilots who had only held their licence for 10 years or less. Figure 36 below breaks the years down to single digits. This graph would suggest that the first four years of a pilots flying career are the most dangerous, with the first year after the licence is obtained posing the highest risk of having an
accident.
Figure 36:
Number of Pilots Involved in Fixed Wing Aviation Accidents -1995 to 2004, sorted by years that licence had been held
0 10 20 30 40 50 1 4 7 10 13 16 19 22 25 28 31 34 37 40 43 46 49
years Licence held
N umber of pi lot s inv ol v ed i n ac c idents
3.7.3 Pilot flight experience
Figure 37 below shows fixed wing aviation accidents sorted by the pilot’s total flying experience.
Figure 37:
Number of Fixed Wing Pilots Involved in Accidents, Sorted by Total Flying Experience. 1995-2004
0 10 20 30 40 50 60 70 80 1-49 50-99 100 -199 200 -49 9 500 -99 9 10 00-1999 20 00-4999 500 0-999 9 1000 0-14 999 15000+
Total flying experience *63 accidents had no total time recorded
N u m ber of pi lo ts
Source: NZ CAA Database
The highest group was the 200 to 499 flight hour pilots, while the lowest group was those pilots with 50 to 99 hours total flying. Between 200 and 2000 hour pilots were at the greatest risk. Most of these accidents involved commercial licence holders. Most pilots in New Zealand are under supervision until they gain a CPL at around the 200 hour mark. While under supervision pilots are limited in the risks they can take and are assisted with decision making skills such as weather interpretation and route selection.
Most career pilots will not get their first job outside of a GA Part 135 or Part 141 organisation until they have between 1500 and 2000 hours. During their time in the GA sector they are often flying single pilot aircraft which can add extra risk factors such as overload.
Figure 38 below shows fixed wing accidents sorted by pilot flight time on the type of aircraft involved in the accident. The highest number of accidents occurred where the pilot had less than 50 hours logged on that type of aircraft. There was a small peak at the 200 to 499 mark before the downward trend continued. This graph would suggest that the more time a pilot has on a certain type of aircraft the safer they are in that type. There can be a vast difference between cockpit ergonomics for different aircraft types and manufacturers. This risk factor has already been recognised by the larger airlines, where time on type is a key safety indicator.
Figure 38:
Number of Fixed Wing Pilots Involved in Accidents, Sorted by Time on Type of Aircraft involved in accident
1995 to 2004 0 20 40 60 80 100 120 1-4 9 50-99 100 -19 9 20 0-499 500 -999 1000 -199 9 200 0-49 99 5000 -999 9 100 00-1 4999 15000+ Time on Type
*65 accidents had no time on type recorded
N u mber of pi lot s