TO Eu GdP And EmPLOymEnT
EXEcUTiVE SUmmArY 4
STUDY 11
Objectives of the study 12
findings of the study 13
Organization of the report 13
chapter 1. Economic contribution of the creative industries at EU level in 2011 14
1.1 Introduction 14
1.1.1 Identification of all industry segments composing each sub-group 15
1.1.1.1 The transition between nACE Rev. 1.1 to nACE Rev. 2 15
1.1.1.2 sectors included in the core industries 16
1.1.1.3 sectors included in the non-core industries 17
1.1.1.4 Results: new scope in nACE Rev. 2 18
1.1.2 Collection of the value added and jobs figures for each relevant industry
segment in 2008 and 2011 19
1.1.3 Calculation of the economic contributions of each subgroup 19
1.2 Conclusions regarding the evolution of the contribution
of creative industries at Eu 27 level 20
chapter 2. Economic contribution of the creative industries at a national level in 2011 24
2.1 Approach 24
2.2 Conclusions regarding the evolution of the contribution
of creative industries at national levels 25
APPEnDicES 28
Appendix 1: Sectors related to creative industries (4-digit nAcE rev. 2 code) 28
1. Core industries 28
2. Additional core industries as defined by TERA 33
3. Interdependent industries 34
Appendix 2: incomplete sector – estimate of the share of the sector related
to creative industries 38
Appendix 3: Data completion methodology 39
Appendix 4: Sectors related to creative industries (3-digit nAcE rev. 2 code)
and assigned factors 40
1. Core industries 40
2. Additional core industries as defined by TERA 41
3. Interdependent industries 41
4. non-dedicated support industries 42
Appendix 5: Differences between forecast and actual figures 43
1. summary of the conclusions of 2010 TERA study 43
2. Comparison between forecast and actual figures 44
3. Evolution of Internet piracy between 2008 and 2011 47
a. Illegal file sharing technologies 48
b. Evolution of Internet traffic, by traffic type 48
c. Proportion of infringing traffic for peer-to-peer and streaming 49
d. Calculation of the illegal traffic growth and Conclusion 50
Appendix 6: comparison with other studies 51
1. uK: Creative Industries Economic Estimates – January 2014 51
2. france: first Panorama of Cultural and Creative Industries – november 2013 54 3. Culture and Creative Industries – monitoring Reports 2012 and 2010 56 4. Eu: Intellectual property rights intensive industries: contribution to economic
performance and employment in the European union – september 2013 61
LiST oF TAbLES 66
LiST oF FiGUrES 67
This is the second report published by TERA Consultant to:
• measure the economic contributions of the creative industries to the EU economy;
• Analyse the evolution of the creative industries’ contribution to EU value added and employment between 2008 and 2011.
The first report – “Building a digital Economy: The Importance of saving Jobs in the Eu’s Creative Industries” – was published in march 2010, based on 2008 data.
This study differs from earlier research by using a more accurate and comprehensive definition of Europe’s creative industries, one that expands the Eu definition of core creative industries and also encompasses the economic contributions of non-core creative industries. These non-core creative industries are suppliers to and customers of the core creative industries, and their economic strength is heavily dependent upon the core industries. This approach allows to better measure the real extent of the creative industries in the economy.
To measure the economic contributions of the creative industries to the Eu economy, measured by value added to Gross domestic Product (GdP) and by number of employees, the study considered research and statistical data developed or sponsored by Eu member nations, by the European Commission and by the World Intellectual Property Organisation (WIPO), which divides the copyright-intensive industries into four main categories: core;
inter-dependent, partial and non-dedicated support.
Based upon this methodology and 2008 figures, the first study reported the following findings:
• The core creative industries in the 27 countries of the European union were estimated to generate €558 billion in value added to GDP in 2008, approximately 4.5% of total European GDP.
• The value added by the total creative industries (core creative industries plus non-core creative industries) was approximately €862 billion in 2008, representing an estimated 6.9% share of GDP.
• The creative industries also account for a significant number of jobs throughout Europe. Employment in the core creative industries in the 27 countries of the Eu was approximately 8.5 million in 2008, or 3.8% of total European workforce.
• Employment in the total creative industries (core creative industries plus non-core creative industries) was approximately 14.4 million, or 6.5% of the total EU workforce.
The new report proposes an update of the economic contribution of creative industries to EU GDP and
employment, covering the period from 2008 to 2011, year for which Eurostat statistics are available since the end of 2013.
during this period of time, Eu countries have faced a major economic and financial crisis. In the meantime the use of digital media have continuously expanded which allows creative industries developing new business models for the digital environment, such as online music platforms and video on demand.
dealing with these transformations, the regulatory environment has not significantly changed, particularly regarding the fight against piracy, either at Eu level or in the largest countries, with the exception of france with the effective implementation of the notice sending system through the creation of the french high authority hAdOPI. In the uK and spain the adoption of new legislations – dEA for the uK and sIndE for spain – did not translate so far into a real and effective implementation, although these legislations were adopted back in 2010 and 2011.
In the same time, the online music and video platforms have expanded throughout Europe offering to European citizens and consumers a wide range of legal access to an increasingly important repertoire at a competitive and accessible price.
Key findings are the followings:
• In 2011, the core creative industries in the 27 countries of the European union generate €558 billion in value added to GDP, approximately 4.4% of total European GDP.
• The value added by the total creative industries (core creative industries plus non-core creative industries) is approximately €860 billion, representing a 6.8% share of GDP.
• The creative industries represent approximately 8.3 million full time equivalent jobs, or 3.8% of total
European workforce.
• Employment in the total creative industries (core creative industries plus non-core creative industries) is approximately 14.0 million, or 6.5% of the total EU workforce.
Table 1: Economic weight of the creative industries in EU27 (2011)
Table 2: Evolution of value added and employment 2008/2011
note: due to rounding, numbers presented throughout this document may not add up precisely to the totals provided.
VA (billion €)
Source – 2013 TERA Consultants analysis
creative industries
core
ToTAL creative industries interdependent
non dedicated support
VALUE ADDED EmPLoYmEnT
Jobs (million) % of evolution 2008-2011 % of EU VA % of evolution 2008-2011 % of EU employment 558 -0.07% 4.40% 8.3 -2.33% 3.82% 211 -1.18% 1.67% 4.0 -3.88% 1.86% 91 0.58% 0.72% 1.7 -1.19% 0.78% 860 -0.28% 6.79% 14.0 -2.65% 6.47% billion €
Source – 2013 TERA Consultants analysis
creative industries
core
ToTAL creative industries interdependent
non dedicated support
VALUE ADDED - 2008/2011 EVoLUTion EmPLoYmEnT - 2008/2011 EVoLUTion
% of growth
% of growth million of jobs
0,0 0.0% -0.2 -2.4%
-2.0 -0.9% -0.2 -4.8%
1.0 1.1% 0 0.0%
In terms of value added, the economic contribution of the creative industries has been rather stable in Europe between 2008 and 2011. however, this overall stability hides a strong heterogeneity within the different sub-groups, which can be explained by the variety of the underlying drivers of growth.
• Within the core creative industries, there is a decrease in all activities except for Tv broadcasting and movie production. On the contrary, ICT-related activities included in the core post a significant growth, mostly driven by web development, data hosting and processing and computer software programming.
• The Interdependent sub-group, which mostly includes retail related activities, experienced a limited decline that can be explained by the broader decline of the retail sector at least in the Western part of Europe. • Lastly, the non-dedicated sub-group has experienced a modest growth throughout the 2008-2011 period, following the overall stability of the Telecom sector in Europe.
for all sectors, the economic contribution of the creative industries in terms of job creation has been weaker than the contribution in terms of GdP.
• The overall tendency has been the destruction of jobs within most sub-groups, particularly for the traditional core activities, for which job destruction has been particularly significant.
• The diverging tendencies between GdP and employment growth are illustrating a change in the productive system of the creative industries, which rely more on capital (particularly ICT-type of capital investment) than on labour.
In addition to the Pan-European picture, this report includes an estimate of the economic contribution of the creative industries for the five largest European countries (uK, france, Germany, Italy and spain).
Table 3 shows the weight of the creative industry (contribution of the creative industries divided by the contribution of all industries), in terms of value added and of employment, in the economy of each of the five countries.
Table 3: Economic weight of the creative industries in the main European markets (2011)
VA Jobs VA Jobs VA Jobs VA Jobs VA Jobs VA Jobs
Source – TERA Consultants analysis
creative industries
core
interdependent & support ToTAL creative industries creative GDP (billion€)
creative employment (million)
5 coUnTriES UK FrAncE GErmAnY iTALY SPAin
5.8% 3.2% 9.0% 159 5.1% 2.7% 7.9% 152 3.9% 2.1% 6.1% 159 3.9% 2.2% 6.1% 95 3.4% 1.7% 5.0% 53 5.4% 3.6% 9.0% 2.6 3.7% 2.6% 6.3% 1.6 4.1% 2.9% 7.0% 2.8 3.7% 2.5% 6.2% 1.4 3.4% 2.2% 5.6% 1.0 4.5% 2.4% 6.9% 618 4.1% 2.8% 7.0% 9.5
Table 4 shows the evolution, between 2008 and 2011, of the weight of the creative industry in these five countries in terms of value added and of employment.
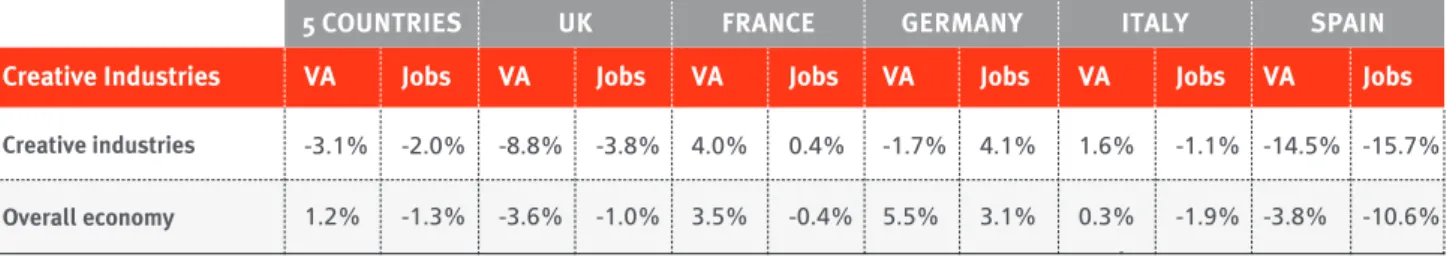
Table 4: Evolution of the economic contribution of the creative industries in the main European markets (2008-2011)
• Overall, creative industries in the top 5 European countries have posted a stronger decrease than the overall economy;
• The decrease of the creative industries has proved much stronger in the “centre” (the five biggest economies of the Euro zone) than in the “periphery” (the other 22 countries), both at the value added and at
the employment level;
• It has generally been stronger in terms of added value than in terms of jobs, which could be explained by an increase in payroll per euro sold and / or deterioration in corporate earnings.
• The overall declining trend in Europe top 5 hides a strong heterogeneity between countries:
o The economic weight of the creative industries has decreased in the uK, in spain, and in Germany (in terms of value added);
o On the contrary, the creative industries have grown in france and Italy.
• Again, the explanation for this heterogeneity of trends must be multifactorial. It is however possible to underline the correlation between the growth of the creative industries and the IP protection legislation. Thus, france has established some form of response to Internet piracy before 2011 with the notice sending system implemented by hAdOPI. The cultural industries in france have posted a much better dynamic during the period studied than in countries where such measures do not exist.
In its first report released in 2010 TERA Consultant had forecasted the impact of digital piracy in Europe, in terms of employment, if no legislative action was taken.
The initial study concluded that based on current projections and assuming no significant policy changes, the European union’s creative industries could expect to see, depending on scenarios, cumulative retail revenue losses between €166 billion and €240 billion by 2015, resulting in jobs lost between 600,000 and 1.2 million by 2015. using the actual 2011 figures, we can now have a first look at the real trends at work based on real figures in the top 5 European countries that have posted a stronger decrease than the overall economy, and see how it compares to initial forecast.
VA Jobs VA Jobs VA Jobs VA Jobs VA Jobs VA Jobs
Source – TERA Consultants analysis
creative industries
creative industries overall economy
5 coUnTriES UK FrAncE GErmAnY iTALY SPAin
-8.8% -3.6% 4.0% 3.5% -1.7% 5.5% 1.6% 0.3% -14.5% -3.8% -3.8% -1.0% 0.4% -0.4% 4.1% 3.1% -1.1% -1.9% -15.7% -10.6% -3.1% 1.2% -2.0% -1.3%
france, Germany, Italy, spain and the uK represent 72% of the total Eu creative industries’ value added and 68% of the employment.
In the top five European countries:
• real value added destruction amounts to €20 billion;
• real job losses in the creative industries between 2008 and 2011 amount to 189,633.
however, in order to measure the impact piracy has had on value added and job destruction, it is necessary to estimate how economic contribution and employment would have evolved in the creative industries, absent all piracy
(“counterfactual” scenario).
In a first stage of analysis, one can consider that, absent piracy, the value added and employment in the creative industries would have evolved as in the overall economy or as in the service industries1.
Between 2008 and 2011, total economic contribution has increased by 1.2% and total employment has decreased by 1.3%. While economic contribution of services industries has increased by 3.1% and employment in service activities has increased by 7.9%.
using this as an estimate of the counterfactual scenario, it means that:
• The real value added destruction between 2008 and 2011 in the top five European countries, would be
in the range of €27.1 and €39.7 billion;
• The job destruction between 2008 and 2011 in the top five European countries would be comprised
between 64,089 and 955,125.
Table 5: The impact of piracy on value added destruction (in € billion) in the five main European countries between 2008 and 2011 (new estimate)
1In its Green Paper “unlocking the potential of cultural and creative industries”, the Commission states that the growth of cultural and creative industries could be comparable to the service economic sector: Cultural and creative industries are recognized as growth sectors in the above mentioned Commission Consultation Paper as well as in the Commission staff Working document «Challenges for Eu support to innovation services – fostering new markets and jobs through innovation» – sEC (2009) 1195.
2008 2008 2011 2011 2008-20112008/2011 2008/2011
Source – TERA analysis creative industries – factual
overall economy
creative industries – counterfactual 1 impact of piracy – counterfactual 1 Service industries
creative industries – counterfactual 2 impact of piracy – counterfactual 2
617.9 9 008.9 645.0 2 608.5 657.6 -19.8 102.9 7.4 -27.1 79.2 20.0 -39.7 -3.1% +1.2% +1.2% +3.1% +3.1% 637.6 8 906.1 637.6 2 529.3 637.6
Table 6: The impact of piracy on job losses in the five main European countries between 2008 and 2011 (new estimate)
The comparison of these real figures with our initial forecast in 2010 yields the conclusion that, for the five central European countries, the forecast of the initial study have proved accurate:
• The actual job losses encompasses the initial study’s estimates;
• The assumptions of scenario 2 are globally consistent with the way Internet piracy evolved between 2008 and 2011.
These numbers are very close from the scenarios we had elaborated in our previous report published in march 2010 calculating the piracy impact up to 2011 and lead to new estimates as follows:
• A value destruction in the range of €27.1 and €39.7 billion between 2008 and 2011, which added to €7.4 billion as a base for 2008 leads to a cumulative value destruction in the range of €34.5 and €47.1 billion;
• A cumulative job loss in the range of 204,089 and 1,095,125 at the end of 2011, as a result of the addition of the job losses in 2008 (140,000) and the job losses between 2008 and 2011 (between 64,089 and 955,125). In conclusion, creative industries in Europe represent in 2011 a significant share of GDP (6.8%) and employment (6.5%) but report significant value destruction (unlike the overall trend of the economy) and noticeable decrease in employment in the main five markets between 2008 and 2011.
The comparison of these real figures with our initial forecast highlights the obvious negative effect of piracy
on value and employment in the creative sector, which has a real potential for growth at the digital era,
and for sustainable international specialization of Europe in a globalized economy, in addition to its importance for reflecting the richness of the European culture and diversity.
2008 2011 2008/2011 2008/2011
Source – TERA analysis creative industries – factual
overall economy
creative industries – counterfactual 1 impact of piracy – counterfactual 1 Service industries
creative industries – counterfactual 2 impact of piracy – counterfactual 2
9 459 415 135 664 400 9 523 504 49 031 776 10 414 540 -189 633 -1 788 400 -125 544 - 64 089 3 603 943 765 491 -955 125 -2.0% -1.3% -1.3% +7.9% +7.9% 9 649 048 137 452 800 9 649 048 45 427 833 9 649 048
study
ThE Economic conTribUTion
Of ThE CREATIvE IndusTRIEs
TO Eu GdP And EmPLOymEnT
Of ThE CREATIvE IndusTRIEs
TO Eu GdP And EmPLOymEnT
EvOLuTIOn 2008-2011
objectives of the study
TERA Consultants proposes an updated version of the first study published in 2010 to measure the evolution of the economic contribution of creative industries to EU GDP and employment between 2008 and 2011, year for which Eurostat statistics are available since november 2013.
This update will allow:
• first, to capture the major evolutions, which occurred at Eu level (in the 27 member states) and particularly in the five largest markets (france, Germany, Italy, spain, uK), which collectively represent over 70% of European GdP;
• Explore and provide explanations on the relevant evolutions;
• Complement the report that the Office for harmonization in the Internal market (OhIm), acting through the European Observatory on Infringements of Intellectual Property Rights, and the European Patent Office (EPO) have carried out in co-operation with the Eu Commission, in particular dG Internal market and services and Eurostat. This report quantify the overall contribution made by IP-intensive industries to the Eu economy, in terms of output, employment, wages and trade, taking into account the major IP rights (patents, trademarks, designs, copyrights, geographical indications).
from a methodology standpoint, it is worth to mention that TERA Consultant’s methodology used for the previous study has been confirmed by the OhIm and EPO report, which follows the same methodology to assess the footprint of the IPR intensive industries in Europe and set the stage for a common language to evaluate the importance of these industries in terms of revenues, jobs and contribution to Eu GdP.
Findings of the study
• In 2011, the core creative industries in the 27 countries of the European union generate €558 billion in value added to GDP, approximately 4.4% of total European GDP.
• The value added by the total creative industries (core creative industries plus non-core creative industries) is approximately €860 billion, representing a 6.8% share of GDP.
• The creative industries represent approximately 8.3 million full time equivalent jobs, or 3.8% of total
European workforce.
• Employment in the total creative industries (core creative industries plus non-core creative industries) is approximately 14,0 million, or 6.5% of the total EU workforce.
This apparently rather stable picture of the economic contribution of the creative industries in Europe between 2008 and 2011 hides a strong heterogeneity:
• Within the core creative industries, we see a decrease in all activities except for Tv broadcasting and movie production. On the contrary, ICT-related activities included in the core post a significant growth, mostly driven by web development, data hosting and processing and computer software programming.
• The Interdependent sub-group, which mostly includes retail related activities, experienced a limited decline that can be explained by the broader decline of the retail sector at least in Western Europe.
• Lastly, the non-dedicated sub-group has experienced a modest growth throughout the 2008-2011 period, following the overall stability of the Telecom sector in Europe.
organization of the report
The current report is organized as follows:• Chapter 1 deals with the 2011 update of the figures at the European level.
TERA had defined in its initial study published in march 2010 a segmentation of the creative industries in two groups: • Core creative industries;
• non-core industries including “Interdependent industries” and “non-dedicated support industries”. The core creative industries produce and distribute creative products aimed at mass reproduction, mass
dissemination and exports. These “core industries” include film and video, videogames, broadcasting, music, books and press publishing. In addition to those industries, TERA also added other relevant sectors that were considered as major contributors to the creative economy (software, databases, printing activities and online distribution of content).
The non-core creative industries are related to a lesser extent on copyright-protected materials but include: • Interdependent industries engaged in the production, manufacture and sale of equipment whose function is to facilitate the creation, production or consumption of cultural products. They include for instance the manufacturing, wholesale and retail sale of television sets, radios, Cd players, dvd players, electronic games equipment, computers, musical instruments, blank recording material, paper, photocopiers, and photographic and cinematographic
instruments;
• The non-dedicated support industries engaged in the broadcast, communication, distribution or sales of the cultural products. They include a fraction of general wholesale and retailing, general transportation, telephony and the Internet.
The aim of this report is to update the economic weight of each of those two groups in terms of GdP and job. for that purpose, we will follow a bottom-up approach that can be divided in three steps:
• Identification of all industry segments (in nACE Rev. 2 classification) composing each sub-group; • Collection of the value added and jobs figures for each relevant industry segment;
• Computation of the economic weight of the creative industries at Eu level in 2011.
In terms of data, our estimate will exclusively rely on Eurostat Structural business Statistics (hereafter “sBs”2)
for 2011 - last available year at the time of the completion of this report.
2To the European Commission, “structural business statistics (sBs) cover industry, construction, trade and services. Presented according to the nACE activity classification, they describe the structure, conduct and performance of businesses across the European union (Eu) – data are available for the Eu-27 and for the member states. The statistics can be broken down to a very detailed sectoral level (several hundred economic activities).”
3 http://epp.eurostat.ec.europa.eu/statistics_explained/index.php/Glossary:value_added_at_factor_cost 4 http://epp.eurostat.ec.europa.eu/statistics_explained/index.php/Glossary:Employee_-_sBs
1.1.1 Identification of all industry segments composing each sub-group
1.1.1.1 The transition between nAcE rev. 1.1 to nAcE rev. 2The economic contribution of the creative industries is based upon two main indicators:
• The value added at factor cost, that is: “The gross income from operating activities after adjusting for operating subsidies and indirect taxes3”.
• The number of employees, where an “employee is a person who works for an employer on the basis of a contract of employment and receives compensation in the form of wages, salaries, fees, gratuities, piecework pay or remuneration in kind. The contract is an agreement between an enterprise (the employer) and a person (the employee), which may be formal or informal, normally entered into voluntarily by both parties, whereby the person works for the enterprise in return for compensation in cash or in kind.
A worker is considered to be an employee of a particular unit if he or she receives a wage or salary from the unit regardless of where the work is performed (even from remote locations). A worker from a temporary employment agency is considered to be the agency’s employee and not that of the business unit to which he or she is assigned4”.
These indicators are available in the Structural business Statistics (sBs) published by Eurostat. They cover industry, construction, trade and services and are presented according to the nACE (statistical classification of economic activities in the European Community) activity classification.
The nACE classification system provides the framework for collecting and presenting a large range of statistical data related to economic activity (e.g. production, employment and national accounts).
since the completion of the initial study published in march 2010, the nACE classification has changed from nACE Rev. 1.1 to nACE Rev. 2. Certain nACE 1.1 codes have been merged into a bigger nACE 2 codes, on the contrary, other nACE 1.1 codes have been split into several smaller nACE 2 codes. In that later case, sBs unfortunately does not precise the allocation key that has been used to split a nACE 1.1 sector into several nACE 2 sectors. In order to keep the same exact perimeter for the creative industries, we therefore had to identify as closely as possible the list of nACE 2 codes that matches the nACE 1.1 codes that composed our 4 sub-groups.
using the Eurostat correspondence table between nACE Rev 1.1 and nACE Rev. 25 , it is possible to sort nACE 2
sectors into three categories:
• some nACE 2 codes come from one or several nACE 1 codes that were all outside of the “Creative Industries” perimeter as defined in our initial study. These codes are therefore excluded from the updated study.
• some nACE 2 codes come from one or several nACE 1 codes that were all included in the “Creative Industries” perimeter. These “complete” sectors should therefore be included in the updated study.
• The situation is more complex for all nACE 2 sectors that have antecedents both inside and outside the perimeter of the initial study. These “incomplete” sectors should be dealt with more attention.
The way each type of nACE 2 codes will be taken into account is described below, depending on the sub-group it belongs to.
1.1.1.2 Sectors included in the core industries
In order to determine the proportion of each “complete” and “incomplete” nACE 2 codes that should be included in the 2011 perimeter, we used the “Intellectual property rights intensive industries: contribution to economic performance and employment in the European union”6 report from the European patent office and the office for
harmonization in the internal market (hereafter OhIm-EPO).
The OhIm-EPO study lists a wide number of nACE 2 Codes and assigns a “creative factor” to each of them, so as to measure the proportion of its activity that is IP related7.
Based upon these creative factors, we have weighted the various relevant nACE 2 codes as follows: for complete sectors:
• sectors with a small creative factor less than 33% are considered essentially non-creative. They are therefore only partially included in the updated study, using the same weighting factor as for the non-dedicated support industries (7%). see 1.1.1.3.2 for more details;
• Other sectors are considered creative, and are totally (100%) included in the updated study.
5 In order to have the best accuracy we worked with the most detailed level of the nACE classification (4-digit nACE code).
6 Available at: Intellectual property rights intensive industries: contribution to economic performance and employment in the European union.
7 The computation of the creative factors is based on the methodology of a previous study by the World Intellectual Property Organisation (hereafter WIPO) available at the following address: Guide on surveying the economic contribution of the copyright-based industries
incomplete sectors have been totally excluded from the updated study.
Concerning the creative sectors added by TERA in the original study, the following course of action was taken: • complete sectors are totally included in the updated study;
• Each incomplete sector is totally included in the updated study if a great number of its antecedents are included in the initial study (see Appendix 2), and if it belongs to the core copyright industry in the OhIm-EPO study. In all other situations, the industry code is totally excluded.
1.1.1.3 Sectors included in the non-core industries
1.1.1.3.1 interdependent industries
complete sectors are totally included in the updated study.
for incomplete sectors, the sector is totally included in the updated study if a great number of its antecedents are included in the initial study (see Appendix 2 for details); if it belongs to the non-core copyright industry in the OhIm-EPO study; if it is not already in the core industries or in the non-dedicated support industries (in order to avoid double counting); if one of the antecedents of the sector is the sector 51.5 in nACE Rev. 1.1 we used the same methodology as in the previous study and applied a weighting factor of 9%.
In all other situations, the industry code is totally excluded.
1.1.1.3.2 non-dedicated support industries
non-dedicated support industries are taken into account using a two steps process:
• A list of complete and incomplete sectors are first identified and weighted using the same approach as for the “interdependent industries”;
• following the methodology used in the initial study, an additional weighting factor, called “copyright factor” is then applied to all relevant nACE 2 codes. As expressed in the initial study: “This copyright factor is calculated on the sum of the value added for all other copyright-based industries (core and interdependent) to GdP minus the transportation trade and telecommunication sectors (i.e. the non-dedicated industries). This weighting is built on the assumption that the proportionate contribution of the copyright-based industries to the total distribution industry value added (transportation and trade sectors) is the same as the percentage contribution of the copyright industries to the total non-distribution industries”. We used the same copyright factor as in the initial study: 7.1% for the value added and 6.7% for the employment.
1.1.1.4 results: new scope in nAcE rev. 2
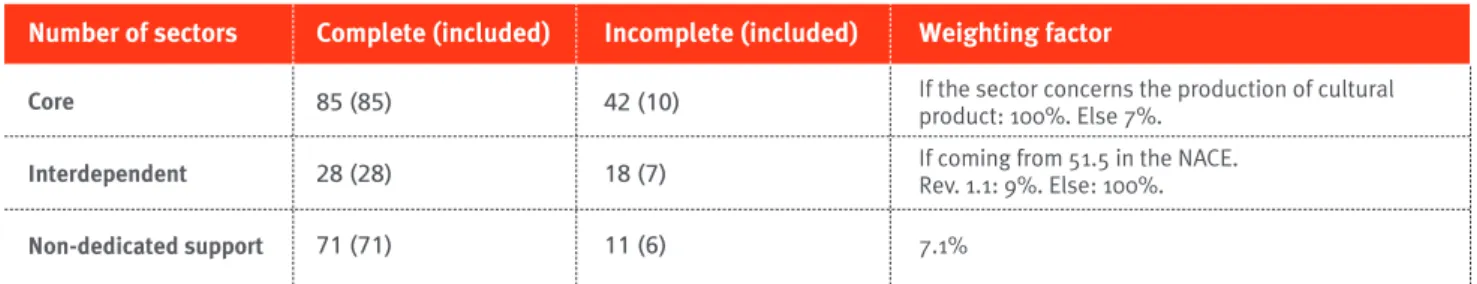
figures 1 and 2 below summarize the number of codes that we have included in each sub-group, and the weighting factor used both for the value added and for the jobs.
Table 7: number of sectors in nAcE rev. 2 included in the updated study – Value Added
Table 8: number of sectors in nAcE rev. 2 included in the updated study – Employment
The complete list of sectors in nACE Rev. 2 included in the updated study is presented in the Appendix 4: sectors related to Creative industries (3-digit nACE Rev. 2 code) and assigned factors.
complete (included)
complete (included) number of sectors
number of sectors
Weighting factor
creative factor for included sectors incomplete (included)
incomplete (included)
Source – TERA Consultants analysis
Source – TERA Consultants analysis core interdependent non-dedicated support core interdependent non-dedicated support 42 (10) 18 (7) 11 (6) 61 (10) 18 (7) 11 (6)
If the sector concerns the production of cultural product: 100%. Else 7%.
If coming from 51.5 in the nACE. Rev. 1.1: 9%. Else: 100%. 7.1%
If the sector concerns the production of cultural product: 100%. Else 7%
If coming from 51.5 in the nACE Rev 1.1: 9%. Else: 100%. 6.7% 85 (85) 28 (28) 71 (71) 41 (41) 28 (28) 71 (71)
1.1.2 Collection of the value added and jobs figures for each relevant industry segment
in 2008 and 2011
Eurostat’s sBs database is incomplete and does not always provide the value added at factor cost and the number of employees at the European level for all relevant nACE sectors. The missing data have been estimated using the methodology described below (and detailed in Appendix 3: data completion methodology):
• Whenever possible, we have used accounting equalities to calculate missing data. for instance if sector X includes two sub-sectors X1 and X2, and if the data for X and X1 are provided whereas X2 is missing, we can easily deduce the value by calculating X2=X-X1. 12% of data have been inferred that way in the new study; • In other cases, the data have been estimated using historical data. 10% of the data have been inferred this way in the new study.
from a geographical standpoint, our scope encompasses all Eu 278. however, in 2011 the pan European data
provided by the sBs database included 28 countries (Eu 27 plus Croatia, which joined the Eu on July 2013). for our calculations, we therefore used the Eu28 aggregated data and subtracted the Croatian data.
As a result of the collection phase, we managed to establish the economic contribution of each sub-group, defined in nACE 2 terms, for 2008 and 2011.
1.1.3 calculation of the economic contributions of each subgroup
As a result of the change in the nACE codes standard perimeter of the creative industries in 2008 is not exactly the same when using nACE 1.1 and nACE 2 codes. for that reason, it would be incorrect to simply compare the creative industry’s contribution in 2008, as calculated in our previous study using nACE 1.1 data, with its contribution in 2011 calculated using nACE 2 data.
8 Belgium, denmark, france, Germany, Greece, Ireland, Italy, Luxembourg, netherlands, Portugal, spain, united Kingdom, Austria, finland, sweden, Cyprus, Czech Republic, Estonia, hungary, Latvia, Lithuania, malta, Poland, slovakia, slovenia, Bulgaria, Romania.
In order to stick as much as possible with our original perimeter, the methodology used to calculate the 2011 contribution of each sub-group is the following:
• use the nACE 2 data for 2008 and 2011 to compute an annual growth rate for each sub-group, and for each indicator (jobs and value added at factor cost) between 2008 and 2011;
• Apply this growth rate to the 2008 value calculated in the initial study so as to evaluate the 2011 economic contribution.
Even if there are some differences in absolute terms between the nACE 1.1 and nACE 2 perimeters, the assumption that the growth rate of each sub-group between 2008 and 2011 barely varies is very conservative. The methodology described above is therefore the most robust we could use considering the difficulties related to the change in the statistical standards between 2008 and 2011.
The results of our analyses are summarized in the following tables:
• Table 9 displays the main results of the previous TERA study at Eu 27 level.
• Table 10 shows our new estimate for the contribution of the creative industries in terms of value added and number of employee in 2011.
• Table 11 shows the evolution at the Eu 27 level in absolute and relative terms between 2008 and 2011.
Table 9: Economic weight of the creative industries in EU 27 (2008)
1.2 concLUSionS rEGArDinG ThE EVoLUTion oF ThE conTribUTion
oF crEATiVE inDUSTriES AT EU 27 LEVEL
VA (billion €)
Source – 2010 TERA Consultants study
creative industries
core
ToTAL creative industries interdependent
non dedicated support
VALUE ADDED EmPLoYmEnT
% of EU employment % of EU VA Jobs (million) 558 4.46% 8.5 3.82% 213 1.71% 4.2 1.89% 90 0.72% 1.7 0.77% 862 6.89% 14.4 6.48%
Table 10: Economic weight of the creative industries in EU 27 (2011)
Table 11: Evolution of value added and employment 2008/2011
The analysis of the data presented above calls for a few comments:
• In terms of value Added, the economic contribution of the creative industries has been rather stable in Europe between 2008 and 2011. however, this overall stability hides a strong heterogeneity within the different sub-groups, which can be explained by the variety of the underlying drivers of growth.
Within the core creative industries, we see a decrease in all activities except for Tv broadcasting and movie production (see figure 1 below).
VA (billion€)
Source – 2013 TERA Consultants analysis
creative industries
core
ToTAL creative industries interdependent
non dedicated support
VALUE ADDED EmPLoYmEnT
Jobs (million) % of evolution 2008-2011 % of EU VA % of evolution 2008-2011 % of EU employment 558 -0.07% 4.40% 8.3 -2.33% 3.82% 211 -1.18% 1.67% 4.0 -3.88% 1.86% 91 0.58% 0.72% 1.7 -1.19% 0.78% 860 -0.28% 6.79% 14.0 -2.65% 6.47% billion€
Source – 2013 TERA Consultants analysis
creative industries
core
ToTAL creative industries interdependent
non dedicated support
VALUE ADDED - 2008/2011 EVoLUTion EmPLoYmEnT - 2008/2011 EVoLUTion
% of growth
% of growth million of jobs
0,0 0,0% -0,2 -2,4%
-2,0 -0,9% -0,2 -4,8%
1,0 1,1% 0 0,0%
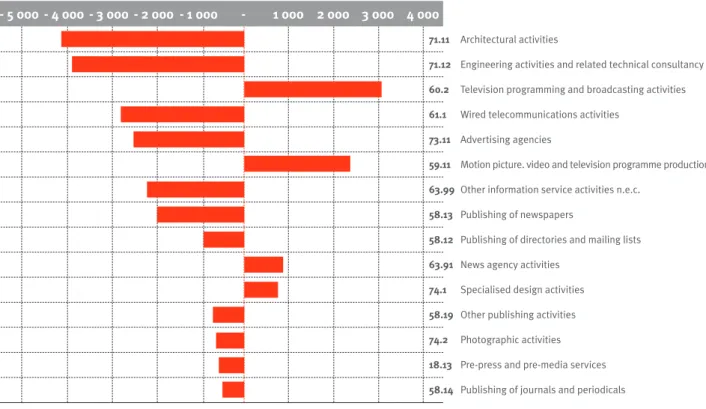
Figure 1: Evolution of the value added for the core creative activities 2008 – 2011 (in billion €)
On the contrary, ICT-related activities included in the core post a significant growth, mostly driven by web development, data hosting and processing and computer software programming.
Source – 2013 TERA Consultants analysis
- 5 000 - 4 000 - 3 000 - 2 000 - 1 000 - 1 000 2 000 3 000 4 000
71.11 Architectural activities
71.12 Engineering activities and related technical consultancy 60.2 Television programming and broadcasting activities 61.1 Wired telecommunications activities
73.11 Advertising agencies
59.11 motion picture. video and television programme production activities 63.99 Other information service activities n.e.c.
58.13 Publishing of newspapers
58.12 Publishing of directories and mailing lists 63.91 news agency activities
74.1 specialised design activities 58.19 Other publishing activities 74.2 Photographic activities 18.13 Pre-press and pre-media services 58.14 Publishing of journals and periodicals
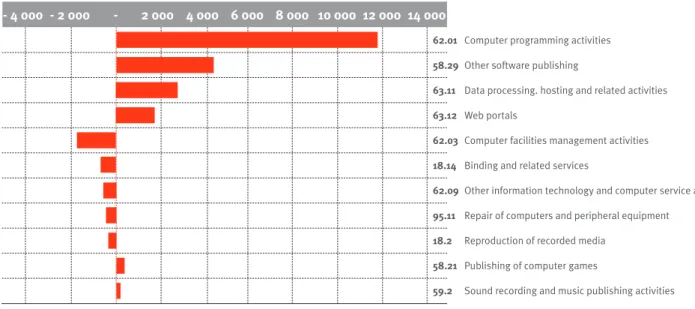
Figure 2: Evolution of the value added of the main “iT related” 2008 – 2011 (in billion €)
The Interdependent sub-group, which mostly includes retail related activities, experienced a limited decline that can be explained by the broader decline of the retail sector at least in Western Europe.
Lastly, the non-dedicated sub-group has experienced a modest growth throughout the 2008-2011 period, following the overall stability of the Telecom sector in Europe.
for all sectors, the economic contribution of the creative industries in terms of job creation has been weaker than the contribution in terms of GdP. The overall tendency has been the destruction of jobs within most sub-groups, particularly for the traditional core activities, for which job destruction has been particularly significant.
The diverging tendencies between GdP and employment growth are illustrating a change in the productive system of the creative industries, which rely more on capital (particularly ICT-type of capital investment) than on labour.
Source – 2013 TERA Consultants analysis
- 4 000 - 2 000 - 2 000 4 000 6 000 8 000 10 000 12 000 14 000
71.11 Architectural activities
71.12 Engineering activities and related technical consultancy 60.2 Television programming and broadcasting activities 61.1 Wired telecommunications activities
73.11 Advertising agencies
59.11 motion picture. video and television programme production activities 63.99 Other information service activities n.e.c.
58.13 Publishing of newspapers
58.12 Publishing of directories and mailing lists 63.91 news agency activities
74.1 specialised design activities 58.19 Other publishing activities 74.2 Photographic activities 18.13 Pre-press and pre-media services 58.14 Publishing of journals and periodicals
62.01 Computer programming activities 58.29 Other software publishing
63.11 data processing. hosting and related activities 63.12 Web portals
62.03 Computer facilities management activities 18.14 Binding and related services
62.09 Other information technology and computer service activities 95.11 Repair of computers and peripheral equipment
18.2 Reproduction of recorded media 58.21 Publishing of computer games
In addition to the Pan-European picture, the previous study included an estimate of the economic contribution of the creative industries for the five largest European countries (uK, france, Germany, Italy and spain). This report aims at updating these figures for the same five countries.
The approach followed for that purpose is perfectly comparable to the approach used at the European level: • Identification of all sectors included in the four sub-groups of the creative industries (in nACE Rev. 2 classification); • Calculation of the 2008-2011 growth rate for value-added and employment at the European level using nACE 2 codes;
• Calculation of the economic contribution of the creative industries for each individual country in 2011. The main issue we have been facing to perform these calculations was related to the availability – or lack thereof - of the relevant data. The Eurostat sBs database is indeed far from complete and reliable for individual countries at the level of precision we are operating (nACE codes are organized in a hierarchical fashion from 2 digit aggregated industry codes, to very refined 4 digit industrial segment codes).
To cope with this difficulty, when the relevant data was lacking, we have tried to use either data coming from the national statistics offices (e.g. InsEE for france), or more aggregated data (e.g. 3 digit nACE codes)9.
more precisely, the solution we chose has been different for each country:
• for the united Kingdom, data published by the national statistics office10 are a lot less detailed than the
Eurostat one. We then had to use the Eurostat data at the 3-digit codes level;
• for france Eurostat and InsEE11 data being quite different, we relied on the InsEE data for our calculation12;
• for Italy, Eurostat and IsTAT13 data were consistent and accurate enough to apply the calculation methodology
used at the European level;
• for spain, data published by the national office (InE14) were not detailed enough. We then used the Eurostat
data at the 3-digit codes level;
• for Germany, it was unfortunately impossible to use either Eurostat or the German national statistics office. Eurostat data were indeed showing significant inconsistencies, due to a change in the data collection process in 2008 (see Appendix 6 for a detailed explanation) and could therefore not be used. On the other hand, the data made available by stBA15 were much too lacunar for our purpose. for these reasons, employment and
value added growth rate for Germany have been estimated using two third party studies on culture and creative industries in Germany published by the German federal ministry of Economics and Technology16.
2.1 APProAch
9 see Appendix 4 for more details on these points 10British national statistics Office.
11Institut national de la statistique et des études économiques, french national statistics Office.
12We have identified that the source of the difference were the year 2008. We have contacted InsEE on this difference. They answered that they were a change in the system in charge to product structural Business statistics in 2008. from 2009, improvement had been done on this new system and 2008 data had been corrected. Because of that, the last update on insee.fr came late and Eurostat data haven’t been corrected since.
13Istituto nazionale di statistica, Italian national statistics Office. 14Instituto nacional de Estadística, spanish national statistics Office. 15statistisches Bundesamt, German national statistics Office.
16federal ministry of Economics and Technology, Culture and Creative Industries in Germany 2009 monitoring of selected Economic Key data on Culture and Creative Industries - monitoring Report 2010, July 2010.
Table 12 shows the weight of the creative industry (contribution of the creative industries divided by the contribution of all industries), in terms of value added and of employment, in the economy of each of the five countries studied for 2008, as calculated in our previous study.
Table 12: Economic weight of the creative industries in the main European markets (2008)
Table 13 below shows an update of these figures for 2011. Table 14 shows the evolution of the economic contribution of the creative industries in absolute terms, compared with an evolution of the overall economy.
2.2 concLUSionS rEGArDinG ThE EVoLUTion oF ThE conTribUTion
oF crEATiVE inDUSTriES AT nATionAL LEVELS
VA Jobs VA Jobs VA Jobs VA Jobs VA Jobs VA Jobs
Source – TERA Consultants analysis
creative industries
core
interdependent & support ToTAL creative industries creative GDP (billion€)
creative employment (million)
5 coUnTriES UK FrAncE GErmAnY iTALY SPAin
6.2% 3.4% 9.6% 175 4.9% 2.6% 7.5% 146 4.2% 2.3% 6.5% 162 3.8% 2.1% 5.9% 93 3.6% 2.0% 5.6% 62 5.4% 3.8% 9.2% 2.7 3.7% 2.6% 6.2% 1.6 4.1% 2.8% 6.9% 2.7 3.6% 2.5% 6.1% 1.4 3.5% 2.4% 5.9% 1.2 4.8% 2.6% 7.5% 638 4.2% 3.0% 7.2% 9.6
Table 13: Economic weight of the creative industries in the main European markets (2011)
Table 14: Evolution of the economic contribution of the creative industries in the main European markets (2008-2011)
VA Jobs VA Jobs VA Jobs VA Jobs VA Jobs VA Jobs
Source – TERA Consultants analysis
creative industries
creative industries overall economy
5 coUnTriES UK FrAncE GErmAnY iTALY SPAin
-8.8% -3.6% 4.0% 3.5% -1.7% 5.5% 1.6% 0.3% -14.5% -3.8% -3.8% -1.0% 0.4% -0.4% 4.1% 3.1% -1.1% -1.9% -15.7% -10.6% -3.1% 1.2% -2.0% -1.3%
VA Jobs VA Jobs VA Jobs VA Jobs VA Jobs VA Jobs
Source – TERA Consultants analysis
creative industries
core
interdependent & support ToTAL creative industries creative GDP (billion€)
creative employment (million)
5 coUnTriES UK FrAncE GErmAnY iTALY SPAin
5.8% 3.2% 9.0% 159 5.1% 2.7% 7.9% 152 3.9% 2.1% 6.1% 159 3.9% 2.2% 6.1% 95 3.4% 1.7% 5.0% 53 5.4% 3.6% 9.0% 2.6 3.7% 2.6% 6.3% 1.6 4.1% 2.9% 7.0% 2.8 3.7% 2.5% 6.2% 1.4 3.4% 2.2% 5.6% 1.0 4.5% 2.4% 6.9% 618 4.1% 2.8% 7.0% 9.5
A few comments can be made at this stage:
• Overall, creative industries in the top 5 European countries have posted a stronger decline than the overall economy.
• The decrease of the creative industries has proved much stronger in the “centre” (the five biggest economies of the Euro zone) than in the “periphery” (the other 22 countries), both at the value added and at the employment level. Even if a full explanation of this phenomenon falls out of the scope of this report, it must involve a difference of maturity of the creative industry between the centre and the periphery, as well as differences of consumption pattern and the effect of the outsourcing.
• The decrease has generally been stronger in terms of added value than in terms of jobs, which could be explained by the relative rigidity of employment. Indeed, at the firm’s level, there is generally a lag between a decrease in profit and the decision of implementing a lay-off plan. The argument goes also the other way around: in times of uncertainty about demand, companies are reluctant to hire, which might explain the french situation with an almost jobless increase in added value. The German situation (a significant job increase with a declining added value) is very peculiar, which has been underlined in the 2011 report we used to compute these numbers: “Considering the economic situation, the labour market shows a surprisingly positive trend.” no clear explanation for that unintuitive employment trend was however provided in the report. • The overall declining trend in Europe top 5 hides a strong heterogeneity between countries:
o The economic weight of the creative industries has decreased in the uK17 , in spain, and in Germany18
(in terms of value added);
o On the contrary, the creative industries have grown in france19 and Italy.
• Again, the explanation for this heterogeneity of trends must be multifactorial. It is however possible
to underline the correlation between the growth of the creative industries and the IP protection legislation20.
Thus, france has established some form of response to Internet piracy before 2011 with the notice sending system implemented by hAdOPI. The cultural industries in france have posted a much better dynamic during the period studied than in countries where such measures do not exist.
17In the uK, the department for Culture media & sport has determined that creative industries (based on a definition that is more restrictive than our “core” segment) accounted for 1.55 million jobs in 2011. This figure is higher than ours, which can be explained by differences of definition of “employment”. The British studies used a broad definition, encompassing both employees (salary workers) and self-employed entrepreneurs, whereas our study focused on salaried employment. Taking this difference into account, both figures seem consistent with one another. source: department for Culture media & sport, Creative Industries Economic Estimates, January 2014.
18In Germany, the federal ministry of Economics and Technology has published two studies (in 2010 and 2012) related to the culture and creative industries. The first one compares the economic Importance of these industries between 2007 and 2009, and the second one between 2009 and 2011. These two studies show that between 2008 and 2011, total employment has increased by 4.1% while value added has decreased by 1.7%.
19In france, a study carried out by Ernst & young estimates that cultural and artistic industries generate around 1.2 million jobs all over france. According to E&y, “cultural and artistic industries” include nine sectors (graphic and plastic arts, music, live spectacle, film, television, radio, video games, press/newspapers and magazines) that approximately match our “core” segment, which makes their estimate consistent with ours. source: Ey, 1er panorama des industries culturelles et créatives, november 2013.
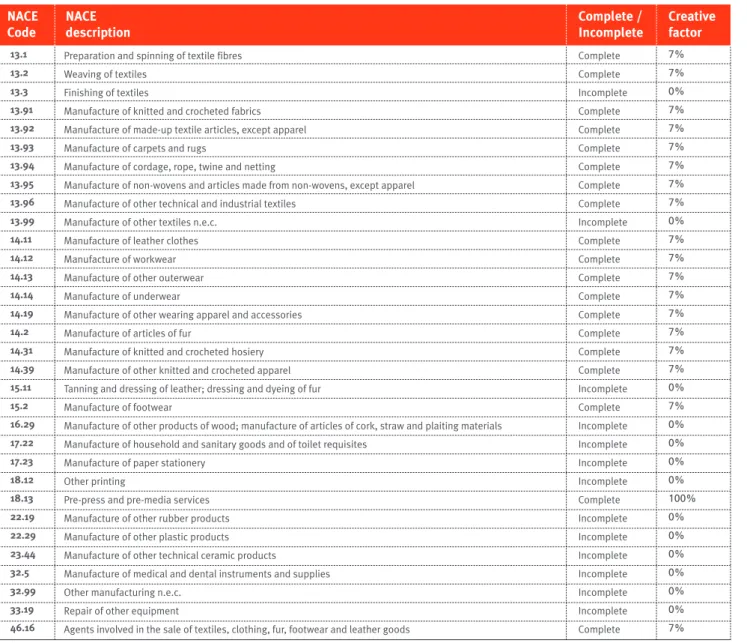
The following table shows the list of sectors used to evaluate the value added of core industries and the creative factor assigned to each sector.
Table 15: core industries (4-digit nAcE rev. 2 code) – Value Added
1 corE inDUSTriES
nAcE
description complete / incomplete creative factor
nAcE code 13.1 13.2 13.3 13.91 13.92 13.93 13.94 13.95 13.96 13.99 14.11 14.12 14.13 14.14 14.19 14.2 14.31 14.39 15.11 15.2 16.29 17.22 17.23 18.12 18.13 22.19 22.29 23.44 32.5 32.99 33.19 46.16 7% 7% 0% 7% 7% 7% 7% 7% 7% 0% 7% 7% 7% 7% 7% 7% 7% 7% 0% 7% 0% 0% 0% 0% 100% 0% 0% 0% 0% 0% 0% 7%
Preparation and spinning of textile fibres Weaving of textiles
finishing of textiles
manufacture of knitted and crocheted fabrics manufacture of made-up textile articles, except apparel manufacture of carpets and rugs
manufacture of cordage, rope, twine and netting
manufacture of non-wovens and articles made from non-wovens, except apparel manufacture of other technical and industrial textiles
manufacture of other textiles n.e.c. manufacture of leather clothes manufacture of workwear manufacture of other outerwear manufacture of underwear
manufacture of other wearing apparel and accessories manufacture of articles of fur
manufacture of knitted and crocheted hosiery manufacture of other knitted and crocheted apparel Tanning and dressing of leather; dressing and dyeing of fur manufacture of footwear
manufacture of other products of wood; manufacture of articles of cork, straw and plaiting materials manufacture of household and sanitary goods and of toilet requisites
manufacture of paper stationery Other printing
Pre-press and pre-media services manufacture of other rubber products manufacture of other plastic products manufacture of other technical ceramic products
manufacture of medical and dental instruments and supplies Other manufacturing n.e.c.
Repair of other equipment
Agents involved in the sale of textiles, clothing, fur, footwear and leather goods
Complete Complete Incomplete Complete Complete Complete Complete Complete Complete Incomplete Complete Complete Complete Complete Complete Complete Complete Complete Incomplete Complete Incomplete Incomplete Incomplete Incomplete Complete Incomplete Incomplete Incomplete Incomplete Incomplete Incomplete Complete
nAcE
description complete / incomplete creative factor
nAcE code 46.41 46.42 46.43 46.47 46.48 46.49 46.73 47.19 47.41 47.42 47.51 47.53 47.59 47.61 47.62 47.64 47.65 47.71 47.76 47.77 47.78 47.91 58.11 58.12 58.13 58.14 58.19 58.21 58.29 59.11 59.12 59.13 59.14 59.2 60.1 60.2 61.1 61.2 61.3 61.9 62.01 7% 7% 0% 0% 7% 0% 0% 7% 7% 7% 7% 0% 0% 100% 100% 7% 7% 7% 7% 7% 7% 0% 100% 100% 100% 100% 100% 100% 100% 100% 100% 100% 100% 100% 100% 100% 100% 100% 100% 100% 100% Wholesale of textiles
Wholesale of clothing and footwear Wholesale of electrical household appliances Wholesale of furniture, carpets and lighting equipment Wholesale of watches and jewellery
Wholesale of other household goods
Wholesale of wood, construction materials and sanitary equipment Other retail sale in non-specialised stores
Retail sale of computers, peripheral units and software in specialised stores Retail sale of telecommunications equipment in specialised stores Retail sale of textiles in specialised stores
Retail sale of carpets, rugs, wall and floor coverings in specialised stores
Retail sale of furniture, lighting equipment and other household articles in specialised stores Retail sale of books in specialised stores
Retail sale of newspapers and stationery in specialised stores Retail sale of sporting equipment in specialised stores Retail sale of games and toys in specialised stores Retail sale of clothing in specialised stores
Retail sale of flowers, plants, seeds, fertilisers, pet animals and pet food in specialised stores Retail sale of watches and jewellery in specialised stores
Other retail sale of new goods in specialised stores Retail sale via mail order houses or via Internet Book publishing
Publishing of directories and mailing lists Publishing of newspapers
Publishing of journals and periodicals Other publishing activities Publishing of computer games Other software publishing
motion picture, video and television programme production activities motion picture, video and television programme post-production activities motion picture, video and television programme distribution activities motion picture projection activities
sound recording and music publishing activities Radio broadcasting
Television programming and broadcasting activities Wired telecommunications activities
Wireless telecommunications activities satellite telecommunications activities Other telecommunications activities Computer programming activities
Complete Complete Incomplete Incomplete Complete Incomplete Incomplete Complete Complete Complete Complete Incomplete Incomplete Complete Complete Complete Complete Complete Complete Complete Complete Incomplete Complete Complete Complete Complete Complete Complete Complete Complete Complete Complete Complete Complete Complete Complete Complete Complete Complete Complete Complete
nAcE
description complete / incomplete creative factor
nAcE code 63.91 63.99 68.2 71.11 71.12 73.11 73.12 74.1 74.2 74.9 77.21 77.22 77.29 77.4 79.9 82.3 82.91 82.99 85.51 85.52 90.01 90.02 90.03 90.04 91.01 91.02 91.03 93.29 95.29 96.09 100% 100% 7% 100% 100% 100% 100% 100% 100% 0% 7% 7% 7% 7% 0% 7% 7% 0% 0% 0% 100% 100% 100% 100% 0% 100% 100% 0% 0% 0%
news agency activities
Other information service activities n.e.c. Renting and operating of own or leased real estate Architectural activities
Engineering activities and related technical consultancy Advertising agencies
media representation specialised design activities Photographic activities
Other professional, scientific and technical activities n.e.c. Renting and leasing of recreational and sports goods Renting of video tapes and disks
Renting and leasing of other personal and household goods
Leasing of intellectual property and similar products, except copyrighted works Other reservation service and related activities
Organisation of conventions and trade shows Activities of collection agencies and credit bureaus Other business support service activities n.e.c. sports and recreation education
Cultural education Performing arts
support activities to performing arts Artistic creation
Operation of arts facilities Library and archives activities museums activities
Operation of historical sites and buildings and similar visitor attractions Other amusement and recreation activities
Repair of other personal and household goods Other personal service activities n.e.c.
Complete Complete Complete Complete Complete Complete Complete Complete Complete Incomplete Complete Complete Complete Complete Incomplete Complete Complete Incomplete Incomplete Incomplete Complete Complete Complete Complete Incomplete Complete Complete Incomplete Incomplete Complete
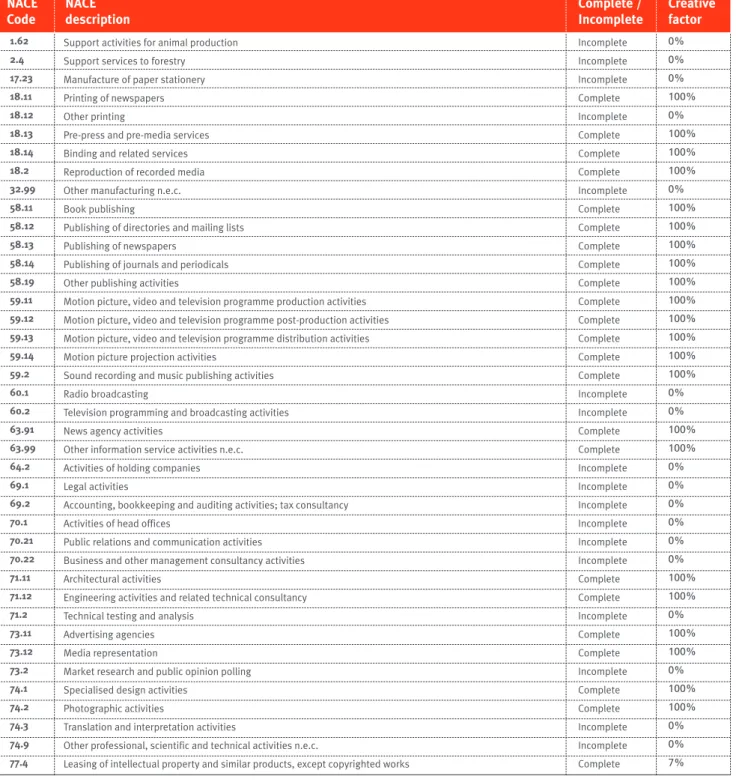
Table 16: core industries (4-digit nAcE rev. 2 code) – Employment
nAcE
description complete / incomplete creative factor
nAcE code 1.62 2.4 17.23 18.11 18.12 18.13 18.14 18.2 32.99 58.11 58.12 58.13 58.14 58.19 59.11 59.12 59.13 59.14 59.2 60.1 60.2 63.91 63.99 64.2 69.1 69.2 70.1 70.21 70.22 71.11 71.12 71.2 73.11 73.12 73.2 74.1 74.2 74.3 74.9 77.4 0% 0% 0% 100% 0% 100% 100% 100% 0% 100% 100% 100% 100% 100% 100% 100% 100% 100% 100% 0% 0% 100% 100% 0% 0% 0% 0% 0% 0% 100% 100% 0% 100% 100% 0% 100% 100% 0% 0% 7%
support activities for animal production support services to forestry
manufacture of paper stationery Printing of newspapers Other printing
Pre-press and pre-media services Binding and related services Reproduction of recorded media Other manufacturing n.e.c. Book publishing
Publishing of directories and mailing lists Publishing of newspapers
Publishing of journals and periodicals Other publishing activities
motion picture, video and television programme production activities motion picture, video and television programme post-production activities motion picture, video and television programme distribution activities motion picture projection activities
sound recording and music publishing activities Radio broadcasting
Television programming and broadcasting activities news agency activities
Other information service activities n.e.c. Activities of holding companies Legal activities
Accounting, bookkeeping and auditing activities; tax consultancy Activities of head offices
Public relations and communication activities Business and other management consultancy activities Architectural activities
Engineering activities and related technical consultancy Technical testing and analysis
Advertising agencies media representation
market research and public opinion polling specialised design activities
Photographic activities
Translation and interpretation activities
Other professional, scientific and technical activities n.e.c.
Leasing of intellectual property and similar products, except copyrighted works
Incomplete Incomplete Incomplete Complete Incomplete Complete Complete Complete Incomplete Complete Complete Complete Complete Complete Complete Complete Complete Complete Complete Incomplete Incomplete Complete Complete Incomplete Incomplete Incomplete Incomplete Incomplete Incomplete Complete Complete Incomplete Complete Complete Incomplete Complete Complete Incomplete Incomplete Complete
nAcE
description complete / incomplete creative factor
nAcE code 78.1 78.2 78.3 79.9 80.1 80.2 80.3 81.21 81.22 81.29 82.11 82.19 82.2 82.3 82.91 82.92 82.99 85.51 85.52 85.6 90.01 90.02 90.03 90.04 91.01 91.02 91.03 91.04 92 93.11 93.12 93.19 93.21 0% 0% 0% 0% 0% 0% 0% 0% 0% 0% 0% 0% 0% 7% 7% 0% 0% 0% 0% 0% 100% 100% 100% 100% 0% 100% 100% 0% 0% 0% 0% 0% 0%
Activities of employment placement agencies Temporary employment agency activities Other human resources provision
Other reservation service and related activities Private security activities
security systems service activities Investigation activities
General cleaning of buildings
Other building and industrial cleaning activities Other cleaning activities
Combined office administrative service activities
Photocopying, document preparation and other specialised office support activities Activities of call centres
Organisation of conventions and trade shows Activities of collection agencies and credit bureaus Packaging activities
Other business support service activities n.e.c. sports and recreation education
Cultural education Educational support activities Performing arts
support activities to performing arts Artistic creation
Operation of arts facilities Library and archives activities museums activities
Operation of historical sites and buildings and similar visitor attractions Botanical and zoological gardens and nature reserves activities Gambling and betting activities
Operation of sports facilities Activities of sport clubs Other sports activities
Activities of amusement parks and theme parks
Incomplete Incomplete Incomplete Incomplete Incomplete Incomplete Incomplete Incomplete Incomplete Incomplete Incomplete Incomplete Incomplete Complete Complete Incomplete Incomplete Incomplete Incomplete Incomplete Complete Complete Complete Complete Incomplete Complete Complete Incomplete Incomplete Incomplete Incomplete Incomplete Incomplete
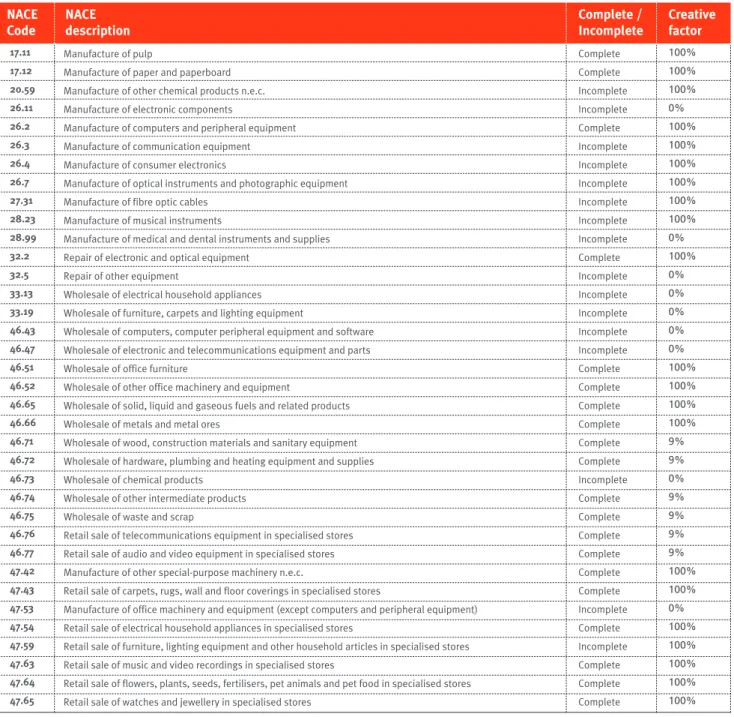
Table 17: Additional core industries (4-digit nAcE rev. 2 code)
2 ADDiTionAL corE inDUSTriES AS DEFinED bY TErA
Source – TERA Consultants analysis
nAcE
description complete / incomplete creative factor
nAcE code 17.23 18.11 18.12 18.13 18.14 18.2 33.12 58.11 58.12 58.13 58.14 58.19 58.21 58.29 59.2 60.1 60.2 62.01 62.02 62.03 62.09 63.11 63.12 95.11 0% 100% 100% 100% 100% 100% 0% 100% 100% 100% 100% 100% 100% 100% 100% 0% 0% 100% 100% 100% 100% 100% 100% 100%
manufacture of paper stationery Printing of newspapers Other printing
Pre-press and pre-media services Binding and related services Reproduction of recorded media Repair of machinery
Book publishing
Publishing of directories and mailing lists Publishing of newspapers
Publishing of journals and periodicals Other publishing activities Publishing of computer games Other software publishing
sound recording and music publishing activities Radio broadcasting
Television programming and broadcasting activities Computer programming activities
Computer consultancy activities Computer facilities management activities
Other information technology and computer service activities data processing, hosting and related activities
Web portals
Repair of computers and peripheral equipment
Incomplete Complete Incomplete Complete Complete Complete Incomplete Incomplete Incomplete Incomplete Incomplete Complete Incomplete Incomplete Incomplete Incomplete Incomplete Incomplete Complete Complete Incomplete Complete Complete Complete