State of the Art Paper 1
A framework for landslide risk assessment and management
R. Fell,
School of Civil and Environmental Engineering, The University of New South Wales, Sydney, Australia
K.K.S. Ho
Geotechnical Engineering Office, Civil Engineering and Development Department, Hong Kong Special Administrative Region.
S. Lacasse
International Centre for Geohazards, Norwegian Geotechnical Institute, Oslo, Norway
E. Leroi
Urbater, Roquevaire, France
This paper also discusses the advantages, disad-vantages and limitations of QRA for engineered slopes and landslides. The other seven State of the Art (SOA) papers in this Conference provide the details of the methods that can be used. The invited and submitted papers in this volume deal with spe-cific applications, case studies, research and devel-opment.
ABSTRACT: This paper provides a framework for landslide risk assessment and management. It outlines the processes of hazard analysis, including characterization of the landslide (the danger); frequency analysis; the risk estimation calculation; risk evaluation against risk tolerance criteria and value judgements. The paper discusses the benefits and limitations of quantitative and qualitative risk management, and gives simplified examples.
1 INTRODUCTION
Landslides and engineered slopes have always in-volved some form of risk assessment and man-agement. This was often done by the use of “engi-neering judgement” by the Geotechnical Engineers or Engineering Geologists in consultation with owners and regulators.
2 TERMINOLOGY The more formal applications of risk assessment
and management principles, in a qualitative man-ner, have been practised for landslide hazard zon-ing for urban plannzon-ing and highway slope man-agement since the 1970’s. In the 1980’s, and particularly in the 1990’s, these have been ex-tended to quantitative methods, and to manage-ment of individual slopes, pipeline routes, subma-rine slopes and more global slope risk management.
The International Society of Soil Mechanics and Geotechnical Engineering (ISSMGE) Technical Committee on Risk Assessment and Management (TC32) developed a Glossary of Terms for Risk Assessment, based on IUGS (1997), ICOLD (2003), and National Standards such as British Standard BS 8444, Australia-New Zealand Stan-dard AS/NZS 4360, and Canadian StanStan-dard CAN/CSA – Q 634-91. The Glossary is attached to this volume and these terms are used throughout all the SOA papers.
These developments are described by Varnes (1984), Whitman (1984), Einstein (1988, 1997), Fell (1994), Leroi (1996), Wu, et al. (1996), Fell and Hartford (1997), Nadim and Lacasse (1999) Ho, et al. (2000) Kvalstad et al. (2001), Nadim et al. (2003), Nadim and Lacasse (2003, 2004), Hart-ford and Baecher, and (2004), and Lee and Jones (2004). Some guidelines have been developed (e.g. Australian Geomechanics Society, 2000).
Readers are encouraged to use these terms so that there is consistency across the international community. The most important terms and their definitions are:
Annual exceedance probability (AEP): The estimated probability that an event of specified magnitude will be exceeded in any year.
At this time there exists a generic framework for the use of quantitative risk assessment (QRA) for engineered slopes and landslides; including in-dividual slopes, groups of slopes (such as cuts and fills on a length of highway), land use planning and zoning for urban development and “global” or regional landslide risk management. This paper de-scribes this framework.
Consequence: In relation to risk analysis, the outcome or result of a hazard being realised.
Danger (Threat): The natural phenomenon that could lead to damage, described in terms of its ge-ometry, mechanical and other characteristics. The danger can be an existing one (such as a creeping slope) or a potential one (such as a rockfall). The
characterisation of a danger or threat does not in-clude any forecasting.
Elements at risk: Population, buildings and engineering works, infrastructure, environmental features and economic activities in the area af-fected by a hazard.
Frequency: A measure of likelihood expressed as the number of occurrences of an event in a given time or in a given number of trials (see also likeli-hood and probability).
Hazard: Probability that a particular danger (threat) occurs within a given period of time.
Individual risk to life: The increment of risk imposed on a particular individual by the existence of a hazard. This increment of risk is an addition to the background risk to life, which the person would live with on a daily basis if the facility did not exist.
Likelihood: Conditional probability of an out-come given a set of data, assumptions and informa-tion. Also used as a qualitative description of prob-ability and frequency.
Probability: A measure of the degree of cer-tainty. This measure has a value between zero (im-possibility) and 1.0 (certainty). It is an estimate of the likelihood of the magnitude of the uncertain quantity, or the likelihood of the occurrence of the uncertain future event.
There are two main interpretations:
i) Statistical – frequency or fraction – The outcome of a repetitive experiment of some kind like flipping coins. It includes also the idea of population variability. Such a number is called an “objective” or relative frequentist probability be-cause it exists in the real world and is in principle measurable by doing the experiment.
ii) Subjective probability (degree of belief) – Quantified measure of belief, judgement, or confi-dence in the likelihood of an outcome, obtained by considering all available information honestly, fairly, and with a minimum of bias. Subjective probability is affected by the state of understanding of a process, judgement regarding an evaluation, or the quality and quantity of information. It may change over time as the state of knowledge changes.
Risk: Measure of the probability and severity of an adverse effect to life, health, property, or the environment. Quantitatively, Risk = Hazard x Po-tential Worth of Loss. This can be also expressed as “Probability of an adverse event times the con-sequences if the event occurs”.
Risk analysis: the use of available information to estimate the risk to individuals or populations, property or the environment, from hazards. Risk analyses generally contain the following steps: definition of scope, danger (threat) identification, estimation of probability of occurrence to estimate
hazard, evaluation of the vulnerability of the ele-ment(s) at risk, consequence identification, and risk estimation. Consistent with the common dic-tionary definition of analysis, viz. “A detailed ex-amination of anything complex made in order to understand its nature or to determine its essential features”, risk analysis involves the disaggregation or decomposition of the system and sources of risk into their fundamental parts.
Qualitative risk analysis: An analysis which uses word form, descriptive or numeric rating scales to describe the magnitude of potential con-sequences and the likelihood that those conse-quences will occur.
Quantitative risk analysis: An analysis based on numerical values of the probability, vulnerabil-ity and consequences, and resulting in a numerical value of the risk.
Risk assessment: The process of making a de-cision recommendation on whether existing risks are tolerable and present risk control measures are adequate, and if not, whether alternative risk con-trol measures are justified or will be implemented. Risk assessment incorporates the risk analysis and risk evaluation phases.
Risk control: The implementation and en-forcement of actions to control risk, and the peri-odic re-evaluation of the effectiveness of these ac-tions.
Risk evaluation: The stage at which values and judgement enter the decision process, explicitly or implicitly, by including consideration of the impor-tance of the estimated risks and the associated so-cial, environmental, and economic consequences, in order to identify a range of alternatives for man-aging the risks.
Risk management: The systematic application of management policies, procedures and practices to the tasks of identifying, analysing, assessing, mitigating and monitoring risk.
Risk mitigation: A selective application of ap-propriate techniques and management principles to reduce either likelihood of an occurrence or its ad-verse consequences, or both.
Societal risk: The risk of widespread or large scale detriment from the realisation of a defined risk, the implication being that the consequence would be on such a scale as to provoke a socio/political response.
Temporal (spatial) probability: The probabil-ity that the element at risk is in the area affected by the danger (threat) at the time of its occurrence.
Tolerable risk: A risk within a range that soci-ety can live with so as to secure certain net bene-fits. It is a range of risk regarded as non-negligible and needing to be kept under review and reduced further if possible.
Vulnerability: The degree of loss to a given element or set of elements within the area affected
by a hazard. It is expressed on a scale of 0 (no loss) to 1 (total loss).
Also, a set of conditions and processes resulting from physical, social, economic, and environ-mental factors, which increase the susceptibility of a community to the impact of hazards.
Other terms to describe landslide classification, features and geometry are detailed in Appendix A of this volume.
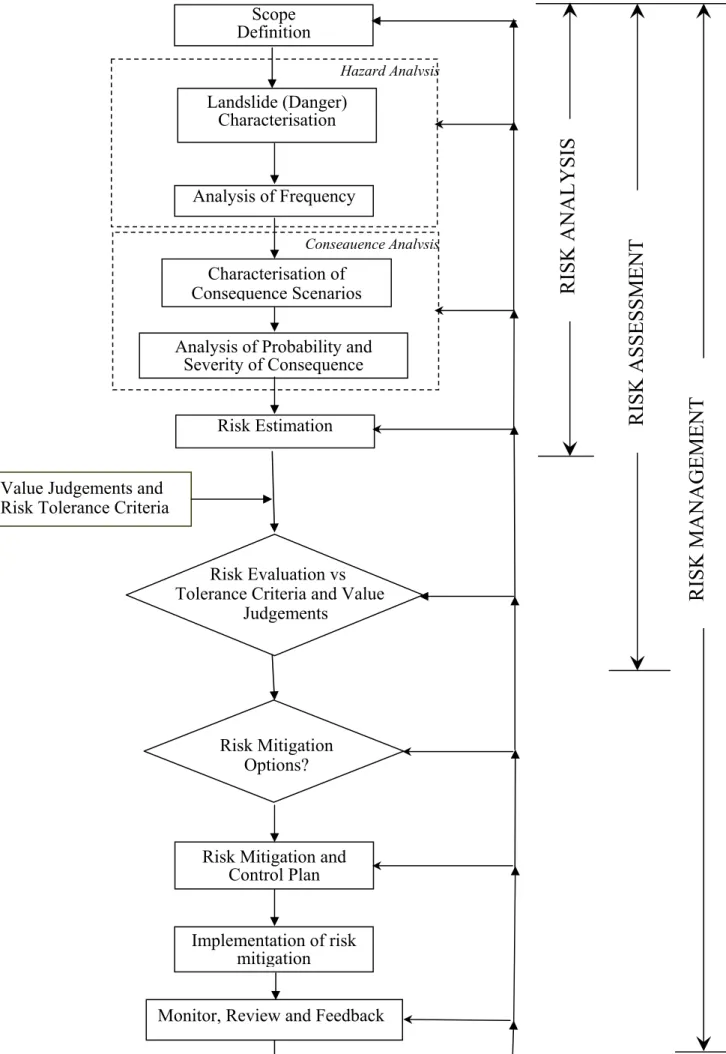
3 THE RISK MANAGEMENT PROCESS Figures 1, 2 and 3 describe the overall risk man-agement process.
Hazard analysis involves characterising the landslide (classification, size, velocity, mechanics, location, travel distance), and the corresponding frequency (annual probability) of occurrence.
Risk analysis includes hazard analysis and con-sequence analyses. Concon-sequence analysis includes identifying and quantifying the elements at risk (property, persons), their temporal spatial probabil-ity, their vulnerability either as conditional prob-ability of damage to conditional probprob-ability of damage to property, or conditional probability of loss of life or injury.
Risk assessment takes the output from risk analysis and assesses these against values judge-ments, and risk acceptance criteria.
Risk management takes the output from the risk assessment, and considers risk mitigation, includ-ing acceptinclud-ing the risk, reducinclud-ing the likelihood, re-ducing consequences e.g. by developing monitor-ing, warning and evacuation plans or transferring risk (e.g. to insurance), develops a risk mitigation plan and possibly implements regulatory controls. It also includes monitoring of the risk outcomes, feedback and iteration when needed.
The process is iterative within any one study, and should be up-dated periodically as monitoring results become available.
Landslide risk management involves a number of stakeholders including owners, occupiers, the affected public and regulatory authorities, as well as geotechnical professionals, and risk analysts.
It is an integral part of risk management that the estimated risks are compared to acceptance criteria (either quantitative or qualitative). Geotechnical professionals are likely to be involved as the risk analysts, and may help guide in the assessment and decision process, but ultimately it is for owners, regulators and governments to decide whether the calculated risks are acceptable or whether risk mitigation is required.
In some cases the absolute values of risk are not as important as the relative risks. This is often the case for risk assessments for cuts and fills on highways, where the risk assessment process is
be-ing used to prioritise the implementation of risk reduction measures.
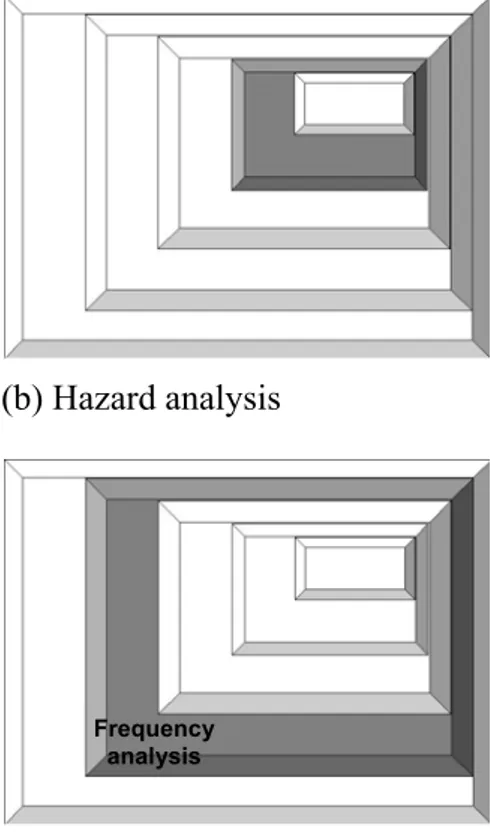
The risk management process in Figure 1 can be divided in phases. Five of these are illustrated by the darker shades in Figure 2. The graphics illus-trate that each new phase includes the previous one(s) and that the solution becomes more in-volved as one progresses through the different phases. The 5 phases together form an integrated framework schematically illustrated in the graphics in Figure 3.
4 LANDSLIDE RISK ANALYSIS 4.1 Scope definition
To ensure that the risk analysis addresses the rele-vant issues, satisfies the needs of those concerned, and to avoid misunderstandings, it is important to define the scope of the risk analysis:
(a) Is the analysis for a single site (e.g. a road cutting, or a building); a number of sites, (e.g. all the road cuttings on a length of road); hazard zon-ing for land-use plannzon-ing; or “global risk assess-ment”, where for example cut slopes on all roads in a local government area are being studied uni-versally to formulate policies and prioritise mitiga-tion acmitiga-tions?
(b) The geographic limits. Note that to be com-plete, the effects of landsliding up slope of a site, not confined to the site may need to be considered; and the impacts of the landsliding on sites downslope, e.g. of a road fill, may also need to be part of the analysis.
(c) Whether the analysis will be restricted to property loss or damage, or it will also include as-sessment of the potential for loss of life and injury. (d) The extent of geotechnical engineering and geological studies which will form the basis of the analysis. These can control the overall standard of the risk analysis.
(e) The approach to be used to characterise the landslides, and assess the frequency of landsliding, and their consequences.
(f) Whether the analysis will be quantified or qualitative.
(g) How risk acceptance criteria will be deter-mined, by whom, and through what process? The extent to which the stakeholders (owners, public, regulator, risk analyst) will be involved.
(h) Operational (e.g. land access) and financial constraints to the analysis.
(i) Legal responsibilities of all parties.
(j) The nature of the end product of the risk analysis – report, maps, and how these will be communicated to the interested parties.
Scope Definition
Analysis of Frequency
Analysis of Probability and Severity of Consequence
Risk Estimation
Risk Mitigation and Control Plan Risk Mitigation Options? Consequence Analysis Hazard Analysis Characterisation of Consequence Scenarios Risk Evaluation vs Tolerance Criteria and Value
Judgements Value Judgements and
Risk Tolerance Criteria
Landslide (Danger) Characterisation
Implementation of risk mitigation
Monitor, Review and Feedback
RISK MANAGEMENT
RISK ASSESSMENT
RISK ANALYSIS
Figure 1 – Flow chart for landslide risk management.
(a) Landslide (danger) characterisation (b) Hazard analysis
Frequency analysis
(c) Risk analysis (d) Risk evaluation
(e) Risk mitigation and control
Figure 2 –Representation of 5 phases of the Risk Management Process
Mechanics, Location Volume,Travel Distance and Velocity Political Aspirations Other constraints Budget Social demands Regulation Risk acceptance criteria Elements at risk Vulnerability Temporal Spatial probability Frequency analysis Consequences Values Judgement Monitor and Review Risk mitigation
Control options & Control plan
LANDSLIDE (DANGER) CHARACTERISATION R I S K M A N A G E M E N T R I S K A S S E S S M E N T H A Z A R D A N A L Y S I S R I S K A N A L Y S I S LANDSLIDE (DANGER) CHARACTERISATION R I S K M A N A G E M E N T R I S K A S S E S S M E N T H A Z A R D A N A L Y S I S R I S K A N A L Y S I S
4.2.2 Frequency analysis
The frequency of landsliding can be expressed in terms of (IUGS 1997):
4.2 Hazard analysis
- The number of landslides of a certain charac-teristic that may occur in a study area per year. Hazard analysis is the process of identification
and characterisation of the potential landslides to-gether with evaluation of their corresponding
fre-quency of occurrence. - The probability of a particular slope experi-encing landsliding in a given period, e.g. a year.
4.2.1 Landslide (Danger) characterisation - The driving forces exceeding the resistant forces in probability or reliability terms, with the frequency of occurrence being determined by considering the annual probability of the critical pore water pressures being exceeded in the analysis.
Landslide (danger) characterisation requires an un-derstanding of the slope processes and the relation-ship of those processes to geomorphology, geol-ogy, hydrogeolgeol-ogy, failure and slide mechanics, climate and vegetation. From this understanding it
will be possible to: - This should be done for each type of landslide which has been identified and characterised as affecting the analysis.
- Classify the types of potential landsliding: the classification system as proposed by Varnes (1984) or modified by Cruden & Varnes (1996) forms suitable systems. A site may be affected by more than one type of landslide hazard e.g., slow rotational earth slides on the site, and very rapid rockfall and debris flows from above the site.
There are several ways of calculating frequency (IUGS 1997):
(1) Historic data within the area of study, or ar-eas with similar characteristics, e.g. geology, geo-morphology.
(2) Empirical methods based on correlations in accordance with slope instability ranking systems. − Assess the physical extent of each potential
landslide,including the location, areal extent
and volume involved. with historical data), or based on expert judgement. (3) Use of geomorphological evidence (coupled − Assess the likely initiating event(s), the physical
characteristics of the materials involved, such as shear strength, pore pressures; and the slide me-chanics. The latter is critical to understanding the pre and post failure behaviour of the land-slide.
(4) Relationship to the frequency and intensity of the triggering event, e.g. rainfall, earthquake.
(5) Direct assessment based on expert judge-ment, which may be undertaken with reference to a conceptual model, e.g. use of a fault tree method-ology.
− Estimate the resulting anticipated travel dis-tance, travel path, depth and velocity of move-ment if failure occurs, taking account of the slide mechanics, and estimating the probability that the land slide will affect the area in which the element at risk is located (PT:L)
(6) Modelling the primary variable, e.g. piezo-metric pressures versus the triggering event, cou-pled with varying levels of knowledge of geometry and shear strength.
(7) Application of probabilistic methods, taking into account the uncertainty in slope geometry, shear strength, failure mechanism, and piezometric pressures. This may be done either in a reliability framework, or taking into account the frequency of failure (for example by considering pore pressures on a frequency basis).
− Identify possible pre-failure warning signs which may be monitored.
A list of possible landslides (dangers) should be developed. Consideration must be given to hazards located off site as well as within the site as it is possible for landslides both upslope and downslope to affect the elements at risk. It is vital that the full range of hazards (e.g. from small, high frequency events to large, low frequency events) be properly characterised and considered in the risk analysis. Often the risk is dominated by the smaller, more frequent landslides. The effects of proposed development in an area should also be considered, as these effects may alter the nature and frequency of potential hazards.
(8) Combinations of the above methods.
In practice it may be appropriate and advisable to use more than one method for the analysis.
Details of the methods and their applicability are given in SOA Paper 2 in this volume. It is im-portant to express the probability of sliding in fre-quency (per annum) terms, because quantitative risk acceptance criteria for loss of life are usually expressed in per annum terms. Financial analysis of damage also usually requires frequency as an input.
It is important that geotechnical professionals with training and experience in landsliding and slope processes are involved in this stage of the analysis because the omission or under/over esti-mation of the effects of different landslides often can control the outcomes of the analysis.
The authors have a preference for estimating frequencies quantitatively. This gives a uniformity of outcomes in quantified terms (rather than using ill-defined subjective terms such as likely, unlikely etc.), allows risk to be compared with quantitative
4.3.1 Elements at risk
acceptance criteria, and allows comparison with risks from other hazards with which the parties in-volved may be able to associate. However it is rec-ognised that many practitioners are not familiar with quantifying landslide frequencies, and it is important there are “sanity checks” on the results against historical performance data, and for more important analyses, reviews by persons who are experienced in landslide risk analysis.
The elements at risk include the population, build-ings, engineering works, infrastructure, vehicles, environmental features and economic activities which are in the area affected by the hazard. In practical terms, this usually means on the land-slide, and/or in the area onto which the landslide may travel if it occurs. It may also include property immediately adjacent to or upslope of the land-slide, if the property or its value would be affected by landsliding and infrastructure which may in-clude powerlines, water supply, sewage, drainage, roads, communication facilities. The population at risk includes persons who live, work, or travel through the area affected by the hazard.
For most hazard analyses, the estimation of fre-quency based on historical data, geomorphological evidence, relationship to trigger event frequencies etc. are typically more reliable than the apparently more rigorous and detailed probabilistic analyses because of the many uncertainties involved and data constraints. Also, some of the causes or con-tributory factors to slope instability may not be amenable to conventional limit equilibrium analy-sis, e.g. effects of topography on surface water flows.
It would be usual to categorise vehicles into cars, trucks and buses, because of the different number of persons likely to be in the vehicles.
The elements at risk are likely to be dependent on the nature of the landslide hazard e.g. for a boulder fall, or debris flow at a given site.
This is particularly true for smaller slopes, and for landslides on natural hillsides, where it is very difficult to estimate pore water pressures, and where small variations in strengths, and geometry and geological anomalies have large effects on the outcomes. There is also seldom sufficient data to properly model such factors as auto-correlation of parameters, so reliance is often placed on pub-lished generalised information which may not be applicable to the site under consideration.
4.3.2 Probability of landslide reaching the ele-ment at risk (PT:L)
The probability of the landslide reaching the ele-ment at risk depends on the relative location of the element at risk and the landslide source, together with the path the landslide is likely to travel below the source. It is a conditional probability between 0 and 1.
(a) For buildings which are located on the source landslide PT:L = 1.
4.3 Consequence analysis (b) For buildings or persons located below the
source landslide and in the path of the resulting travel of the landslide, PT:L is calculated taking
ac-count of the travel distance of the landslide, the lo-cation of the source landslide, and the element at risk.
Consequence analysis involves:
(a) Identifying and quantifying the elements at risk including property and persons.
(b) Assessing temporal spatial probabilities for the elements at risk (PS:T).
(c) Assessing vulnerability of the elements at risk, in terms of property damage (Vprop:T) and loss
of life/injury (VD:T) as appropriate.
(c) For vehicles or persons in vehicles, or per-sons walking in the area below the source landslide in the path of the resulting travel (runout) of the landslide, PT:L is calculated taking account of the
travel distance of the landslide, and the path to be followed by the vehicle or person. Whether the ve-hicle or person is in the path at the time of the landslide is taken account through the temporal spatial probability (PS:T).
This has to be done for each of the landslide hazards.
The consequences may not be limited to prop-erty damage and loss of life/injury. Other conse-quences may include loss of reputation of the owner and geotechnical engineers, consequential costs (e.g. a road is closed for some time affecting businesses along the road), litigation from those in-jured or the relatives of those killed, potential criminal charges for those involved, political re-percussions, adverse social and environmental ef-fects. Most of these may not be readily quantifi-able, but may need to be systematically considered, in consultation with owners and factored into the decision-making process as appropriate, at least for comprehensive risk analysis studies.
The methods for estimation of travel distance are described in SOA 4 of this volume. This in-volves some uncertainty which should be taken de-terminded.
4.3.3 Temporal spatial probability (PS:T)
The temporal spatial probability is the probability that the element at risk is in the area affected by the hazard at the time of its occurrence. It is a con-ditional probability, and is between 0 and 1.
(a) For buildings on or in the path of the land-slide, the temporal spatial probability is 1.
(b) For a single vehicle which passes below a single landslide, it is the proportion of time in a year when it will be in the path of the landslide.
Landslides which move slowly (particularly those with a nearly planar, horizontal surface of rupture) may cause little damage, other than to structures which are on the boundaries of the land-slide and hence experience differential displace-ment.
(c) For all the vehicles which pass below a sin-gle landslide, it is the proportion of time in a year when a vehicle will be in the path of the landslide. Where there are a number of potential landslides in any year, e.g. rockfalls, the calculation is some-what more complicated as described in SOA 5 in this volume.
The rate of movement is less important for structures than it is for loss of life, except in so far as it affects the time rate of damage, i.e. buildings on a slow moving slide (which moves intermit-tently every year) can be expected to have a lower vulnerability than those on a fast moving one. (d) For persons in a building, it is the proportion
of time in a year which the persons occupy the building (0 to 1.0). This is likely to be different for
each person. persons include: Factors which most affect the vulnerability of For persons in vehicles, the temporal spatial
probability will be as for (b) and (c). However it may vary for say one person in a car, and four per-sons in a car.
− The velocity of landsliding. Persons are more likely to be killed by a rapid landslide than slow regardless of the landslide volume.
− Landslide volume – persons are more likely to be buried or crushed by large landslides than small.
The range of credible consequence scenarios will need to be considered in societal risk calcula-tions. Details of how to calculate temporal spatial
probability are given in SOA 5 of this volume. − Whether the person(s) are in the open, or in a vehicle or building (ie. a function of the degree of protection the person(s) has from the land-slide impact).
For some situations it will be necessary to build into the calculation of temporal spatial probability, whether the person(s) at risk may have sufficient warning to evacuate from the area affected by the hazard. Persons on a landslide are more likely to observe the initiation of movement and move off the slide than those who are below a slide falling or flowing onto them.
− If they are in a building, whether the building collapses upon impact by the landslide, and the nature of the collapse.
Persons who are buried by a landsliding mass have a high vulnerability. Death is more likely to result from asphyxia than from crushing or impact. SOA 5 in this volume gives detailed information on the assessment of vulnerability.
Each case should take into account the nature of the landslide including its volume, and velocity, monitoring results, warning signs, evacuation sys-tems, the elements at risk, and the mobility of the
persons. 4.4 Risk estimation
4.4.1 Risk calculation
4.3.4 Vulnerability (Vprop:T and VD:T) The risk can be presented in a number of ways:
Vulnerability is the degree of loss (or damage) to a given element, or set of elements, within the area affected by the hazard. It is a conditional probabil-ity, given the landslide occurs and the element at risk is on or in the path of the landslide. For prop-erty, it is expressed on a scale of 0 (no loss or damage) to 1 (total loss or damage) for property.
(a) The annual risk (expected value) in which the probability of occurrence of the danger is mul-tiplied by the consequences summed over all the hazards. This is expressed as $x damage per an-num; or potential loss of lives per annum.
(b) Frequency – consequence (f – N) pairs – for example for property, the annual probability of minor ($x) damage; medium ($y) damage and ma-jor ($z) damage; and for risk to life, the annual probability of loss of 1 life, 5 lives, 100 lives etc. For persons it is usually the probability
(be-tween 0 and 1) that given the person is on or in the path of the landslide, the person is killed. It may
also include the probability of injury. (c) Cumulative frequency – consequence plots (F – N plots), for example a plot of the annual probability of N or more lives being lost (see sec-tion 5.2 and Figure 4).
Factors that most affect vulnerability of prop-erty include:
− The volume of the landslide in relation to the
element at risk It is often useful to calculate all three. The
an-nual risk for property can be calculated from: − The position of the element at risk, e.g. on the
landslide, or immediately downslope R
(prop) = P(L) x P(T:L) x P(S:T) x V(prop:S) x E (1)
− The magnitude of landslide displacement, and relative displacements within the landslide (for
elements located on the landslide) where R(prop) is the annual loss of property value
P(L) is the frequency of the landsliding
From de Morgan's rule, the estimated upper bound conditional probability is
P(T:L) is the probability of the landslide
reach-ing the element at risk
P(S:T) is the temporal spatial probability of the
element at risk PUB = 1 – (1 – P1)(1 – P2) ……(1 – Pn) (5)
where
V(prop:S) is the vulnerability of the element at risk
to the landslide event PUB = estimated upper bound conditional
prob-ability E is the element at risk (e.g. the value or
net present value of the property) P1 to Pn = the estimate of several individual
hazard conditional probabilities. The annual probability that a particular person
may lose his/her life can be calculated from:
P(LOL) = P(L) x P(T:L) x P(S:T) x V(D:T) (2)
This calculation should be done before applying the annual probability of the common causative event. If all the conditional probabilities P1 to Pn
are small (<0.01), equation 5 yields the same value, within acceptable accuracy, as obtained by adding all the estimated conditional probabilities. where
(P(LOL) is the annual probability that the person
will be killed
(ii) The lower bound
V(D:T) is the vulnerability of the person to the
landslide event The lower bound estimate is the maximum
in-dividual conditional probability. and P(L), P(T:L) and P(S:T) are as defined above
To estimate annual loss of life risk, equation (3) is expanded to be as for equation (2) with E being
the number of persons at risk. 4.4.2The inputs into the risk estimation are not precise, Uncertainty and sensitivity analysis usually involving a large contribution from engi-neering judgement, or uncertainty in input parame-ters (e.g. for formal probabilistic analysis) (La-casse et al. 2003; 2004). Uncertainty describes any situation without certainty, whether or described by a probability distribution. Uncertainty is caused by natural variation and/or incomplete knowledge (lack of understanding or insufficient data). In the context of structural safety, uncertainty can be ei-ther aleatory (inherent variability in natural proper-ties and events) or epistemic (incomplete knowl-edge of parameters and the relationships between input and output values).
There are a number of situations where the risks from a number of landslide hazards have to be summed to give the total risk. These include:
− Where the element at risk is exposed to a num-ber of types of landsliding e.g. boulder fall, de-bris flows, and translational sliding
− Where the landsliding may be triggered by more than one phenomena e.g. rainfall, earth-quake, human activity.
− Where the element at risk is exposed to a num-ber of different sizes of landslide of the same classification e.g. debris flows of 50m3, 5,000 m3 and 100,000m3 volume.
− Where the element at risk is exposed to a num-ber of slopes on which landsliding can occur e.g. a vehicle driving along a road in which there are 20 cut slopes each of which is a poten-tial source of boulder falls.
In these cases, equations (1) and (2) should be written as: R(prop) = ∑ (3) n 1(P(L) x P(T:L) x P(S:T)xV(prop:S)xE) and ) V x P x P x P ( P n (S:T) D:T 1 (L) (T:L) ) LOL ( =
∑
(4)Often for landslide risk assessments, it is not practical to model uncertainties formally e.g. by assigning probability distributions to each input and using Monte Carlo type analysis (e.g. Morgan and Henrion, 1990). However, it is possible to do sensitivity analysis by considering the effects of different assumed values for the inputs. It should be recognised that the use of upper or lower limits of input variables in order to estimate upper and lower bound results gives extremely low likelihood values, and that the analysis may be almost mean-ingless.
4.4.3 Qualitative risk estimation
Qualitative risk analysis uses descriptors to de-scribe the frequency of landsliding and the conse-quences. This may comprise tools such as risk rat-ing systems, risk scorrat-ing schemes, and risk rankrat-ing matries (e.g. Stewart, et al. 2002). These can serve a useful role in landslide risk management in pro-viding a relative comparison of risks of different sites and prioritisation of follow-up actions in ad-dressing the risk portfolio posed by a large number of sites. In some cases, a hybrid approach may be adopted whereby qualitative risk analysis can fa-where n is the number of landslide hazards.
This assumes that the hazards are independent of each other, which may often not be correct. If one or more of the hazards may result from the same causative event e.g. a single rain event, or earthquake, then the probabilities should be esti-mated using the theory of uni-modal bounds as fol-lows:
cilitate a ‘first-pass’ screening of the more domi-nant hazards in a given site so that attention can be focused on the more deserving areas or hazards, which can be evaluated in detail using quantitative methods. Qualitative risk assessment may also be used, coupled with engineering judgement, to ex-amine whether a given landslide hazard is posing a significant risk to life (e.g. a precariously perched boulder above a busy highway with signs of dis-tress) and the need for prompt risk reduction measures (e.g. boulder removal) in order to safe-guard public safety, without the need for elaborate quantitative analysis. In general, qualitative risk assessment must be undertaken critically and pref-erably subject to expert review to avoid spurious outcomes and for it to be value-adding.
Qualitative Risk Analysis Matrix –Classes of Risk to Prop-erty
Consequences to property Likelihood
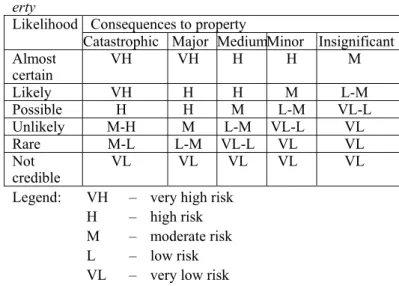
Catastrophic Major MediumMinor Insignificant Almost certain VH VH H H M Likely VH H H M L-M Possible H H M L-M VL-L Unlikely M-H M L-M VL-L VL Rare M-L L-M VL-L VL VL Not credible VL VL VL VL VL
Legend: VH – very high risk
H – high risk
M – moderate risk
L – low risk
VL – very low risk
Table 1 gives an example adapted from AGS (2000). In this case, the “likelihood” incorporates the frequency of landsliding, the probability of the landslide reaching the element at risk, and tempo-ral spatial probability. The consequences incorpo-rate the vulnerability and the value of the element at risk.
Combining likelihood with consequence results in a risk matrix divided into 5 classes from very low risk (VL) to very high risk (VH).
Other schemes may be developed by the geo-technical risk analyst in consultation with the own-ers or other stakeholdown-ers where appropriate, to best suit a given problem.
Qualitative risk assessment is subject to limita-tions, which include potentially imprecise and sub-jective description of the likelihood term, for ex-ample “adverse or “could occur” and hence are liable to result in wide differences in the estimated risks, together with lack of risk acceptance criteria against which the qualitatively assessed risks can be evaluated.
Table 1. Example of qualitative terminology for use in as-essing risk to property – adapted from AGS (2000)
s
Qualitative Measures of Likelihood of landsliding
Level Descriptor Description A B C D D E Almost certain Likely Possible Unlikely Rare Not credible
The event is expected to occur The event will probably occur un-der adverse conditions
The event could occur under ad-verse conditions
The event could occur under very adverse circumstances
The event is conceivable but only under exceptional circumstances The event is inconceivable or fan-ciful
AGS (2000) recommended that schemes such as that shown in Table 1 are only applicable to con-sideration of risks to property. Extreme care must be exercised where qualitative risk assessment ap-proaches are used for estimating risk of loss of life and decision-making on site-specific basis, espe-cially for marginal cases, because of the associated shortcomings
Qualitative Measures of Consequences to Property
Level Descriptor Description 1 2 3 4 5 Catastrophic Major Medium Minor Insignificant
Structure completely destroyed or large scale damage requiring major engineering works for stabilisation. Extensive damage to most of struc-ture, or extending beyond site boundaries requiring significant sta-bilisation works.
Moderate damage to some of struc-ture, or significant part of site requir-ing large stabilisation works.
Limited damage to part of structure, or part of site requiring some rein-statement/stabilisation works. Little damage
5 LANDSLIDE RISK ASSESSMENT 5.1 Risk assessment process
Risk assessment involves taking the outputs from the risk analysis and comparing them against val-ues judgements and risk tolerance criteria to de-termine if the risks are low enough to be tolerable.
The process is one of making judgements, tak-ing account of political, legal, environmental, regu-latory and societal factors. The decision is usually the responsibility of the owner and regulator, sometimes consulting with the affected public or stakeholders. Non-technical clients may seek guid-ance from the risk analyst on whether to accept the risk, but from a legal viewpoint it is important that the owner and regulator make the final decision.
Assessment of the risk may involve considera-tion of values such as:
(a) Property or financial loss − Annualised risk cost
− Financial capability
− Impact on corporate reputations − Insurance available
− For railways and roads; accidents per million tonnes of freight hauled, frequency of accidents − Indirect costs e.g. loss of road access
− When mitigation measures are being consid-ered, cost benefit ratio.
(b) Loss of life − Individual risk to life.
− Societal risk e.g. as a frequency versus number of deaths (known as f – N) or cumulative fre-quency versus number of deaths (known as F – N) criteria.
− Annualised potential loss of life
− When mitigation measures are being consid-ered, cost per statistical life saved.
5.2 Risk acceptance criteria
It is important to recognise the difference between acceptable and tolerable risks:
Acceptable risk: A risk which everyone im-pacted is prepared to accept. Action to further re-duce such risk is usually not required unless rea-sonably practicable measures are available at low cost in terms of money, time and effort.
Tolerable risk: A risk within a range that soci-ety can live with so as to secure certain net bene-fits. It is a range of risk regarded as non-negligible, and needing to be kept under review and reduced further if possible.
Factors that affect an individual's attitude to ac-ceptable or tolerable risk will include (adapted from AGS 2000):
− Resources available to reduce the risk.
− Whether there is a real choice, e.g. can the per-son afford to vacate a house despite the high risk?
− The individual’s commitment to the property and its value relative to the individuals income. − Age and character of the individual.
− Exposure the individual has experienced in the past, especially with regards to risk associated with landslides.
− Availability of insurance.
− Regulatory or policy requirements.
− Whether the risk analysis is perceived to be re-liable.
There are some common general principles that can be applied when considering tolerable risk to loss of life criteria (IUGS 1997):
− The incremental risk from a hazard to an indi-vidual should not be significant compared to
other risks to which a person is exposed in eve-ryday life.
− The incremental risk from a hazard should, wherever reasonably practicable, be reduced, i.e. The As Low As Reasonably Practicable (ALARP) principle should apply.
− If the possible loss of life from a landslide inci-dent is high, the likelihood that the inciinci-dent might actually occur should be low. This ac-counts for society’s particular intolerance to in-cidents that cause many simultaneous casual-ties, and is embodied in societal tolerable risk criteria.
− Persons in society will tolerate higher risks than they regard as acceptable, when they are unable to control or reduce the risk because of financial or other limitations.
− Higher risks are likely to be tolerated for exist-ing slopes than for planned projects, and for workers in industries with hazardous slopes, e.g. mines, than for society as a whole.
These principles are common with other dan-gers such as Potentially Hazardous Industries (PHI) and dams. (IUGS 1997) considered that there are other principles that are applicable to risk from slopes and landslides:
− Tolerable risks are higher for landslides on natural hillsides than those from engineered slopes.
− Once a natural slope has been placed under monitoring, or risk mitigation measures have been executed, the tolerable risks approach those of engineered slopes.
− Tolerable risks may vary from country to coun-try, as well as within a councoun-try, depending on historic exposure to landslide hazard, and the system of ownership and control of slopes and natural landslides hazards.
There are no universally established individual or societal risk acceptance criteria for loss of life due to landslides. Guidance on what has been ac-cepted in various countries is given in SOA 6 in this volume.
The following are some examples: (i) Individual risk
AGS (2000) suggested that, based on criteria adopted for Potentially Hazardous Industries, Aus-tralian National Committee on Large Dams (COLD 1994, which were also adopted in AN-COLD 2003); and the review in Fell and Hartford (1997) the tolerable risk criteria shown in Table 2 “might reasonably be concluded to apply to engi-neered slopes”. They suggested that acceptable risks are usually considered to be one order of magnitude smaller than these tolerable risks.
It should be noted the AGS (2000) guidelines do not represent a regulatory position. ANCOLD (2003) deleted reference to the “average of persons
at risk”, taking account only of the person most at risk.
Table 2. AGS (2000) suggested tolerable risk criteria Situation Suggested tolerable risk for loss of life Existing
engi-neered slopes 10
-4/annum person most at risk
10-5/annum average of persons at risk
New engineered
lopes 10
-5/annum person most at risk
10-6/annum average of the persons at risk
s
(ii) Societal risk
The application of societal risk to life criteria is to reflect the reality that society is less tolerant of events in which a large number of lives are lost in a single event, than of the same number of lives are lost in a large number of separate events. Examples are public concern to the loss of large numbers of lives in airlines crashes, compared to the many more lives lost in small aircraft accidents.
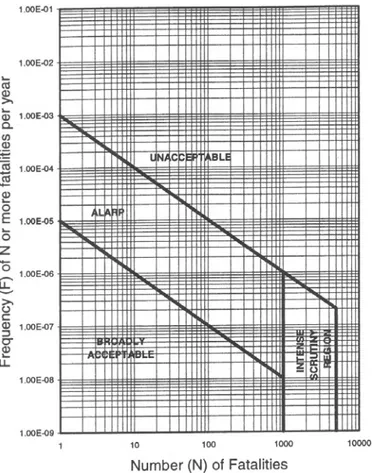
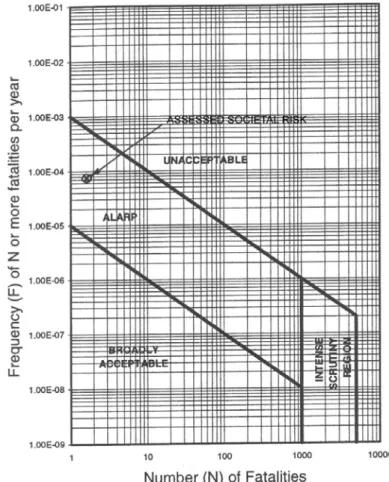
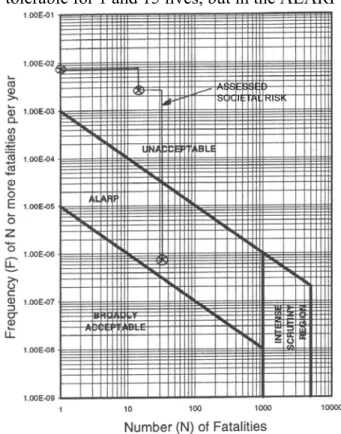
The use of cumulative F-N curves to reflect this is not universal. An example which has been tri-alled on an interim basis to assist landslide risk management of natural hillside hazards is shown in Figure 4.
Figure 4 – Interim societal risk tolerance criteria (Geotechni-cal Engineering Office, 1998).
Christian (2004) also discusses the use of F-N criteria. He suggests that using the output of prob-abilistic analyses is hindered by the
well-established fact that people, including engineers, have a lot of trouble understanding small probabili-ties and that in recent years, the f-N and F-N dia-grams have proven to be useful tools for describing the meaning of probabilities and risks in the con-text of other risks with which society is familiar. He points out that computed absolute probabilities may not include all contributions; an effective ap-proach is to compare probabilities of different op-tions or alternatives. Probabilistic methodologies also provide insight into the relative contributions of different parameters to the uncertainty of the re-sult and thus give guidance for where further in-vestigations will be most fruitful.
Whether such quantitative criteria as the exam-ples given are acceptable in principle will depend on the country and legal system in which the land-sliding is being considered. In some societies, e.g. Australia, Hong Kong, and the United Kingdom, the use of such criteria for Potentially Hazardous Industries, and to a lesser extent dams and land-slides is gaining acceptance. In others, such as France, the legal framework currently precludes the use at least in absolute terms. This is discussed further in SOA6.
As pointed out in IUGS (1997), those who use QRA for slopes and landslides should keep the fol-lowing in mind when analysing, assessing and managing risk:
(a) Estimates of risk are inevitably approximate, and should not be considered as absolute values. This is best understood by allowing for the uncer-tainty in the input parameters, and in reporting the risk analysis outcomes.
(b) Tolerable risk criteria are themselves not ab-solute boundaries. Society shows a wide range of tolerance to risk, and the risk criteria are only a mathematical expression of the assessment of gen-eral societal opinion.
(c) It is often useful to use several measures of tolerable risk criteria, e.g. f-N pairs, individual and societal risk, and measures such as cost to save a life and maximum justifiable cost if risk mitigation is being considered.
(d) It must be recognised that QRA is only one input to the decision process. Owners, society and regulators will also consider political, social and legal issues in their assessments and may consult the public affected by the hazard.
(e) The risk can change with time because of natural processes and development. For example: − Depletion of debris from slopes can lead to a
reduction in risk with time
− Removal of vegetation by natural processes, e.g. fire or human intervention, can lead to an increase in risk
− Construction of roads on a slope may increase the probability of landsliding and/or the ele-ments at risk, and hence the risk.
(f) Extreme events should be considered as part of the spectrum of events. This is relevant to the triggering events (landslides, earthquake) the size of the landslide and the consequences. Sometimes it is the smaller, more frequent, landslides that con-tribute most to risk, not the low frequency very large event.
6 LANDSLIDE RISK MANAGEMENT 6.1 Risk management process
The outcomes of the Risk Assessment will be ei-ther:
(a) The risks are tolerable, or even acceptable and no mitigation options need be considered.
or
(b) The risks are intolerable, and risk mitigation options need to be considered.
The risk management process is iterative, re-quiring consideration of the risk mitigation options and the results of the implementation of the mitiga-tion measures and of the monitoring.
Examples of options for mitigation of risks for a slope or group of slopes would include:
− Reduce the frequency of landsliding – by stabi-lization measures such as groundwater drainage, slope modification, anchors; or by scaling loose rocks,
− Reduce the probability of the landslide reaching the element at risk – e.g. for rockfalls, construct rock catch fences; for debris flows construct catch dams;
− Reduce the temporal spatial probability of the element at risk e.g. by installing monitoring and warning systems so persons can evacuate; relo-cation of buildings to be further from the land-slide;
Other risk management options may include: − Avoid the risk – e.g. abandon the project,
seek-ing an alternative site or form of development such that the risk will be tolerable
− Transfer the risk, by requiring another authority to accept the risk, or to compensate for the risk such as by insurance (for property)
− Postpone the decision if there is sufficient un-certainty, awaiting the outcomes of further in-vestigations, assessment of mitigation options, and monitoring. This would usually only be a temporary measure.
Finally a risk mitigation plan will be decided upon. There may be elements of control in this plan – i.e. regulations imposed by local or other governments.
For hazard analysis for land use planning, the emphasis may be on limiting building development to those areas where risks are assessed as likely to be acceptable, and using the higher hazard areas
for low occupancy use such as sports field or pas-sive recreation. In some cases mitigation measures as outlined above may be appropriate.
Apart from the consideration of risk mitigation using engineering measures, landslide risk man-agement also consists of the use of ‘soft’ (or non-engineering) options, such as public education campaigns, public information services, etc. to ad-dress the issue of risk tolerance by the general pub-lic or the stakeholders and avoid unduly high ex-pectations of the level of safety that can be achieved in practice. Risk tolerance is related, in part, to the perception and understanding of land-slide risk. Risk communication to lay people forms a key element of the landslide risk management process in facilitating a better understanding of the nature and reality of landslide risk, and promoting the build-up of trust in, and credibility of, the risk analyst. Geotechnical professionals involved in landslide risk assessment and risk management have an important role to play in risk communica-tion, which is best done using languages and means that can be easily comprehensible by the general public.
7 THE BENEFITS AND LIMITATIONS OF LANDSLIDE RISK MANAGEMENT
Some of the benefits of the use of quantitative risk assessment in landslide risk management include:
(a) It encourages a rational, systematic approach to assessing the safety of natural and engineered slopes, by requiring an assessment of the charac-teristics of the landslides, their travel distance and velocity, frequency of sliding, the elements at risk, their temporal spatial probability and vulnerability.
(b) It can be applied to situations which are not amenable to conventional deterministic analysis e.g. rockfalls, small landslides in cut slopes, shal-low landslides and resulting debris fshal-lows on steep natural slopes.
(c) It can be applied to land-use planning, with specific loss of life acceptance criteria used to de-termine the zoning where building is acceptable.
(d) It allows comparison of risks across an owner’s portfolio of slopes e.g. cut slopes on highways, and thereby allows prioritisation of re-medial works, and potentially setting of risk-based standards for acceptable designs.
(e) Some local and regional government plan-ners are familiar with risk management principles, and welcome landslide risk management being presented in terms they can relate to other hazards.
(f) The process requires consideration of risks for all levels of loading, rather than relying on “ex-treme event” loadings. Often failure paths will be identified in the analysis which have been over-looked.
(g) It focuses attention or what happens if the slope fails, including the possibility of the slide travelling rapidly onto buildings below, causing damage and loss of life.
(h) It focuses attention on liabilities and respon-sibilities if the parties involved.
(i) It provides a framework to put uncertainties and engineering judgement into a system. This re-sults in an enhanced awareness of the need to con-sider uncertainties, and insight on what can go wrong, and their potential consequences, together with how the uncertainties and risks can be best managed
(j) It provides an open and transparent process on the nature and key contributors of landslide risk and the corresponding uncertainty for discussion with the regulators, owners, stakeholders, etc.
(k) It allows systematic consideration of risk mitigation options and cost benefit ratios, consis-tent with the As Low As Reasonably Practical (ALARP) principles, thus encouraging optimisa-tion and enhancing cost benefit.
Some of the challenges and perceived limita-tions include (adapted from IUGS 1997):
(a) The potential uncertainty in estimating fre-quencies, travel distance and vulnerability. How-ever these uncertainties can be modelled in the analysis, or sensitivity studies done to get a feel for their influence.
(b) The variety of approaches, and the need for expert judgement to assess frequency of landslid-ing in many cases. This requires those dolandslid-ing the analysis to be trained, and “calibrated”. Baynes et al (2002) give a good example of how this can be achieved.
(c) Revisiting an assessment can lead to a sig-nificant change in the assessed risk due to in-creased data, or development of more advanced methods. This however is common to a “conven-tional deterministic” approach.
(d) Poor estimates of risk because significant hazards have been overlooked. This is a problem whichever approach is used, and can only be over-come by using well trained and experienced geo-technical professionals to do the analyses.
(e) Results of an assessment are seldom verifi-able. A possible approach to overcome this is to use systematic peer review by individuals or for larger projects, panels. The first author has seen how successful this can be in risk assessment for dams. For slopes, where budgets are often smaller, peer review while still essential, is more likely to be done on a sample of the slopes being assessed, but it still should be done.
(f) Acceptable and tolerable loss of life criteria for slopes and landslides are not well established. This is an issue which has to be overcome at the country, state or local government level. It will not be practical to establish universal guidelines,
al-though inevitably people will refer to what it is be-ing done in societies with similar legal and social values.
(g) Some over rely on the results of risk as-sessments – and do not understand the uncertainty in the probabilities calculated. This is for the ana-lyst to understand, and convey in the reporting process and when communicating with the public.
(h) The authors’ experience is that many ex-perienced practitioners are reluctant to use quanti-tative approaches to estimating landslide frequen-cies, because of their lack of experience in doing this. This needs to be addressed by systematic, on the site training and review by experienced profes-sionals.
(i) There is still a lack of general acceptance of the method by the profession. It should be recog-nised that QRA is an engineering tool that may be used for an appropriate problem or to supplement other conventional tools for landslide risk man-agement
8 EXAMPLES OF LANDSLIDE RISK
ASSESSMENT
Figures 5, 6 and 7 give examples of certain ele-ments of landslides risk assessment. These are simplified to illustrate the basic principles in-volved. Note that for convenience it has been as-sumed that the tolerable risk criteria in Table 2 and Figure 4 apply to the cases considered. Other ex-amples can be found in Lee and Jones (2004), La-casse (1998), Ho et al (2000), and Fell and Hart-ford (1997).
9 CONCLUDING REMARKS
(a) The risk management framework presented in this paper has been successfully used in land-slide risk assessment and management for engi-neered and natural slopes. The framework may be adapted to suit a variety of problems, with due re-gard to the nature of the issues involved.
(b) Recent developments have included more widespread use of quantitative methods; more re-fined hazard and risk zoning which often involves use of digital technologies; improved rainfall-landslide incidence correlation models; and im-proved methods for assessing travel distances and travel paths.
(c) While the emphasis in this paper is on quan-titative methods, current practice also involves the use of risk-based qualitative methods in many ap-plications, including management of landslide risks for roads and railways, and in land use plan-ning. These are valuable in that the landslide proc-esses are systematically studied, and can lead to
0 5 10m Scale ? ? ? Road Danger -landslide in roadfill Elements at risk -house and persons Seepage
Range of travel distance angle 13
20
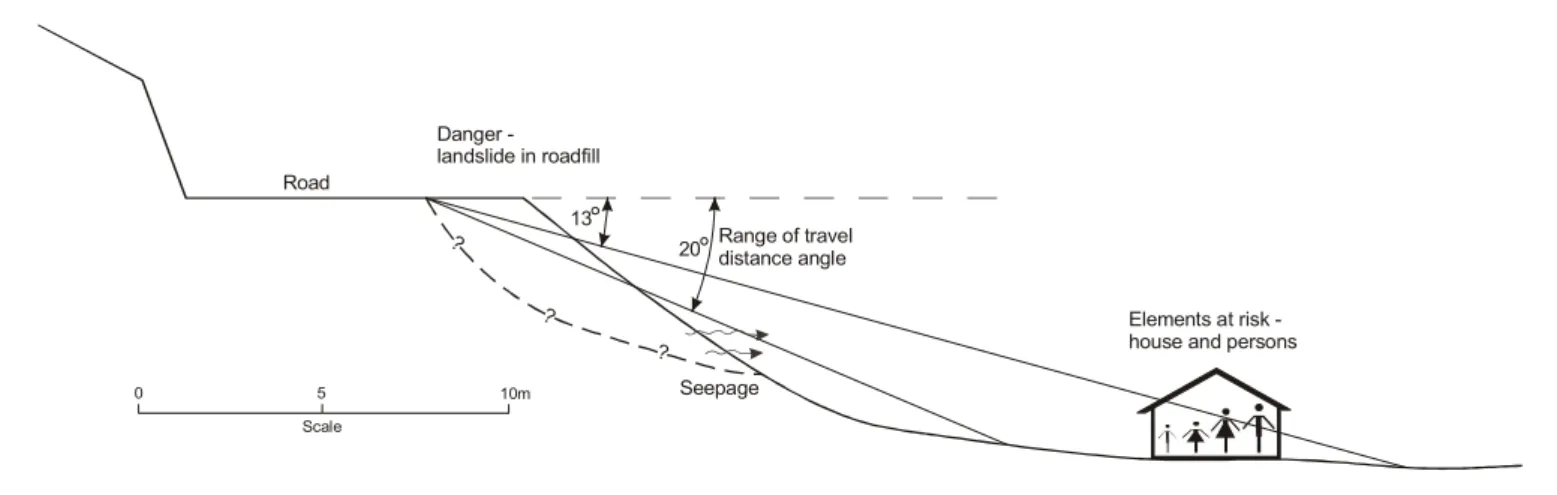
FIGURE 5 –EXAMPLE I – LANDSLIDING IN ROAD FILL
1. Scope definition
Calculate the risk to persons living in the house below a road as shown in the figure. Assess the tolerability of this risk against the tolerable risk criteria shown in Table 1 and Figure 4.
2. Risk analysis
(i) Danger (Landslide) characterisation
The road was built 50 years ago, by cut and fill with a bulldozer. There was no proper compaction of the fill. The site is underlain by granitic rocks, and the fill is derived from residual soils and completely weathered granite which classifies as a silty sand. A thorough search of records has indicated that over the length of this road, which is all in similar topography, geology and climatic conditions to this fill, there have been 4 land-slides in a total of 60 fills.
Based on the geometry of the fill, and the landslides which have occurred, it is assessed that the likely vol-ume of the slide is about 1000m3. Because of the loose, saturated nature of the fill it is anticipated that there may be a large loss of undrained shear strength on sliding (“static liquefaction”) and the movement after fail-ure is likely to be rapid.
Using empirical methods, it is estimated that the travel distance angle will be between 13o and 20o. Based on this estimate, and the geometry of the slope, it is estimated that the probability of the landslide reaching the element at risk (the house and its occupants) PT:L = 0.4.
(ii) Frequency analysis
Assuming this fill is similar to the other 60 fills on the road and that the 50 years of the road’s performance road is representative of the future, the frequency of sliding of the fill is:
annum / 10 x 33 . 1 50 x 60 4 PL = = −3
(iii) Consequence analysis
(a) Temporal spatial probability (P(S:T)) of the persons
Four persons live in the house. One of those persons is in the house 20 hours per day, 7 days per week; while the other three are in the house 12 hours per day, 2 days per week.
For the person most at risk: For the other three persons: 83 . 0 24 20 P(S:T) = = .14 7 24 ) T : S ( 0 2 x 12 P = = 14 . 0 7 2 x 24 12 P(S:T) = = assuming no warning.
(b) Vulnerability (of the persons (V(D:T))
Based on the volume of landsliding, its likely velocity when it hits the house, it is estimated that the vul-nerability of the persons to being killed if they are in the house when the landslides hits is 0.4.
FIGURE 5 continued
(iv) Risk estimation
The annual probability of the person most at risk losing his/her life is
annum / 10 x 7 . 1 annum / ) 4 . 0 ( x ) 83 . 0 ( x ) 4 . 0 ( x ) 10 x 33 . 1 ( V x P x P x P P 4 3 ) T : D ( ) T : S ( ) L : T ( ) L ( ) LOL ( − − = = =
The annual probability of four persons being in the house where it is hit by the slide (assuming the time they spend in the house overlap)
annum / 10 x 74 . 0 ) 14 . 0 ( x ) 4 . 0 ( x ) 10 x 33 . 1 ( 4 3 − − = =
Since their vulnerability is 0.4, so 1.6 persons (say 1 to 2) would be killed.
3. Risk assessment
(i) Risk evaluation
(a) Individual Risk
From Table 2, the tolerable individual risk for an existing slope is 1 x 10⁻⁴/annum; so for the individual most at risk, with P(LOL) = 1.7 x 10⁻⁴, the risk is just in the intolerable range.
(b) Societal Risk
From Figure 4 reproduced below, the societal risk is below the limit of tolerability line, but in the ALARP region.
(ii) Comment
At this time, possible risk mitigation options would be considered, and the risks re-calculated. The ALARP principle might be used along with values judgements to determine a risk mitigation and/or monitoring plan, or to consider doing more geotechnical investigations to get an improved more accurate assessment of the risk.
0 5 10m Scale
Danger -
rockfall in road cuttings
Elements at risk - vehicles and their occupants
Highway Lane
N LaneS
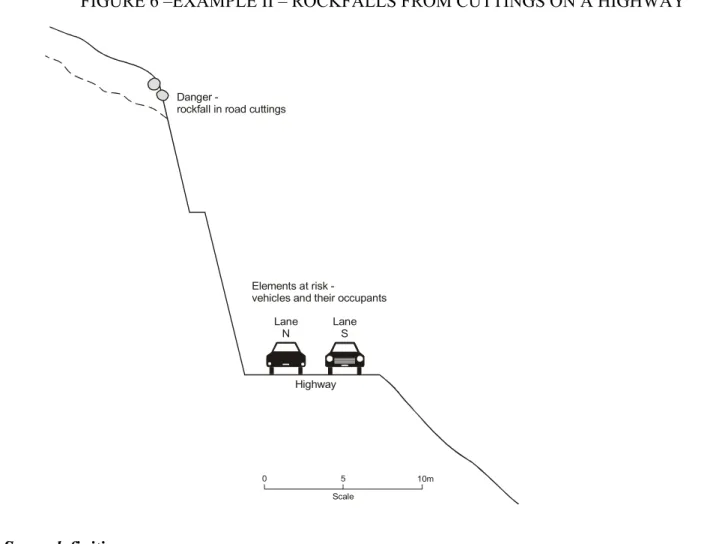
FIGURE 6 –EXAMPLE II – ROCKFALLS FROM CUTTINGS ON A HIGHWAY
1. Scope definition
Calculate the risk to persons travelling on the highway as shown in the figure. Assess the tolerability of this risk against the tolerable risk criteria shown in Table 1 and Figure 4. Only consider direct impact falls.
2. Risk analysis
(i) Danger (landslide) characterisation
The road to a ski resort is privately owned and was built 10 years ago. The 50 cuts in the road were con-structed at relatively steep slopes, and without treatment to control weathering, erosion and shallow instability leading to rockfalls.
A thorough search of the maintenance records and observations of boulder impacts on the road surface in-dicated that for the average cutting on the road, there have been 2 rockfalls per annum, with boulders ranging in size from 0.5m dia to 1m dia. The cuttings are in similar topography, geology and climatic conditions. Based on the recorded boulder impacts on the road surface, and the use of rockfall simulation programs, it is assessed that 60% of rocks falling from the slope will impact on Lane N which is closest to the cut, and 10% on Lane S.
(ii) Frequency analysis
The average frequency of rockfalls for each cutting is 2 per annum. There are a total of 50 cuts along the road, giving a total of 100 rockfalls per annum or 0.27/day, the average frequency of rockfalls (NR) onto lane,
N = 0.6 x 0.27 = 0.16/day, and on Lane S, = 0.1 x 0.27 = 0.027/day.
(iii) Consequence analysis
(a) Temporal spatial probability (P(S:T)) of vehicles
The probability of a vehicle occupying the length of road onto which the rock falls is given by
V V ) T : S ( V 1 1000 L 24 N P = • •
FIGURE 6 continued
L = average length of vehicle (metres) VV = velocity of vehicle (km/hour)
For each lane, the average number of vehicles per day over the year is 2000, the average length of the ve-hicles is 6 metres, and they are travelling at 60 km/hr, ignoring the width of the boulder:
For each lane For a particular vehicle travelling once each day in one direc-tion 0083 . 0 60 1 1000 6 24 2000 P(S:T) = • • = 0000042 . 0 60 1 1000 6 24 1 P(S:T) = • • =
(b) Vulnerability of the persons in the vehicles V(D:T)
Based on published information and judgement, it is estimated that the vulnerability of persons in vehicles in lane N is 0.3 and in lane S, 0.15.
(iv) Risk estimation
The annual probability of the person most at risk losing his/her life by driving along the road is:
(a) For lane N (b) For lane S
annum x x V x P V x P P N DT T S T D S LOL R / 10 0 . 2 3 . 0 ) ) 0000042 . 0 1 ( 1 ( ) ) 1 ( 1 ( 7 16 . 0 : ) : ( : ) ( ) ( − = − − = − − = = ) annum x x PLOL / 10 3 . 0 15 . 0 ) 0000084 . 0 1 ( 1 ( 7 027 . 0 ( − = − − =
The total probability of death for the person most at risk is 2.3 x 10⁻⁷/annum. For a person who only travels on the road once per year in each direction, P(LOL) = 6.3 x 10⁻¹⁰/annum (2.3 x 10⁻⁷/365). The total annual risk
assuming each of the 2000 vehicles/day carries an average of 3 persons is 2000 x 365 x 3 x 6.3 x 10-10/annum = 0.0014 persons/annum. The F-N plot has not been determined in this case.
3. Risk assessment
(i) Risk evaluation
(a) Individual risk
From Table 1, the tolerable individual risk for existing slopes is 1 x 10⁻⁴/annum. So for the individual most at risk, with P(LOL) = 2.3 x 10⁻⁷/annum, the risks are within the tolerable limit. For an individual who drives on
the road only once per year, the risk is 6.3 x 10⁻¹⁰/annum, which would be acceptable. The societal risk limit of tolerability for one life lost is 10-3/annum (see Figure 4). The estimated probability of one or more lives lost is about 5 x 10⁻⁴/annum, near the tolerable limit.
(ii) Comment
(a) It is considered reasonable to sum the risks for all the road cuttings because the road is the responsibil-ity of one organization.
(b) At this time, risk mitigation options would be considered. These could include engineering option to reduce the frequency of rockfalls (rock-bolting, shotcreting, scaling of loose rocks in a regulated manner); re-ducing the probability the rocks will fall onto the road (e.g. mesh protection over the slope, catch drain); or reducing the probability of vehicles being below a rockfall when it occurs (e.g. closing the road in periods of heavy rain if it could be demonstrated that is when most rockfalls occurred).
Mine waste Water table Cracked culvert Concrete culvert SECTION A-A A A S tre am S tre am Road Overflow water Houses Culvert 0 100 200m Scale PLAN 180 160 140 120 100 200 180 160 140 120 100 200 Danger
-landslide in mine waste
Elements at risk
-houses and their occupants
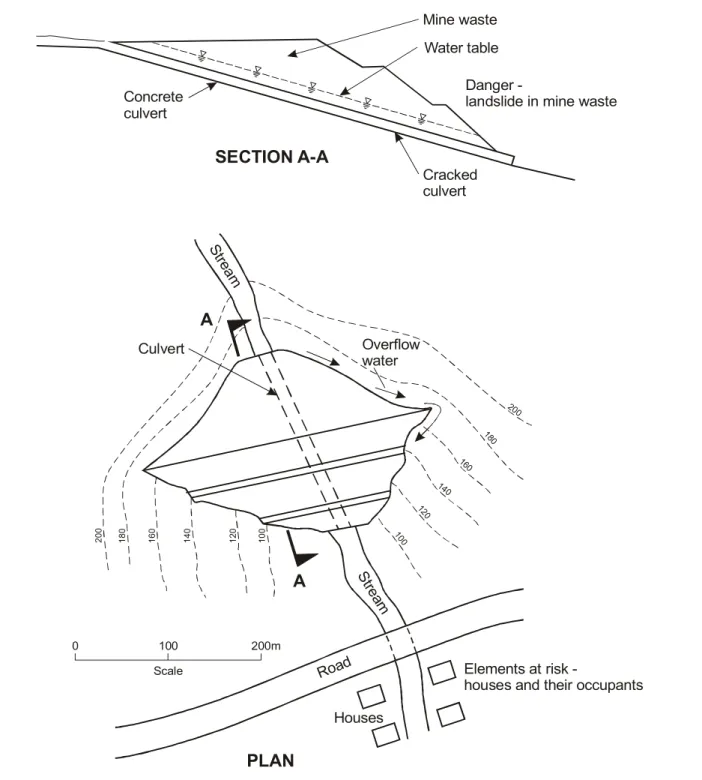
FIGURE 7 –EXAMPLE III– LANDSLIDING OF MINE WASTE DUMP
1. Scope definition
Calculate the risk to persons living in the houses and travelling on the road below the mine waste dump. As-sess the tolerability of these risks against individual and societal tolerable risk criteria.
2. Risk analysis
(i) Danger (landslide) characterisation
The mine waste is silty sandy gravel and gravelly silty sand coarse reject from a coal washing. It was de-posited over 50 years by end tipping. Geotechnical site investigations, hydrological and engineering analyses have shown that:
(a) The waste is loose, and the lower part is saturated.
(b) The waste is likely to liquefy and flow liquefaction occurs for earthquakes loadings larger than 10-3 AEP
(c) The culvert through the waste dump exceeds its capacity and runs full for floods greater than 0.1 AEP. For floods larger than this water flows over the sides of the waste dump and leaks onto the waste material through cracks in the culvert, increasing the pore pressures in the waste.