Mem. Natl Inst. Polar Res., Spec. Issue, 52, 89-101, 1998
IRREGULAR OZONE DEPLETION EVENTS IN THE ANTARCTIC TROPOSPHERE RECORDED AT NEUMAYER STATION
IN 1992 AND 1993
Silke WESSEL 1, Andreas HERBER 1, Hartwig GERNANDT1, Shuhji AoK12,
Peter WINKLER3, Rolf WELLER4 and Otto ScHREMs4
1 Alfred Wegener Institute for Polar and Marine Research, Research Unit Potsdam, Te/egrafenberg A 43, D-14473 Potsdam, Germany
2 Centre of Atmospheric and Oceanic Studies, Faculty of Science, Tohoku University, Aoba-ku, Sendai 980-8578
3 Meteorologisches Observatorium Hohenpeissenberg, Albin-Schwaiger Weg 10, D-82383 Hohenpeissenberg, Germany
4 Alfred Wegener Institute for Polar and Marine Research, Postfach 12 OJ 61, D-27515 Bremerhaven, Germany
Abstract: Continuous surface ozone measurements and regular ECC ozone sonde launches were used, in order to study the dynamical processes during the formation of tropospheric ozone depletion events at Neumayer Station (70°S, 08°W) in 1992 and
1993. Meteorological data, weather charts, ice charts as well as trajectory calcula tions have been considered for this analysis. Altogether eight events of surface ozone minima were recorded, four of them from June to August 1992 and another four in the period from August to September in 1993, respectively. The duration of these low ozone events was about 1-2 days. During this time ozone mixing ratios varied between 8 ppbv and 24 ppbv. Ozone sonde data showed that those ozone poor layers were restricted to the planetary boundary layer up to a subsidence inversion, indicating their upper limit. In general, those ozone poor air masses were exposed by sunlight during transport across the ice covered Southern Ocean. Beside these general fea tures, typical cases could be identified which might be explained by the special dynamical conditions in the Antarctic coastal region. In September 1993 two events with an elevated ozone poor layer were observed due to the influence of continental winds. In June 1992 an ozone minimum was also detected at Neumayer Station during polar night conditions. In this case the ozone depleted air mass was probably transported from sunlit regions located northward from Neumayer Station where the exposure by sunlight occurred.
1. Introduction
During springtime a strong variability of surface ozone mixing ratios, accompanied by strong ozone depletion events, were observed in the Arctic region at several measuring sites like Ny-Alesund, Spitsbergen (79°N, l2°E) (WESSEL et al., 1997; SOLBERG et al., 1996), Barrow, Alaska (71 °N, 156°W) (OLTMANS et al., 1989) or Alert, Canada (82°N, 62°W) (BARRIE et al., 1988) where it was first noticed during spring 1985 (BoTTENHEIM et al., 1986). These tropospheric ozone minima are characterised by a distinct decrease of surface ozone mixing ratios from around 40 ppbv to values close
to the detection limit of around 1 ppbv within a few hours (BARRIE et al., 1988; OLTMANS et al., 1989).
Investigations at Arctic sites point to an increase of particulate and gaseous bromine compounds, coinciding with the strong decrease of surface ozone (BARRIE et al., 1988). Based on this anti-correlation between surface ozone and bromine com pounds a catalytic photochemical ozone destruction mechanism, including reactive bromine, was proposed (BARRIE et al., 1988). A natural source of bromine may be bromoform, which is released by macro algae (BARRIE et al., 1988), or sea-salt aerosols (FINLAYSON-PITTS et al., 1990). Beside these primary sources of reactive bromine, an additional activation of nonreactive bromine compounds probably forced by catalytic processes in the gas phase and heterogeneous reactions on aerosol or ice particle surfaces seems to be necessary in order to explain the observed ozone destruction rates (LEBRAS and PLATT, 1995; FAN and JACOB, 1992). The influence of anthropogenic components like nitrogen-oxides, which are able to liberate bromine from sea-salt aerosols (FINLAYSON-PITTS et al., 1990) is not clarified yet.
Beside these photochemical reactions, which are directly responsible for the de struction of ozone, dynamical processes control the spatial and temporal appearance of ozone depleted air masses. In the Arctic measurements of the vertical distribution of tropospheric ozone performed by tethersondes (ANLAUF et al., 1994) and electrochem ical ozone sondes (SOLBERG et al., 1996; WESSEL et al., 1997) showed a vertical extension of ozone depletion up to several hundred meters during such events. In general, a subsidence inversion coincides with the upper boundary of the ozone poor layer. Trajectories pointed towards the ice-covered areas of the Arctic Ocean as the source region for these ozone depleted air masses (ANLAUF et al., 1994).
For the Antarctic region surface ozone measurements at the Japanese Syowa Station and the German Neumayer Station indicated comparable low ozone events as they were observed in the Arctic (MURAYAMA et al., 1992; WYPUTTA, 1994). In a previous study (WESSEL et al., 1998) a detailed comparison between tropospheric ozone variations in the Arctic (Ny-Alesund, Spitsbergen) and Antarctic (Neumayer Station) for 1993/1994 was carried out and showed revealed similar characteristic features of tropospheric ozone minima in both regions. As it was already observed at Arctic measuring sites, the Antarctic ozone poor air masses were also generally restricted to the planetary boundary layer up to a subsidence inversion at their upper limits. The Antarctic ozone depleted air masses were also associated with the advection of air masses emanating across ice covered, sunlit regions of the Southern Ocean. The corresponding observation of tropospheric ozone minima in the pristine Antarctic points to natural processes causing these phenomenon in polar regions.
The aim of this study is to discuss an extended Antarctic data set with respect to these irregular ozone depletion events in the troposphere as recorded at Neumayer Station (70° S, 08° W) from January 1992 to December 1993 and we will give a first interpretation concerning the dynamical processes.
2. Observations and Data Analysis
Ozone Depletion Events in the Troposphere 91 about 5 km apart from the Atka Bay shore region. Its elevation is 42 m above sea level. The surrounding is flat and snow covered with a gentle slope upwards to the south.
Surface ozone mixing ratios were continuously measured by a wet-chemical ozone analyser, described in detail by ATTMANNSBACHER ( 1971). This analyser was installed inside a small airchemistry observatory, which was located about 1.5 km south of Neumayer Station. With main wind directions coming from eastern directions no local pollution influenced the surface ozone measurements. The ozone mixing ratios were recorded in the range between O ppbv to 100 ppbv with a precision of 1-3 % . Meteor ological data as temperature, relative humidity, wind direction, and wind speed are recorded at 2 m and 10 m altitude as well as air pressure were regularly provided by synoptic observatories (KONIG-LANGLO and HERBER, 1996).
At the Neumayer Station electrochemical ozone sondes were regularly launched once per week. For these ozone soundings a VAISALA RS 80-15 NE radiosonde is connected via interface to an ECC ozone sensor ( KoMHYR, 1986). A 1200 g TOTEX balloon is used for these soundings. Simultaneously the vertical ozone distribution of ozone partial pressure as well as profiles of temperature, relative humidity, wind speed, wind direction, and pressure are obtained. The data reception and processing is carried out by a DigiCORA system (KONIG-LANGLO and HERBER, 1996). The ascent velocity of the balloon was about 5 m/s. Together with the inherent time constant of the ECC-sonde of approximately 20 seconds an effective height resolution of about 100 m is achieved for ozone partial pressure profiles. The precision of the ozone sonde measure ments is
<
5% (VAISALA, 1991 ). A detection limit of 0.3 nbar is derived from the 3 a variance of the zero-current noise of the electrochemical cell during calibration. 0.3 nbar correspond to 0.3 ppbv at surface level.The point surface measurements of the ozone sondes, carried out at the Neumayer Station, in approximately 1.5 km distance to the location of the continuous measure ments of the surface ozone analyser, deviate up to 20% from the continuous hourly mean surface ozone concentrations. Thus both measurements are not directly compa rable but show the same general trend concerning the surface ozone concentrations.
The 5-day backward trajectories reaching the measuring site at 00 UTC were regularly calculated once per day. These calculations were performed on a basis of a numerical weather prediction model, the Global Model of the German Weather Service
(DWD) (KoTTMEIER and FAY, 1997). Backward trajectories may be used to identify the possible origin of air masses. In this study trajectories are used with endpoint pressure levels corresponding to the actual surface pressure, 950 hPa, 850 hPa and 700 hPa, respectively. It should be noted that the model is not able to calculate trajectories for regions south of 86° S.
Additionally, weather-charts of the southern hemisphere from the Japan Meteoro logical Agency ( JMA) were used for further discussion. Maps of sea level pressure distributions were available two times a day at 0000 UTC and 1200 UTC. Information on the sea ice extend were obtained from ice charts of the NOAA Joint Ice Centre (JIC).
For convenience, the dates are given as the number of the day of the year, i.e.:
Julian Day (JD), in the following chapters and at corresponding figures. It means JD = 1 is January 1. The time is always given in UTC.
3. Results
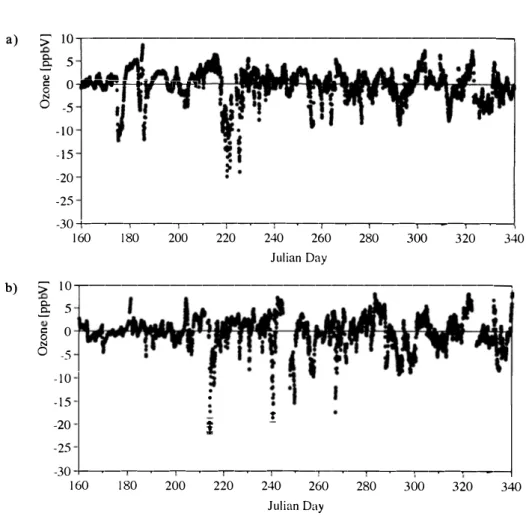
In Fig. 1 the annual variation of surface ozone mixing ratios is shown for the years 1992 and 1993. The annual maximum occurs during southern polar winter in July and the annual minimum during polar summer period from November until December. Except for the period July to October the daily variations are small, as it could be seen by the standard deviations of the daily mean values in Fig. 1. Standard deviations are more pronounced during the period from July to October. Stronger daily variations up to + 8.4 ppbv in 1992 ( JD 185) and + 6. 9 ppbv in 1993 ( JD 244) were measured. These pronounced variations indicate sudden decrease of surface ozone mixing ratios. To investigate that in more detail, the difference between the hourly mean surface ozone mixing ratios and the annual mean cycle was calculated for the period of interest between JD 160 and 340 in 1992 and 1993 (Fig. 2). The annual mean cycle was calculated using a running mean over 15 days. In both years strong negative deviations of the hourly mean values from the annual mean cycle are obvious. In our analysis an Antarctic tropospheric minimum of ozone mixing ratios is empirically defined as a negative deviation � 10 ppbv over a period of more than 5 hours. According to this definition four ozone minima were observed in 1992 and 1993, respectively (Table 1).
a) b) 45 40 35
> 30
..0 §:: 25 (l) 20 s:: 0 15 N 0 10 5 0 0 50 100 150 200 250 :300 350 Julian Day 45 40 35>
30 ..0 §:: 25 (l) 20 s:: 0 15 N 0 10 5 0 0 50 100 150 200 250 :300 350 Julian DayFig. 1. Annual cycle of surface ozone concentration (ppbv) at Neumayer Station (70° S, 08° W); upper panel: ( a) daily means with standard deviation for
Ozone Depletion Events in the Troposphere a)
>
IQ-,---, b)§
5 � 0--... ��>V---illlR-IA 0 -5 -10 -15 --20 -25 -30--1-�-��-��--,--�--,--�-..--�-,---,--,---,--,---,-� 160 180 200 220 240 260 280 300 320 340 Julian Day>
10-,---,§
52
0 0 -5 -10 -15 -20 -25. .
i
! -30-+-�--,-�--,-�--,--�-...-�-..--�-,---,--,---,--,---,-� 160 180 200 220 240 260 280 300 320 340 Julian DayFig. 2. Deviation of hourly means of ozone mixing ratio (ppbv) from the annual mean cycle at Neumayer Station (70° S, 08° W); upper panel for 1992;
lower panel for 1993, time scale is Julian Day (JD).
93
Table 1. Detected ozone minima by surface ozone measurements at Neumayer Station (70° S, 08° W) in
1992 and 1993. The duration of depleted ozone, the lowest observed mixing ratio during the minimum, and mean deviations from annual mean cycle are compiled.
Lowest ozone Mean
Year of Duration by JDs Duration by date mixing ratio during deviation
observation 03 minimum (ppbv) (ppbv) 1992 174-177 June 22-25 23 12 1992 185-186 July 03-04 24 -12 1992 219-222 August 06-09 12 -20 1992 225-226 August 12-13 12 -19 1993 214-215 August 02-03 14 -21 1993 239-241 August 27-29 13 18 1993 249-250 September 06-07 12 -15 1993 266-268 September 23-25 8 -17
In 1992 the deviation of the hourly mean values from the annual mean cycle varied between -12 ppbv and -20 ppbv ( -16 3.8 ppbv) corresponding to surface ozone mixing ratios between 12 ppbv and 23 ppbv whereas in 1993 the deviation laid between -15 ppbv and - 21 ppbv ( 18 + 2.2 ppbv) corresponding to surface ozone mixing ratios between 8 ppbv and 14 ppbv. The duration of ozone depletion events was approximately 1-2 days in both years. A clear correlation between the ozone mixing ratios and the meteorological parameters was not obvious. Nevertheless during the ozone minima a slight decrease of temperature as well as relative humidity values between 65% and 95% were found.
In Fig. 3 the corresponding vertical distribution of ozone mixing ratios within the lower troposphere is presented during Antarctic spring in 1992 and 1993. As it is obvious in Fig. 3, five of the eight tropospheric ozone minima (Table 1) were also partially detected by the time fixed regular ozone sounding programme. Two of them were observed on JD 218 and JD 225 in 1992, and three on JDs 240, 249, and 267 in 1993. In four cases the ozone depleted layers were located well within the planetary boundary layer (PBL) below a subsidence inversion, as seen in the corresponding temperature profiles. Subsidence inversions are characterised by negative lapse rates of the temperature at some height within the troposphere. During the period JD 239-241 in 1993 the ozone depleted air mass was within a strong surface inversion reaching up to 1000 m height. Both the subsidence inversions and the surface inversions, prevented down mixing of ozone rich air from the free troposphere. Generally, a stable stratific ation of the air within the ozone depleted layers, indicated by a positive gradient of the potential temperature (0.2-2.5 K/100 m), could be found. Inside these layers the relative humidity covers a range between 75-90%, with the exception of JD 267 in 1993 with values around 60%.
Backward trajectories, available for JD 240 ( 1993) and JD 267 (1993) as well as weather charts, point towards a transport of ozone poor air masses across the marine and sunlit regions of the South Atlantic Ocean. Sea ice distributions of the southern hemisphere further show that these regions are ice covered at this time of the year, as derived from ice charts of the NOAA Joint Ice Centre.
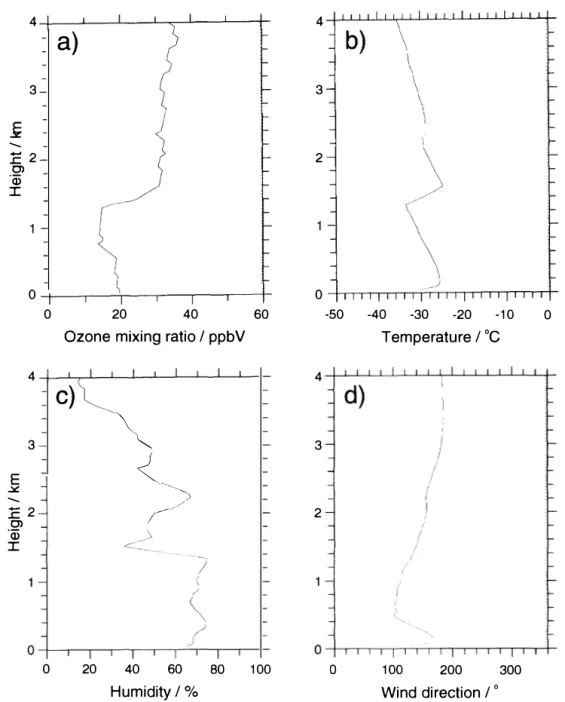
Special features were found during the two strong ozone minima in September 1993 (JDs 249, 267). The corresponding profiles for ozone mixing ratio, temperature, relative humidity, and wind direction are shown in Figs. 4 and 5. During the ozone minima on JDs 249 and 267 the vertical ozone distribution showed an ozone poor layer at elevated altitudes and higher ozone concentrations at the surface. This is particular obviously at JD 267 and less pronounced, however, at JD 249. The ozone depleted layers covered an altitude range between 500-1300 m on JD 249 and between 500-2600 m on JD 267 (Figs. 4a and 5a). Above these ozone poor layers elevated in altitude a strong vertical gradient of increasing ozone mixing ratios again coincides with a pronounced subsidence inversion. Above this subsidence inversion typical ozone mixing ratios of about 30 ppbv were found which are typically for the middle tropo sphere. In these special cases at JD 249 and JD 267 in 1993 also a surface temperature inversion can be observed, which, at JD 267, coincided with the lower boundary of the ozone poor layer (Fig. 5b). On JD 249 the surface temperature inversion was significantly lower than the lower boundary of the ozone depleted layer (Fig. 4b). The
Ozone Depletion Events in the Troposphere a)
Neumayer-Station 1992, 70
°S
4- I I I I I I I I l l I I I I I I I I I l II l I I I 3E
..::.:::-
2 .c: C)·a5
J: 0 b) 4 3E
..::.::: -.c: 2 C)·a5
J: 0 153 183 214 245 275Jun
Jul
Aug
Sep
Oct
Neumayer-Station 1993, 70
°S
I I I 152 182 I II IJun
Jul
l I I I I I I 11111 I I 11 I 11 I I 213Aug
244Sep
274Oct
306 -305 Ozone ppbv
-
100-
90-
-
BO 70-
-
60 50--
40-
--
25 20-
16 12 ··;?\,';:�: 8 Ozone ppbv---
�lffl1� 1()0 90 BO 70 50 40 30 25 20 16 12 8 6 4 2Fig. 3. Vertical distribution of tropospheric ozone mixing ratio (ppbv) up to 4 km altitude as obtained by balloon-borne observations above Neumayer Station (70° S, 08° W); upper panel: June-October 1992; lower panel same
for 1993; arrows mark the ozone depletion events detected by balloon sondes; ozone sondes launches are indicated by black marks above each panel. In 1992 at JD 285 an error in the surface ozone value has to be mentioned.
95
relative humidity inside the ozone depleted layers varied between 60% and 70% (Figs. 4c and 5c). The wind direction shifted from south near the surface within this temperature inversion to east above this inversion at the transition to the ozone depleted layers (Figs. 4d, 5d). From these observations we conclude that cold continental southerly winds lifted the ozone depleted air upward which was transported to the shore
4 4
a)
3 3 �-:E
2 2 C) ·a5 I 0 0 0 20 40 60 -50 -40 -30 -20 -10 0Ozone mixing ratio I ppbV Temperature/ °C
4 4
c)
3 � 3 E{
� ---)-
:E 2 // 2 C) ·a5 I 0 20 40 60 80 100 0 100 200 300Humidity/% Wind direction/ 0
Fig. 4. Vertical profiles as observed by balloon-borne sounding at Neumayer Station (70° S,
08° W) on JD 249 in 1993; (a) ozone mixing ratio (ppbv); (b) temperature (°C);
(c) relative humidity (%); (d) wind direction (° ).
region near the surface by a marine cyclone. This was obvious from weather charts of the southern hemisphere, derived from the Japan Meteorological Agency (JMA). Continental air masses are transported to Neumayer Station by anticyclonic circulation over the continent, corresponding to an outflow from the continental region to the coastal region (KoTTMEIER and FAY, 1997). Thus the air masses approach the station from southeastern to eastern directions. Further the surface wind direction is depen dent on the topography (KoTTMEIER and FAY, 1997). This means the continental air masses, transported to Neumayer Station, follow the local surface topography, resulting
4 3 E .::£
-.E
2 C) ·a5 I 0 0 4 3 E .::£-.E
2 C) ·a5 0Ozone Depletion Events in the Troposphere
a)
I>
"/ 0 20 40 60 -50 -40 -30 -20 -10Ozone mixing ratio/ ppbV Temperature I 0
c
c)
20 I(
'""
)
'\
I 40 60 80 100 4 3 2 0 100 200Humidity/% Wind direction / 0
Fig. 5. Same as Fig. 4 on JD 267 in 1993.
300
97
0
probably in a southerly flow when arriving at the measuring site (Figs. 4b and 5b ). The transport of the air masses can be investigated in more detail by trajectory analysis, available for JD 267. Unfortunately no trajectory calculations were available for JD 249 in 1993. In Fig. 6 the horizontal and vertical displacement of air parcels is shown by backward trajectories which arrive at the Neumayer Station at different pressure levels. Trajectories 1 and 2 had not contact to sea ice surfaces. They are moving downward the continental ice slope towards Neumayer Station from southeast. Both trajectories indicate the transport of air masses with higher ozone mixing ratios near the continental ice surface by continental winds. But trajectory 3 indicates the track of air masses reaching Neumayer Station with lower ozone mixing ratios at the 850 hPa level.
a)
-60°
b)
� 300 ....--�������������������--.
Fig. 6. Five days backward trajectories for Neumayer Station (70° S, 08° W) with
endpoints at ground level (0), 950 hPa (0), 850 hPa ( 6) and 700 hPa (0) at JD 267 in 1993; upper panel: horizontal tracks of air parcels; lower panel: vertical displacements of air parcels.
With respect to trajectories 1 and 2 the crucial difference is that trajectory 3 moved downward from the continental ice and then touched the sea ice between 62° S and
65° S about three days before arriving Neumayer Station from northeastern direction, corresponding to marine air masses, above the cold continental flow near the surface. Air masses which travelled over marine areas at lower latitudes get warmer relative to the continental air masses, which is indicated by a general temperature increase during advection of marine air masses (KoTTMEIER and FAY, 1997), and thus can be pushed up by colder continental air. This event shows that low ozone mixing ratios may appear in air masses which moved directly above sea ice for a certain period of time. Furthermore these complex interactions between continental winds and air mass flow from lower latitudes might explain that not all ozone depletion events can be identified by surface observations in regions where these wind patterns occur.
The observation of tropospheric ozone minima during polar nights was another Antarctic peculiarity at Neumayer on JDs 174-177 and 185-186 in June and July 1992 (Fig. 2a). In both cases no trajectory analysis were available to get more detailed
Ozone Depletion Events in the Troposphere 99 information on air mass transport during these events. However weather charts for these days showed that stationary cyclones controlled the flow of air from lower latitudes towards higher southern latitudes. The southward extension of these cyclone patterns reached 60° S, where sea ice still covers the Southern Ocean in winter. In these
cases air masses processed by sunlight at lower latitudes might be transported into the polar night area towards the Antarctic shore region. So in the southern polar region ozone poor air masses may also appear during polar night at Neumayer Station.
4. Discussion
WYPUTTA ( 1994) presented the annual cycle of surface ozone concentrations at the Neumayer Station based on hourly mean values in the years from 1982 to 1987. This six-years observation period revealed the seasonal occurrence of ozone minima during the month June-October with the ozone mixing ratios of typically around 2-4 ppbv. STURGES et al. (1993) reported on tropospheric ozone minima at McMurdo Station (77°
S, 166°£). They measured surface ozone concentrations as low as lO ppbv by ozone sondes. The same phenomenon was described by MURAYAMA et al. (1992) and AoKI
(1995) for the coastal Syowa Station (69°S, 39°£). In contrast, at stations located in
central Antarctica, like the Amundsen-Scott-Station at the South Pole, low ozone events could never be detected (SCHNELL et al., 1991) . Obviously the appearance of those
tropospheric ozone minima seems to be restricted to coastal regions in Antarctica. The detected ozone minima at Neumayer Station during 1992 and 1993 confirm these observations.
An interesting phenomenon, which could not yet be observed at Arctic stations, was the influence of continental winds at Neumayer Station, probably causing an elevation of the ozone depleted air masses as observed in September 1993. Therefore, surface ozone measurements are not sufficient to investigate the occurrence of tropospheric ozone minima in the Antarctic.
Beside the vertical structure of ozone depleted layers, the horizontal extension can be roughly estimated by using the observed wind speeds and the duration of the ozone mmtmum. In this way, we estimated a horizontal extension of roughly I360 +770 km for the Antarctic. These values are comparable to calculations of HAUSMANN and PLATT ( 1994) . They estimated a horizontal extension of about 500 km for ozone depleted air parcels observed at Alert in the Arctic during the Polar Sunrise Experiment in 1992 (ANLAUF et al. , 1994) .
In both years 1992 and 1993 relative humidity was relatively high inside the ozone depleted layer, except JD 267 in 1993 with values around 60%, which points to a marine origin of the corresponding air mass. The ozone depleted air parcels were transported by marine cyclones, developing above the ice covered Southern Ocean. These observa tions are confirmed by YuRGANOV (1990), who discovered a pronounced ozone mini mum within a cyclone during a ship cruise through the pack ice of the Weddell Sea. However, ozone depletion did not necessarily occur in every marine cyclone (WYPUTTA, 1994, this study, JD 242, 1993) . Trajectories, calculated for JD 242 in 1993, point to the ice free Southern Ocean around 55° S to be the source region of air masses with
YuRGANOV (1990) found ozone depleted air exclusively inside the cold sector of the
cyclone, corresponding to air masses from polar regions, but not inside the warm sector which corresponds to subpolar air. From these observations we conclude that the transport of ozone poor air masses from ice-covered, marine regions of the Southern Ocean plays an important role with respect to the tropospheric ozone minima. Trans port processes seem also to be necessary to explain the observation of ozone depletion events during the polar night at Neumayer Station on JDs 174-177 and 185-186 in 1992. These ozone poor air masses must be transported from sunlit regions at lower latitudes to the measuring station, if one postulates that photochemical reactions are responsible for the ozone destruction. Reasonable simple estimations proved that these ozone poor air masses can be transported over distances of a few thousand kilometres, assuming a weak horizontal exchange between the ozone depleted air parcel and the surrounding air
(WESSEL, 1996) .
5. Conclusion
From our investigations it was obvious that the tropospheric ozone mm1ma, observed during the polar spring in 1992 and 1993 at Neumayer Station, showed the same characteristic features as observed during Arctic tropospheric ozone minima (WESSEL, 1996). They are restricted to the planetary boundary layer with a subsidence inversion at the upper limit, and the ozone poor air masses were generally associated with advection of marine, polar air masses, emanating across ice covered, sunlit regions. Beside these similar characteristic features, two interesting phenomena were obvious: Elevated ozone poor layers were detected for two tropospheric ozone depletion events above Neumayer Station. So far this phenomenon, explained by the influence of continental winds at Neumayer Station, was not reported from other Antarctic coastal stations nor from Arctic stations. The second interesting event has been the appear ance of a surface ozone minimum at Neumayer Station during polar night. It is suggested that these ozone poor air masses were transported from sunlit regions at lower latitudes to the measuring site at higher latitudes, as derived from weather charts. Further measurements are necessary to investigate this phenomenon in more detail.
Acknowledgments
We would like to thank the German Weather Service (DWD) for the calculation of air mass trajectories which were used in this work. For the co-operation and the surface ozone data we would like to express our gratitude to the National Institute of Polar Research (NIPR), Tokyo. We would also thank all station staffs, who have been active for the conduction of these measurements at Neumayer Station.
AWi contribution number: 1216.
References
ANLAUF, K.G., MICKLE, R.E. and TRIVETT, N.B.A. (1994) : Measurement of ozone during Polar Sunrise Experiment 1992. J. Geophys. Res., 99, 25345-25354.
Ozone Depletion Events in the Troposphere 101 AOKI, S . (1995) : A study of tropospheric ozone depletion i n the Antarctic. Report for a Grant-in-Aid for Scientific Research from the Japanese Ministry of Education, Science and Culture, Grant No. 05640482, Tokyo.
ATTMANNSBACHER, W. (1971) : Ein einfaches nasschemisches Geriit mit geringer Triigheit zur Messung des bodennahen Ozons in der Atmosphiire. Meteorol. Rundsch., 24, 183-188.
BARRIE, L.A., BoTTENHEIM, J.W., SCHNELL, R.C., CRUTZEN, P. J. and RASMUSSEN, R.A. (1988) : Ozone destruction and photochemical reactions at polar sunrise in the lower Arctic atmosphere. Nature,
334, 138-141.
BOTTENHEIM, J.W. , GALLANT, A.G. and BRICE, K.A. (1986) : Measurements of NOy species and 03 at 82
latitude. Geophys. Res. Lett., 13, 113-116.
FAN, S. -M. and JACOB, D. J. (1992) : Surface ozone depletion in Arctic spring sustained by bromine reactions on aerosols. Nature, 359, 522-524.
FINLAYSON -PITTS, B. J., LIVINGSTON, F.E. and BERKO, H.N. (1990) : Ozone destruction and bromine photo
chemistry at ground level in the Arctic spring. Nature, 343, 622-625.
HAUSMANN, M. and PLATT, U. (1994) : Spectroscopic measurement of bromine oxide and ozone in the high
Arctic during Polar Sunrise Experiment 1992. J. Geophys. Res., 99, 25399-25415.
KoMHYR, W.D. (1986) : Operations-Handbook: Ozone measurements to 40 km altitude with model 4A electrochemical concentration cell (ECC) ozonesondes. NOAA Technical Memorandum, ERL ARL-149, Nat. Oceanic and Atmos. Admin., Washington, D.C.
KONIG-LANGLO, G. and HERBER, A. (1996) : The meteorological data of Neumayer Station (Antarctica) for 1992, 1993, and 1994. Ber. Polarforsch. (Rep. Polar Res.), 187, 101 p.
KOTTMEIER, Ch. and FAY, B. (1997) : Trajectories in the Antarctic lower troposphere. accepted for Special Section of J. Geophys. Res.
LEBRAS, G. and PLATT, U. ( 1995) : A possible mechanism for combined chlorine and bromine catalysed destruction of tropospheric ozone in the Arctic. Geophys. Res. Lett., 22, 599-602.
MURAYAMA,
s.,
NAKAZAWA, T., TANAKA, M., AOKI,s.
and KAWAGUCHI,s.
(1992) : Variations oftropospheric ozone concentration over Syowa Station, Antarctica. Tellus, 44B, 262-272.
OLTMANS, S. J., KOMHYR, W.D., FRANCHOIS, P.R. and MATTHEWS, W.A. (1989) : Tropospheric ozone: Variations from surface and ECC ozonesonde observations. Ozone in the Atmosphere, Proceedings of the Quadrennial Ozone Symposium 1988 and Tropospheric Ozone Workshop, ed. by R.D. BoJKOV and P. FABIAN. Hampton, A Deepak Publishing.
SCHNELL, R.C., Liu, S.C., OLTMANS, S. J., STONE, R.S., HOFMAN, D. J. et al. (1991) : Decrease of summer tropospheric ozone concentrations in Antarctica. Nature, 351, 726-729.
SOLBERG, S., SCHMIDTBAUER, N ., SEMB, A. and STORDAL, F. ( 1996) : Boundary-layer ozone depletion as seen in the Norwegian Arctic in spring. J. Atmos. Chem., 23, 301-332.
STURGES, W.T., SULLIVAN, C.W., SCHNELL, R.C., HEIDT, L.E. and POLLOCK, W.H. (1993) : Bromoalkan production by Antarctic ice algae. Tellus, 45B, 120-126.
WESSEL, S. ( 1996) : Troposphiirische Ozonvariationen in Polarregionen. Dissertation der Natur wissenschaftlichen Fakultiit der Universitiit Bremen, Germany.
WESSEL,
s.,
AOKI, S., WELLER, R., HERBER, A., GERNANDT, H. and ScHREMS, 0. (1997) : Aerosol and ozoneobservations in the polar troposphere at Spitzbergen in spring 1994. Atmos. Res., 44, 175-189. WESSEL, S., AOKI, S., WINKLER, P., WELLER, R., HERBER, A., GERNANDT, H. and SCHREMS, 0. (1998) :
Tropospheric ozone depletion in polar regions --A comparison of Arctic and Antarctic observations. Tellus, SOB, 34-50.
WYPUTTA, U. (1994) : Untersuchungen zum Spurenstofftransport in die Antarktis anhand von Messungen an der Georg-van-Neumayer Station. Berichte aus dem Zentrum fiir Meeres- und Klimaforschung Reihe A, No. 15.
V AISALA (1991) : Ozonesonde User's Guide. Vaisala GmbH, Hamburg.
YURGANOV, L.N. ( 1990) : Surface layer ozone above the Weddell Sea during the Antarctic spring. Antarct. Sci., 2, 169-174.