The EEffects of High
Lifetim
CE
her Edu
me Inco
Lorra
Emla
Aliss
Gr
Jan
EE DP 7
ucation
omes o
aine Dea
a Fitzsim
sa Good
reg Kapl
nuary 20
78
n Fundi
of Grad
arden
mons
dman
lan
008
ng Refo
duates
orms o
ISSN 2045on the
5-6557Published by
Centre for the Economics of Education London School of Economics
Houghton Street London WC2A 2AE
© Lorraine Dearden, Emla Fitzsimons, Alissa Goodman and Greg Kaplan, submitted October 2006
Published January 2008 ISBN 7530 20890
The Centre for the Economics of Education is an independent research centre funded by the Department for Children, Schools and Families. The views expressed in this work are those of the author and do not reflect the views of the DCSF. All errors and omissions remain the authors.
Executive Summary
This paper makes use of new simulations of lifetime earnings profiles to highlight how graduate lifetime earnings differ from non-graduates’, and to set out what the effects of the new system of HE funding in England introduced in 2006, and a number of variants, would be on the lifetime incomes of different graduates.
Until recently, estimates of the full distribution of lifetime earnings for graduates and non-graduates in the UK have not been available. In this paper we use simulations based on a methodology exploiting the copula decomposition of a joint probability distribution function. These represent, to the best of our knowledge, the first estimates of the full distribution of lifetime earnings paths for the UK.
The copula approach allows us to model the dependence in wages between ages, whilst we also allow for a stochastic component to employment, by including entries and exits from the labour market in our simulations. Our earnings simulations are based on data from the UK Labour Force Survey (LFS) covering the period spanning 1997 through 2002, whilst the simulated employment paths and re-entry earnings ranks are based on mobility patterns observed in the British Household Panel Survey (BHPS).
Before taking into account likely economy-wide future productivity growth, we find that the average difference between graduate and non-graduate lifetime earnings is similar to the £400,000 estimated by the DfES. However once such future productivity growth is included in our earnings simulations, our estimates of the average difference in lifetime earnings between graduates and non-graduates is somewhat higher than this, in the region of £600,000.
Our simulations are particularly informative for assessing the degree of dispersion in graduate and non-graduate lifetime earnings. For males, lifetime earnings are considerably more dispersed for non-graduates than for non-graduates, suggesting that although graduate wages are higher, so is the degree of uncertainty and/or unobserved heterogeneity in lifetime earnings. For females, the opposite is the case, suggesting that graduate women experience both higher wages, and less uncertainty or unobserved heterogeneity, compared to non-graduates.
Compared to the cross-sectional distribution of wages, there is considerably less dispersion in lifetime earnings, due mainly to mobility in individual earnings positions across the lifecycle. For example, the Gini coefficient for male graduates within the cross-section is 0.274 and within our earnings profiles is 0.217.
Our analysis of the distributional impacts of the new HE funding system in England is original because it allows us to consider the effects of the loans and subsidies on the full distribution of graduates, according to their lifetime earnings, rather than relying on ‘typical’ or ‘example’ graduates.
We find that for a given level of debt on graduation, the system favours lower lifetime-earning graduates over higher earners, since the net present value of the graduate repayments is in general higher, the higher the lifetime income of the graduate. By the same token, the value of the government subsidy is strongly decreasing in income, ranging from around 80% of the face value of the loan for the lowest lifetime-earning women, to less than a quarter for the highest earning women (with the average across all women at around 40%). For men the range of taxpayer subsidy is narrower, at around 43% for the lowest earning men, and 20% for the highest earners (with the average subsidy at around 27%). The number of years taken to repay is also decreasing in lifetime earnings – ranging from 25 years for the lowest earners (at which point all outstanding debt will be paid off), to between 10 to 15 years for the highest earners. For women the average time for repayment will be around 20 years, whilst for men it will be 15.5 years. Around 36% of women can expect to have some debt written off, with their repayment capped at the 25 year cut-off, whilst this is the case only for around 7% of graduate men.
Compared to the old system being replaced, we find that a very considerable number of graduates, especially lower earners, and those from low parental income backgrounds, will be better off under the post-reform HE funding scheme, despite the increase in tuition fees, and the likelihood therefore of graduating with higher government-supported debts. This is because of a number of factors, including more favourable loan repayment terms (the increase in the repayment threshold, and the introduction of debt write off after 25 years), and because the need to take out more expensive commercial loans while at university will be reduced, due to the introduction of new grants, bursaries and fee loan.
Finally we have considered the effect on graduate incomes of a number of possible future reforms. The hypothetical scenarios that we have considered involved the imposition of a real interest rate of 2.5% on loans, with different assumptions about the treatment of accumulated interest above the level of repayment due in any given year. The implied savings from this reform for the exchequer, and costs to the graduate, would be concentrated amongst the richest 50% of women, and the richest 90% of men: the remainder of graduates would tend to be protected from the costs of these reforms. By contrast measures such as freezing the loan repayment threshold in nominal terms, or allowing discounts for early repayment would tend to cost low-earning graduates the most. We have also highlighted the implications of raising the existing fee cap above £3,000, with the cost of higher tuition increasingly expensive to the taxpayer as fees are raised.
Higher Education Funding Reforms in England: The
Distributional Effects and the Shifting
Balance of Costs
Lorraine Dearden
Emla Fitzsimons
Alissa Goodman
Greg Kaplan
1. Introduction 1 2. The 2004 Reforms 33. Distributive Effects of the Reforms by Parental Income 4
4. Distributional Effects of the Reforms by Graduate Lifetime Earnings 5
Lifetime earnings simulations 6
The effects of different HE funding systems on graduates 9
Distributional effects of the new system 11
How does the new system compare to the old system? 12
Possible reforms to the new system 15
5. The Shifting Balance of Funding 18
6. Conclusions 20
References 22
Tables 26
Figures 29
Acknowledgments
Lorraine Dearden is Director of the Centre for Early Years and Education Research at the Institute for Fiscal Studies, Professor of Economics and Social Statistics at the Institute of Education, and a Deputy Director of the Centre for the Economics of Education. Emla Fitzsimons is a Senior Research Economist at the Institute for Fiscal Studies and a CEE Associate. Alissa Goodman is Deputy Director of the Institute for Fiscal Studies and a CEE Associate. Greg Kaplan is a PhD Student and Research Assistant at the Department of Economics, New York University, and a Research Associate at the Institute for Fiscal Studies.
The authors are extremely grateful to the funders of this work, who include the Nuffield Foundation (Grant number OPD/00294/G), the ESRC, through the Centre for the Microeconomic Analysis of Public Policy at IFS (Grant number M535255111) and the Department for Education and Skills (DfES) through the Centre for the Economics of Education (CEE). They acknowledge useful comments from participants at the 2nd Mass Higher Education in UK and International Contexts Seminar in February 2007; the 2006 Royal Economic Society Annual Conference; the Department for Education and Skills CEE conference in June 2007; the Geary Behavioural Seminar series at University College Dublin; the Nuffield Foundation Education Seminar on 24 May 2006; the 2006 Arne Ryde Symposium on Higher Education Finance at Lund University Sweden; and the Poverty and Applied Microeconomics seminar at the World Bank, May 2005.
1. Introduction
The Higher Education Act of 2004 introduced a set of substantial reforms to the system of higher education (HE) finance in England. These reforms, which included an increase in fees, income-contingent loans (ICLs), and means-tested grants and bursaries, were preceded by lengthy discussions on the relative merits of alternative
funding systems.1 Among the desired elements of the reforms that emerged from this
debate were (i) that a greater share of the costs of HE be borne by graduates, the main beneficiaries of HE (ii) that the system include an insurance element to protect graduates against low realised returns from HE, and (iii) that universities see increased funding per head. Further refinements to these reforms were announced in
July 2007.2 The 2004 reforms came fully into operation in September 2006 and the
latest refinements will apply to students starting from September 2008.
This paper assesses the extent to which the new reforms are likely to realise the above aims. We start off with an analysis of the distributional effects of the reforms by student parental income. This reveals that the poorest students gain the most from the reforms, due to generous maintenance grants and subsidies outweighing the total costs of entering university, and that students from relatively well off backgrounds will typically face higher net costs of HE. As the amount that graduates pay for HE will depend on the amount and timing of their lifetime earnings, we then consider the distributional effects of the reforms by graduate lifetime earnings. This analysis makes use of a new set of simulated earnings profiles, developed in Dearden et al. (2006), that account for earnings mobility and spells out of work, explicitly capturing the notion that some graduates will experience better labour market outcomes than others. We find that relative to the system that was replaced, graduates with the lowest lifetime earnings can expect to see a reduction in the cost of HE, while higher earning graduates will contribute more to the cost of their HE. In this way, we find that the HE reforms do in fact include a substantial insurance component. We conclude by taking a look at how the reforms affect university funding and how they shift the
1 For an overview of the key elements in this debate see Barr and Crawford (2005) and Chapman
(2005).
2
See John Denham’s statement to the House of Commons on 5 July 2007, http://www.dti.gov.uk/science/page40318.html.
balance of funding for HE between the public sector and the private sector. We find that universities gain financially from the reforms, both through additional taxpayer funding and contributions from graduates.
Our paper contributes to the existing literature in a number of ways. First, it analyses quantitatively a HE funding policy that is complex and multi-faceted. There are a number of existing studies on the empirical effects of HE policies, contained for example in Keane and Wolpin (1997), Heckman, Lochner and Taber (1998), Lee (2001), and Gallipoli, Meghir and Violante (2006). However, the overriding contribution of these papers is in analysing HE policies within partial or general equilibrium frameworks, and in so doing they consider straightforward HE interventions, such as tuition subsidies. Whilst we do not use a structural framework, we add to this (largely US literature) by considering the quantitative effects of a relatively more complex set of HE reforms.
Second, our paper adds important empirical evidence to the literature that emphasises the potentially valuable role of education policies with insurance elements, such as income-contingent loans. The concept of an ICL as a means to fund human capital investment dates back to Friedman (1955). Since then, numerous works such as Nerlove (1975), Barr (1993), Greenaway and Haynes (2003), and Chapman (2005) have discussed their potential usefulness as a source of funding for HE. Our work adds empirical evidence on the likely distributional effects of such policies to this literature. Moreover, there is a large literature on the background to the new HE reforms in England, a comprehensive summary of which is contained in Barr and Crawford (2005). However, this paper is the first to provide an in-depth analysis after the reforms have been implemented, of how they may affect different graduates differently and of their implications for the public finances.
Third, at the heart of the reforms is the provision of built-in insurance against an inability to repay loans, thus giving central importance to the role of uncertainty in returns to human capital investments. Moreover, in analysing the distributional effects of the new reforms for graduates, we implicitly acknowledge the key role of heterogeneity in returns to higher education. This initially gained prominence through important works such as Levhari and Weiss (1974), Eaton and Rosen (1980) and
Kodde (1986). There is more recent work on the design of an optimal education finance system in the presence of uncertainty over the benefits of education, such as by De Fraja (2002), Benabou (2002) and Fernandez and Rogerson (1995), though the exact link between theoretically optimal systems and ICLs in practice is an area of open research. Our work adds empirical evidence to this largely theoretical debate. The paper proceeds as follows. Section 2 briefly describes the HE reforms. In section 3 we consider how lifetime payments of HE depend on parental income, and set out the distributional implications of the reforms along this dimension. Section 4 assesses the distributional effects of the reforms on graduates according to graduate lifetime earnings, and sets out the likely distributional consequences of a number of potential future reforms, including increasing the fee cap and reducing loan subsidies. Section 5 shows how the new system of HE funding alters the balance of funding between graduates, students, universities, and taxpayers. Section 6 concludes.
2. The 2004 Reforms
The recent reforms to the funding of HE in England originated with the Department for Education and Skills’ White Paper published in January 2003, which set out plans for increasing fees for higher education, together with full fee deferral and the re-introduction of means-tested grants for student support. The full reforms, somewhat altered since the publication of the White Paper, came into effect in England in 2006. Further changes to the system were announced in 2007, mainly affecting upfront
support for students, which will affect students starting university from 2008-09.3 In
this paper we analyse this most up-to-date HE funding system (for ease of notation we refer to it as the “new system”). One of the key motivations for the reforms was to reverse the long-term decline in funding per head for university teaching seen in England over a number of decades, by increasing graduate contributions.
3
See John Denham’s statement to the House of Commons on 5 July 2007, http://www.dti.gov.uk/science/page40318.html.
Compared to the system it replaced (referred to for convenience as the “old system”), maximum fees are higher – with fees variable, up to a £3,000 cap, which will remain
in place at least until 2010.4 In addition, there are no longer any exemptions for fees
based on family income (see Table 1). Instead of being payable up front, all fees are now deferrable until after graduation, with loans available at a zero real interest rate, repayable according to income (at 9% above a threshold of £15,000). New grants are available for many students (up to £2,700 for the poorest students, tapered to zero at parental income of £60,000) and bursaries are now received by the poorest students (at least £300 for the full fee). Further details are set out in Dearden et al (2005, 2007).
3. Distributional Effects of the Reforms: by Parental Income
Much concern has been expressed about the equity, or distributional consequences of the new fee regime. In this section we consider the distributional consequences in one particular dimension, namely how individuals are affected according to their parents’ income. By looking at how payments balance out across the lifetime, we show that relatively less well off students are more than compensated for the increases in fees by large additions to up-front support in the form of maintenance grants and subsidies. For students from richer backgrounds, the total additional costs of entering university under the new regime outweigh the total additional payments made to them through
the student support system.5
The net financial improvement per year to a student from switching from the old system (the system in place in 2003-04) to entering under the new system (the system
4 The system against which changes are measured, is the system in place in 2003-04, which was the
final year before any of the new reforms, first set out in the 2003 White Paper, had begun to be implemented. Note also that all figures throughout the paper are expressed in 2006 prices.
5Note however that this needs to be balanced against the fact that the removal of up-front tuition fees
might remove some immediate liquidity constraints of students. Moreover, changes in quality might arise from the increased funding for universities. However, we do not consider the potential improvement in education quality arising from the introduction of top-up fees as an additional benefit that students take into account when making their education decisions. If the reforms lead to an increase in funding per head however then this should, all other things being equal, increase both quality and thereby demand (i.e. improve the incentive to attend).
in place from 2008-09) is illustrated in Figure 1. The calculations underlying this
figure assume that a student takes out the maximum student loans6, receives the
average loan subsidy through the course of their working life7, and incurs the
maximum fee. To provide a better idea of how the figures were derived, Table 2 shows the underlying calculations for a student on family incomes of <£22,500, £25,000, £45,000 and >£60,000 respectively.
Clearly the effects vary considerably across the parental income distribution. Despite the higher fees and the loss of fee remissions, students with family incomes below around £46,000 should be better off under the new system. This is because they gain in grants, bursaries, and loan subsidies by more than the additional fees they will be required to pay. As we will show when we look at the distributional consequences of the system of loan repayments, this advantage under the new system would be higher if they go on to be low earners later in life. It can also be seen from Figure 1 that for those with family income above £46,000 per year, the additional costs to entering HE outweighs any additional benefits in the form of direct financial support from the state.
4. Distributional Effects of the Reforms: by Graduate Lifetime Earnings
In this section, we consider how the new reforms affect different individuals, depending on where they end up in the lifetime earnings distribution as graduates. We also consider the likely effects of some variants of the new system. For this analysis, we use new lifetime earnings simulations of graduates, set out in Dearden et al (2006), and summarised in the Appendix, to estimate the repayment profiles of different graduates for any given level of debt, as well as the likely per-student cost to the taxpayer of fee deferral. These simulations provide us with estimates of the future distribution of graduate earnings, on the assumption that the present observed
6Given the zero real interest rate it makes sense for all students to borrow the maximum available to
them.
7 Based on DfES projections, the average maintenance loan subsidy will be 21%, and the average fee
loan subsidy will be 33%. Source: Hansard, 10 November 2005, Education Finance, http://www.publications.parliament.uk/pa/ld200506/ldhansrd/vo051110/text/51110-25.htm. If lifetime earnings are lower than the level that attracts the average loan subsidy, then the subsidy will be higher.
structure of earnings dynamics amongst graduates continues into the future, and that in addition to any simulated change in earnings due to age or experience, earnings increase by 2% in real terms each year due to underlying future productivity growth in
the economy.8 The simulations represent one of the only published empirical
characterisations of the distribution of lifetime earnings for graduates in the UK. The only other work that we are aware of that attempted a similar exercise for the UK is that of Barr et. al. (1995), who developed a dynamic cohort microsimulation model based on one year of cross-sectional earnings data, to investigate the potential effects of different ICL schemes. In contrast to their work, we use panel data to account for dependence in earnings across time and movements into and out of the work force. This allows us to characterise more realistically the distribution of earnings.
Lifetime earnings simulations
This section provides a very brief summary of our methods for simulating lifetime earnings (a more detailed description is contained in the Appendix). The lifetime earnings distributions are constructed using functions known as copulas, the name
being a reference to the fact that they ‘couple together’ k univariate distributions to
form a k-variate distribution. In our case, the construction of k-variate distributions is
simplified by assuming that wages follow a first-order Markov process, meaning that only the most recent draw of wages affects the distribution of the next draw. This allows us to model the dynamics of earnings over the lifecycle from just two wage
observations for the same individual.9 In practice, the way in which this is done is
that within cells defined on the basis of age, gender and whether or not the individual
is a graduate10, each individuals’ two observed wage levels are converted to ranks or
8 This is in accordance with HM Treasury, who use this as the rate of long-term earnings growth.
Please note that our previous simulations in working versions of this paper, and others, did not allow for this economy wide real earnings growth, making our simulations of the effects of policy rather different: in particular by simulating lower absolute levels of earnings going forward, we in general projected a greater cost to the taxpayer in loan subsidies, and a lower cost to the individual; the length of time we simulated that it would take graduates to repay their loans was also generally considerably longer than with our current earnings simulations.
9 A relaxation of first-order Markov to second-order Markov would come at a considerable technical
cost and would not enable us to use the LFS data which only has a maximum of two earnings observations per individual.
10 A graduate is defined as an individual holding a Higher Education qualification. This includes
qualifications that constitute Levels 4 and 5 under the Qualifications and Curriculum Authority’s original National Qualifications Framework: doctorates, masters degrees, postgraduate certificates and
relative positions, and the parameters of the copula function that best capture the dynamics of these ranks between the two periods are estimated using Maximum Likelihood methods. This leads to a sequence of bivariate distributions across ages
spanning the working lifecycle for each gender/education group.11 These are then
pieced together to form the group-specific overall lifetime earnings distributions. Finally, we simulate a series of ranks from these joint probability distributions and map on the observed wage levels corresponding to these ranks to form earnings paths. One appealing feature of this approach is that the copula function allows us to model the dependence in wages between ages, thus characterising the observed dynamics in
earnings (up to the first-order Markov assumption).12 But another important feature of
the earnings paths is that in simulating them, we allow for a stochastic component to employment and assign earnings accordingly. In particular, if an individual is unemployed in a particular period, (s)he is assigned zero earnings; if (s)he becomes employed, his/her earnings are allowed to depend on the length of time unemployed, and his/her wage when last employed. Not only does this generate realistic mobility patterns in earnings and employments, but the cross-sectional distributions of simulated earnings at each age, match those in the data.
Earnings simulations are based on data from the UK Labour Force Survey (LFS)
covering the period spanning 1993 through 2003.13 The LFS is a representative
household survey made up of a five quarter rotating panel. Prior to 1997, data on earnings were collected in the fifth quarter, and from 1997 onwards, data on earnings were also collected in the first quarter. To estimate the dependence in earnings for graduates, we restrict the sample to graduates aged 19 through 60 who are full- or part-time employees or in government employment or training programmes, and for
diplomas, bachelors degrees, graduate certificates and diplomas, diplomas of higher education and further education, foundation degrees, higher national diplomas.
11 We model the evolution of wages from ages 22(19) through 60 for graduates (non-graduates). 12 Note that the benefits from allowing for earnings mobility in this way accrue from examining the
entire distribution of lifetime earnings paths. If we were to focus on the effects of the policy on an example “average” graduate then it would not be necessary to model the extent of intertemporal dependence in earnings.
13 In Dearden et al (2006), we have used the British Household Panel Survey (BHPS) to estimate the
earnings models. This is because the analysis carried out in that paper relies on a panel of longer than two years, so the relatively large sample sizes afforded by the LFS were traded off against this (approximately 60,000 households are interviewed each quarter in the LFS, compared to around 5,500 households recruited in wave 1 of the BHPS). It is worth noting however that our simulations of the lifetime earnings distributions from both data sources are very similar.
whom we observe two positive earnings observations, which leaves us with a sample
of just under 35,000 graduates.14 Note that the earnings simulations are drawn from
all available years of LFS data, and for these we use graduates for whom we observe at least one earnings observation, which leaves us with a total of just over 135,000 earnings observations. The simulated employment paths and re-entry earnings ranks are based on mobility patterns observed in the British Household Panel Survey (BHPS) between 1991 and 2004, inclusive.
Figure 2 provides a picture of the simulated lifetime earnings distribution for graduate
men and women.15 The median values for lifetime earnings (between ages 22 to 60)
for men is simulated to be £2 million between the ages of 22 to 60, while for women the median simulated lifetime earnings is around £1.3 million. One important feature of these distributions to note is that they are much less skewed compared to more commonly observed cross-sectional distributions of wages. This is because taking into account mobility in individual earnings ranks over time reduces the level of inequality considerably.
Figure 3 shows the simulated median annual earnings at each age for male and female graduates. It shows that median annual earnings are simulated to rise from around £12,000 for men and women at age 22 to a peak of around £73,000 (£47,000) for men (women) at age 56 (55). It must be remembered that these simulated earnings values are considerably higher than the median values observed in today’s distribution of graduates (where the median male graduate annual earnings across the 22-60 population is around £30,000 and the median female graduate earnings is around
£21,00016). This is because we are simulating future earnings for a graduate cohort
starting undergraduate university in 2008-09, building in 2% real earnings growth each year, over 40 years, in addition to any increment to earnings due to age or experience.
14 This means that we drop employees who did not provide data on earnings in both quarters, whether
due to attrition from the survey (around 40% of our sample of graduate employees leave the sample between waves 1 and 5) or refusal to answer earnings-related questions (in general this ranges between 10 and 20 per cent). Note that we nonetheless retain large samples to estimate dependence in earnings. It is difficult to know the extent of the biases, if any, induced by sample selection, and a full analysis of this is beyond the scope of this paper.
15 In this figure, lifetime earnings are simply added across ages 22-60, without any discounting. 16 Source: Spring 2005 Quarterly Labour Force Survey.
It is worth emphasising that our earnings simulations are not predictions of the future, they are instead simulations based on a series of assumptions. Predicting the earnings of future graduates poses more severe challenges, in particular because the distribution of earnings of future graduates is likely to itself be affected by the reforms. This is for a number of reasons. First, the reforms may affect the decision to participate in HE, which may alter the composition of students/graduates and thus earnings. Second, the reforms may affect choices at university, such as courses studied and the length of time spent at university, both of which may affect lifetime earnings. Finally, the reforms may have general equilibrium effects, for example through affecting the supply of graduates, which may alter the relative wages of future graduates.
With this in mind, our analysis of the effects of HE funding policies on incomes do not represent forecasts or predictions of what we think the effects will be. Rather, they are an estimate of what the effects would be given our simulations of the distribution of lifetime earnings of graduates. They thus serve to highlight the varying distributional impacts of different HE funding policies.
The effects of different HE funding systems on graduates
Before we are in a position to make this sort of assessment for the new funding system, we need to consider how much students are likely to borrow under the new system. Although in practice there is likely to be less than 100% take-up of loans, in fact it makes economic sense for all students to borrow the maximum fee and maintenance loans available to them. This statement holds regardless of what other sources of income are available, and is due to the large subsidy inherent in the zero real interest rate, and the possibility of debt write-off. For this reason we base our simulations on the full take-up of loans.
This implies that students taking courses that charge the maximum fee of £3,000 per year will graduate with between £18,340 and £21,560 of debt for a 3 year course (£9,000 of this for fees, and the remainder for maintenance), varying by parental
income due to slight variations in maintenance loan entitlements. This compares with £12,350 maximum subsidised loans - all for maintenance - under the system that has been replaced. Some example maximum government debt levels under the old and
new systems are shown in Table 3 at four different parental income levels.17
Table 3 also shows “External funding”, which is that amount of non-government funding that students under the 2003-04 system would need in order to attain the same standard as living whilst in university as under the new system, whether by borrowing or other means. The higher availability of resources that can be put towards living expenses at university under the new system is mainly due to the removal of the
requirement to pay upfront fees and/or the introduction of grants.18
For all of the subsequent examples we assume an initial debt level of £18,340, representing the maximum amount of government loans available to those with family incomes below around £35,000. As the variation in maximum debt across parental incomes is relatively low compared to the size of the overall debt, repeating the forthcoming analysis over different maximum debt levels, would not change inferences much.
Note that to calculate net present values of debt repayments and the value of taxpayer subsidies, we assume a real discount rate of 2.2% per year (this follows the
government’s present convention for discounting, see DfES, 2007).19
We also assume that no graduates avail of the option to take a five-year holiday from loan repayments (announced in July 2007). Although it would be in the financial interest of all graduates to take this option (assuming the zero real interest rate on
17 There are currently no reliable data on what percentages of students fall into different income
categories. Based on its 2006-07 data on grant take-up from the Student Loan Company (SLC) we can obtain some indication however. Around 23% of HE students receive the full grant (parental income below £17,500), 17.5% of HE students receive a partial grant (parental income below £33,500), and the remainder receive no grant. However, a caveat is that around 20% of students do not apply to the SLC.
18External funding is calculated as the difference between the upfront support for living expenses under
the new and old systems. Under the old system, upfront support is equal to maintenance loans minus upfront fees. Under the new system, it is the sum of maintenance loans, grants and bursaries.
19 Note that our previous simulations in working versions of this paper, and others, used a 2.5%
discount rate. By using a that higher discount rate, we in general projected a greater cost to the taxpayer in loan subsidies, and a lower cost to the individual than we do here; the length of time we simulated that it would take graduates to repay their loans was also generally longer than with our current earnings simulations.
loans is maintained), it is difficult to predict when graduates would choose to take this holiday, and just how extensive it will be when it comes into force. However, it should be noted that we estimate that a graduate who takes it in the first five years of being eligible for repayments stands to gain an additional £850 in subsidies from the government, regardless of their position in the lifetime earnings distribution. Further details are available from the authors on request.
Distributional effects of the new system
The first exercise we perform using our estimated graduate lifetime earnings profiles is to assess the net present value of debt repayments that graduates will be expected to make (i.e. net of any subsidies they gain from the zero real interest rate and debt write-off), the number of years that graduates can be expected to repay their loans, and the taxpayer subsidy (expressed as a proportion of the original loan) that they can expect to receive under the new system. In all cases, we show how these outcomes vary across the distribution of graduate lifetime earnings.
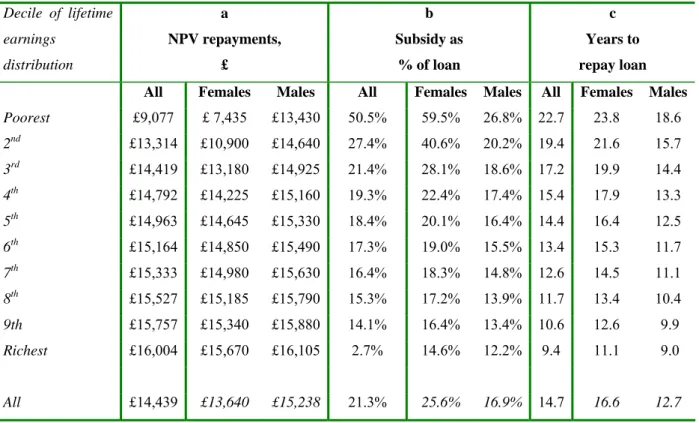
Figures 4a though 4c, and Table4 show the combined distributional effect of the
interest subsidy and the debt write-off provision. Each panel shows the whole
population of graduates, though this masks substantial heterogeneity across males and females, which are also shown. For a given level of debt on graduation, lower
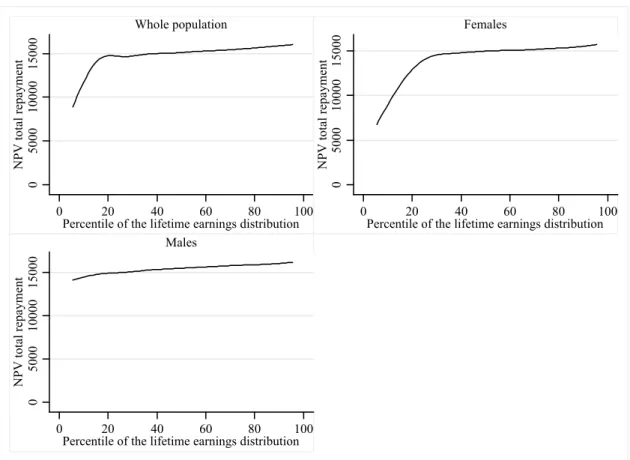
lifetime-earning graduates will eventually repay less of their debt, whilst higher earners will repay more (Figure 4a and Table 4, column a). This is not a surprising feature of the income-contingent loan system, given its design, but this to our knowledge represents the first empirical estimation of such distributional effects. By the same token, the value of the government subsidy (expressed as a proportion of the face value of the loan in Figure 4b and Table 4, column b) is strongly decreasing in income, ranging from around 60% for the lowest lifetime-earning women, to around 15% for the highest earning women (with the average across all women at around 25%). For men the range of taxpayer subsidy is narrower, at around 27% for the lowest earning men, and 12% for the highest earners (with the average subsidy at around 17%).
The number of years taken to repay (Figure 4c and Table 4, column c) is also decreasing in lifetime earnings – ranging from 25 years for the lowest earners (at which point all outstanding debt will be written off), to between 10 to 15 years for the
highest earners. For women the average time for repayment is around 17 years, whilst for men it is around 13 years. Around 21% of women can expect to have some debt written off, with their repayment capped at the 25 year cut-off, whilst this is the case only for around 2% of graduate men. These results all highlight the fact that the longer the loan is held by a graduate, the bigger is the taxpayer contribution to the repayment of that loan. This of course runs counter to a commonly held notion that holding graduate debt for a long time is an indication of the “heavy burden” of that debt.
Taken together, the analysis in Figures 4a-4c, illustrates the potential benefits of the new system in terms of the insurance it provides against low realised returns to investments in HE. This is seen most clearly though the dependence of the level of
government subsidy on realised labour earnings later in life. Our results thus provide
empirical support for the use of income-contingent loans as a mechanism for providing insurance in the face of uncertain and heterogeneous returns to human capital investments.
How does the new system compare to the old system?
An interesting question our simulations can address is how these patterns of graduate repayments and taxpayer subsidies compare to the previous HE funding system. In so doing, it highlights the distributional effects of various key aspects of the reforms. There are three important differences between the two systems that we will consider here. First, the new system has more generous loan subsidies. Second, it has higher levels of government debt on graduation. Third, the new system allows students to obtain a better standard of living at university, due to the availability of grants and/or the removal of upfront fees, which reduces student reliance on external sources of funding such as bank loans. In this section we will analyse each of these three aspects. Note however, that in making comparisons across the two HE funding systems it is
important to emphasise that our analysis here is partial: it focuses on the impact on
graduates of the debt repayment element of these systems, but ignores how much graduates as taxpayers would have been expected to pay, in tax, to raise the required government revenue to finance these systems. We will return to this in Section 5.
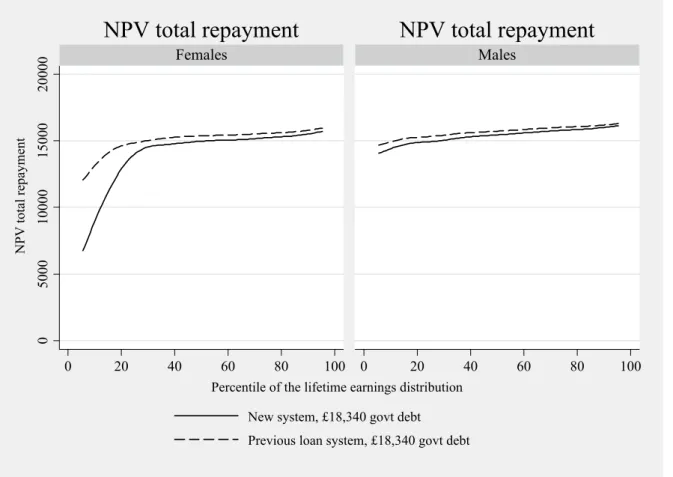
Figure 5 through Figure 7 set out the differences between the old and new systems along the above three dimensions. Each figure presents the distributional pattern of graduate debt repayments under the new system as compared to the system being replaced. Due to the substantial differences across males and females that are masked by considering the whole graduate population together, as seen in the previous section, from hereon we show all analyses separately by gender.
First we show the effects of the two new changes to the loan repayment conditions - the provision for debt write-off after 25 years and the raising of the repayment threshold to £15,000. By comparing the two systems for a given level of debt (here fixed at the new system’s maximum level of £18,340), Figure 5 shows that this combination of reforms is progressive across the distribution of graduate earnings – it reduces the amount that all graduates will have to repay, but reduces the amount for the lowest earning graduates the most. The biggest gains clearly arise for approximately the poorest fifth of women, who repay an average of around £3,600 less under the new system. These are the women who as we illustrated earlier, gain from debt write-off after 25 years.
Next we present the pattern of graduate repayments under the new system compared to the old system, taking into account that the level of debt on graduation will be considerably higher under the new system compared to the old system, due to the requirement to pay higher fees. As we set out in Table 3, the maximum total maintenance loan after 3 years under the old system amounted to £12,350, compared to the counterpart for these individuals under the new system of £18,340, for maintenance and fees. Of course these extra payments are offset to varying degrees by the reforms to the loan repayment system that we highlighted above. In Figure 6 we show the net effects of the increased government borrowing, but under more favorable terms. The Figure shows that whilst most individuals will be required to pay considerably more in debt repayments after graduation under the new system compared to the old system, approximately the poorest tenth of women will actually make smaller total debt repayments under the new system (saving up to around £2,700 in total) despite graduating with considerably more debt: as we have already seen this is largely due to the provision for debt write-off after 25 years.
Finally, we take into account the fact that under the new system, the requirement to take out private debt is likely to be reduced, because of the new up-front support in the form of grants and bursaries, and the removal of the requirement to pay any fees up-front. As we discussed above, the effects of these changes to up-front grant entitlements and fee liabilities differs quite markedly according to parental background. Here we show the effects for individuals at the lower and upper ends of the parental income distribution: first the reduction in private debt required under the new system amounts to £5,990 over 3 years for those at the lower end, mainly due to the new grants and bursaries; second, the reduction in the need for private debt amounts to around £4,925 over 3 years for those at the top end, mainly from the replacement of up-front fees with fees that are fully deferrable. In order to estimate the costs of such private debt, we assume fixed payments over 10 years at a 4% real
rate of interest.20 As shown in Figure 7, once the effects of the removal of up-front
fees and the addition of grants and bursaries are taken into account, for all students from poor backgrounds, the total payments required on graduation will actually be
lower under the new system than under the old system. The opposite is the case for
students from richer backgrounds, the majority of whom would repay more under the
new system, with the exception of females from the bottom 20% of the graduate earnings distribution.
So although graduates in general will be asked to contribute more to the costs of their education under the new system, the ones who as students were poorest will end up
repaying less in loansthan prior to the reforms. This is due to the combination of two
factors: first, the fact that they would not have to borrow as much money privately under the new system, and second, the two changes to the loan repayment conditions
that are coming into force at the same time21 as fees are being increased – both a
higher repayment threshold and debt write-off after 25 years.
20 Our assumption that all students would need to take on private debt to achieve the same standard of
living under the old system as under the new system helps to simplify the exposition. In reality, many would obtain it from parents, or would take on part-time jobs instead, which have potentially quite different impacts on educational outcomes.
21 Though strictly speaking, note that the repayment threshold changed one year before the introduction
of top-up fees, in 2005-06.
Related to this point, one could argue that one of the biggest losers of the reforms may in fact turn out to be private banks, who in the past may have profited from extending commercial loans to students whose parents had not picked up the full costs of their HE (though see also footnote 20). As we have just seen, increases in up-front support from taxpayers will almost certainly reduce the need for recourse to such relatively expensive types of loan.
Possible reforms to the new system
Looking to the future, it is likely that the level and form of taxpayer subsidy inherent in the loans may come up for review in 2009, when the DfES reports to parliament on the effects of the reforms. A number of suggestions have been made for reducing taxpayer costs, including the abolition of the zero real interest element of the subsidy – see Barr, 2004, and Astle, 2006. The reason given by proponents of this proposal is that, given the introduction of debt write-off after 25 years in 2006-07, the additional
benefit from the interest subsidy actually goes to those who are not the lowest earners.
Figure 8 illustrates this by showing how two variants - both of which restrict the value of the interest subsidy - compare to the new system of income-contingent loans to be introduced this year. Here we continue to assume a level of debt of £18,340 and compare the total value of debt repayments, the interest subsidy, and the total years taken to repay under each of three repayment schemes:
• New system: this is the system to be introduced in 2008-09 and described
already above.
• Variant 1: 2.5% real interest rate on debt: under this variant, the repayment
of loans remains income-contingent, with debt write-off after 25 years, but the interest rate subsidy is effectively eliminated by the charging of interest of 2.5% pa above inflation on the debt.
• Variant 2: “NZ” system: under this variant, similar to the one currently in
place in New Zealand, the repayment of loans also remains income-contingent, with debt write-off after 25 years, and the interest rate subsidy is eliminated by the charging of interest of 2.5% pa above inflation on the debt. However when earnings are low, the income-contingent repayment amount may be too low to
cover the interest element of the loan. In this case, the government would pay on behalf of the borrower the additional interest due, meaning that the outstanding balance on the loan would be prevented from spiralling during periods of low earnings.
Our calculations suggest that the removal of the interest subsidy (i.e. a switch from the new system to variant 1) would amount to the equivalent of the removal of an average up-front grant of around £2,465 for each female graduate and £2,880 for each male graduate (whilst the additional cost to the graduate of the “NZ system” relative to the new system would be around £1,940 and £2,280 respectively).
However, as can be seen from Table 5, these savings for the exchequer, and costs to
the graduate would be highest for men in the 2nd to 4th deciles of the male lifetime
earnings distribution, and for women at the 6th and 7th, deciles of the female earnings
distribution. The very lowest female earners would lose relatively little from the removal of the interest subsidy, since many are protected by the provision for debt write-off after 25 years.
Other options for reducing the taxpayer cost of graduate loans would include extending the length of time after which the loans are written off beyond 25 years, or reducing the repayment threshold, for example by removing the default indexation provision after 2010, so that its real value erodes over time. It should be noted that both of these options would affect low lifetime earners more than the withdrawal of the interest subsidy.
Another alternative, and a potentially revenue-saving reform to the loan system from the point of view of the Exchequer, could be to offer students the choice of a discount on their fee if they pay up front. For example in Australia, until 2005, students had the option of paying the fee upfront at the beginning of each academic term, at a 20%
discount.22 According to our calculations, just over one half of women and 77% of
22
This was reduced from 25% in 2005, and note that the proportion of eligible students choosing to pay
upfront was just over 20% in 2002.
men would benefit financially from this option.23 These are individuals whose earnings are sufficiently high that they would not gain much from the fee loan subsidies. This means that a substantial proportion of people would lose out financially if they were to go for the discount option, and only those students who have information to suggest that they will fall into a relatively high earning category
should consider taking the discount.24 Note also that risk averse students (or their
parents) who might prefer to pay off a fixed sum while studying could lose out financially from this decision.
Finally, it is worth considering what the additional costs to the graduate and exchequer might be if the fee cap, currently imposed at £3,000 per year, were lifted to £5,000. Figure 9 shows that of the extra £6,000 in fees over a three year degree that such a lifting of the cap would imply (i.e. an additional £2,000 per year above the current £3,000 cap), a very substantial proportion would in fact be covered by the taxpayer rather than by graduates, because of fee deferral. On average, female graduates would have to contribute £3,300 extra in total towards the increased fees (or 55% of the fee increase), and male graduates would have to contribute around £4,400 (73% of the fee increase), but the amount payable would be strongly increasing in lifetime earnings. Notice that the taxpayer subsidy for additional fee increases are greater than the average subsidies calculated for the full £18,340 loan (Table 4), since the income contingent system combined with the zero real interest rate means that each additional £1 borrowed comes at a greater cost to government and smaller cost to the borrower. Clearly any increase in the fee cap would boost universities’ income, but at the same time would put considerable upward pressure on public expenditure, unless the system of loan subsidies were reformed.
23 These figures are calculated by comparing the net present value of total fee and maintenance loan
repayments, with the sum of the discounted value (at 80%) of upfront fees and the net present value of maintenance loan repayments.
24 Note that the levels of uncertainty in future earnings and employment, which are at the core of this
5. The Shifting Balance of Funding
Whilst the analyses of the previous sections have highlighted the distributional effects of the new system for students and graduates, in this section we take each of these groups as a whole, as well as taxpayers and universities, and consider how they are affected financially by the reforms. In so doing, we show how the reforms shift the balance of funding for HE between the public and private sector.
We illustrate who pays for the system of HE funding in England by means of a circular flow of payments. Table 6 sets out our calculations of the net balance of payments (-ve on the table) and receipts (+ve on the table) between different participants within the HE system - universities, students, graduates and taxpayers - under the old and new systems of HE funding in England. Accounting for both where payments come from and where they go to results in a zero-sum. Comparing such zero-sums across different systems gives us a clear indication of the net winners and
losers (or less emotively, payers and receivers) from the new reforms.25 Note, these
figures are mainly based on official government public expenditure projections from 2005.
Looking at the first column of the table, we see that under the old system, universities received about £5.5bn in total funding for teaching, coming mainly from taxpayers (via direct payments to universities in the form of the recurrent teaching grant made to HEFCE each year, and fee exemptions), and also students (via up-front fees). Graduates also gained around £0.6bn, from maintenance loan subsidies (paid for by taxpayers). The second column shows that under the new system university coffers
are significantly swelled, to around £6.7bn.26 This increase is paid for by graduates,
through deferred fees (subsidised by taxpayers). Students become net recipients, receiving around £1.1bn in total from new grants and subsidies.
25 Of course, in reality the distinction between these different groups is more blurry than our analysis
suggests: for example, students go on to become graduates, so transfers between these two groups are really transfers across time, rather than between people. Most graduates, and some students, are taxpayers. Money paid to universities will in general benefit the students who attend them and the graduates they go on to become.
26
This amount has not been reduced by potential payments of new bursaries to students with parental income between £17.5k and £25k. We currently assume that 1/3 of students receive bursaries.
The final column of Table 6 shows the net impact of all these changes. First, universities’ net position improves by around £1.3 billion, from £5.5 billion under the old system to around £6.7 billion under the new system. On aggregate, this should make a significant inroad into the well-documented shortfalls of the university
sector.27 Second, the overall taxpayer contribution to the costs of HE rises by around
£1.1 billion compared with an unchanged 2003–04 system for tuition and student support. Third, students are better off under the new system due to grants and fee deferral, by around £1.6 billion (note that voluntary bursaries from universities, likely to amount to £300 million in total, improve students’ positions further). Finally, graduates contribute around £1.7 billion more, through increases in fees, offset by new loan subsidies from the taxpayer.
This analysis also highlights the changing balance of funding between the public and private sector as a whole as a result of the new reforms. Taking students and graduates together, we see that the net increase in contributions from these two groups combined amounts to the relatively small sum of £100m, whilst the net increase in contribution from the taxpayer amounts to around £1.1bn. This suggests that while the university sector as a whole is growing, the biggest net increase on aggregate is from the public not the private sector. However, if we consider tuition alone, it is certainly the case that the share of private contributions will be rising. This is illustrated in Figure 10. Prior to the introduction of top-up fees in 2006-07, the private contribution
to tuition costs, of around £5,000 per student per year, is 8%.28 With the new system
in place, funding could increase to around £6,000, or by 24%29 on average in real
terms per head, if all universities charge the full fee. The private fee contribution will
27 See for example, the submission from Universities UK to the 2004 Spending Review
(http://bookshop.universitiesuk.ac.uk/downloads/SR2004.pdf)
28 Based on HEFCE recurrent grant for teaching in England (which covers undergraduate and
post-graduate teaching), plus public and private contributions to the basic fee, divided by the number of FTE equivalent undergraduate and post-graduate students. Note that these funding per head figures are calculated on a different basis to those produced by the DfES and presented in its yearly departmental reports.
29 Based on DfES public expenditure estimates, projecting in total £2.25 billion in fee revenues each
year in steady-state. This figure assumes that 91% of universities charge the full fee, and excludes only the minimum mandated bursary amount of £300 for the poorest students on courses where the full fee is charged. The Office for Fair Access has estimated around 91 per cent of HEIs and FECs are planning to charge the full tuition fee of £3,000, and that a “typical” bursary would be considerably more than the minimum, at around £1,000. See Press Release from 17 March 2005 (www.offa.org.uk/news/2005/acc_agr.asp).
amount to around 33% of the total, though this will be substantially subsidised by the taxpayer in the form of loan subsidies, arising from the zero real interest rate on the new fee loans and the provision for debt write-off after 25 years. Taking into account the loan subsidy element of the fees, the private contribution will be around 23%.
The analysis in this section also suggests that some of the most important effects of the reforms will be distributional effects within the private sector, both over time (for example where there are shifts in costs from students to graduates), and, as we have seen already, between different types of individuals, for example by parental income, or by the level of lifetime earnings as graduates.
6. Conclusions
This paper has shown that the reforms to HE funding in England which were first introduced in 2006 and which will fully come into place in 2008, will result in a
significant increase in transfers from graduates and taxpayers, directed both towards
the funding of universities, and student support. A closer inspection reveals a more nuanced picture than this, with a relatively small overall net increase from the private sector, but with important distributional consequences of the reforms.
Individuals from the lowest part of the parental income distribution will typically find a substantial net reduction over their lifetime in the cost of their higher education, due to the new grants and bursaries. On the other hand, individuals whose parents come from the middle to high parts of the parental income distribution will typically end up seeing the costs of their higher education increased.
Grouping people by where they end up in the lifetime graduate earnings distribution, rather than by their parental origin, another interesting picture emerges: women with the lowest lifetime earnings will again see a reduction in the cost of HE as a result of the reforms (so long as they defer all possible payments through the subsidised loans on offer), while higher earning graduates will indeed in general pay more of the cost of their own HE as a result of the reforms. Our findings suggest that
contingent nature of loans under the new system do provided some level of insurance against low realized returns from HE for graduates.
Looking to the future, any cost reductions achieved by the possible removal of the
zero real interest subsidy would hit hardest those men in the 2nd – 4th lifetime earnings
deciles, and women in the 6th and 7th earnings deciles. The lowest earners would in
general be protected by such reforms, because of the provision for debt write-off. We conclude by stressing that our analysis highlights the varying distributional impacts of different HE funding policies. It does not represent a prediction of the effects of the reforms, as the lifetime earnings distributions do not represent forecasts of future earnings of graduates. Rather, they are based on current earnings data. Estimating the distribution of earnings of future graduates poses more severe challenges, particularly as this distribution is likely to itself be affected by the reforms. This is for a number of reasons. First, the reforms may affect the decision to participate in HE, which may alter the composition of students/graduates and thus earnings. Second, the reforms may have general equilibrium effects, through affecting the supply of graduates for example, which may alter the relative wages of future graduates. Third, the reforms may affect choices at university, such as courses studied and the length of time spent at university, both of which may affect lifetime earnings. We leave these important topics for future work to address.
References
Astle, J. (2006). ‘Open Universities. A Funding Strategy for Higher Education, Centre Forum (http://www.centreforum.org/Assetts/open_universities.pdf).
Barr, N. (1993). ‘Alternative funding resources for higher education’, Economic
Journal, vol. 103, pp. 718-28.
Barr, N. (2004). ‘Higher education funding’, Oxford Review of Economic Policy, vol.
20, pp. 264-83.
Barr, N., Falkingham, J., and Glennerster, H. (1995). ‘Education funding, equity and
the life cycle', in The Dynamic of Welfare: The Welfare State and the Life Cycle.
Eds. Jane Falkingham and John Hills. Prentice-Hall/Harvester Wheatsheaf, 1995, pp. 137-149.
Barr, N. and Crawford, I. (2005). 'Financing higher education: answers from the UK',
London and New York: Routledge, 2005, ISBN 0-415-34857-9.
Benabou, R. (2002). ‘Tax and education policy in a heterogeneous-agent economy:
what levels of redistribution maximize growth and efficiency?’, Econometrica,
vol. 70, pp. 481-517.
Bonhomme, S. and Robin, J.M. (2005). ‘Assessing Lifetime Inequality with Short Panels, with an Application to France, 1990-2002’, CREST-INSEE and CEPR. Chapman, B. (2005). ‘Income contingent loans for higher education: international
reform’, CEPR Discussion Paper 491.
Chen, X., Y. Fan and Tsyrennikov, V. (2006). ‘Efficient Estimation of
Semiparametric Multivariate Copula Models’, Journal of the American
Statistical Association, vol. 101, pp. 1228-1240.
De Fraja, G. (2002) ‘The design of optimal education policies’, Review of Economic Studies, vol. 69, pp. 437-66.
Dearden, L., Fitzsimons, E., and Goodman, A. (2005). ‘Higher education funding policy: a guide to the debate’, Election Briefing Note no. 67, Institute for Fiscal Studies (http://www.ifs.org.uk/bns/05ebn13.pdf).
Dearden, L., Fitzsimons, E., Goodman, A., and Kaplan, G. (2006). ‘Copula v ARMA Models of Earnings Dynamics’, mimeo, Institute for Fiscal Studies, London.
Dearden, L., Fitzsimons, E., Goodman, A., and Kaplan, G. (2007). ‘HE Student
Support Funding’, IFS Press Release, 23 Jul 2007.
Demarta, S. and McNeil, A.J. (2005), ‘The t Copula and Related Copulas’,
International Statistical Review, vol. 73(1), pp. 111-129.
Department for Education and Skills. (2003). ‘The future of higher education’, Cm.
5735, January.
Department for Education and Skills. (2007), ‘Departmental Report 2007’, Cm. 7092,
May.
Eaton, J. and Rosen, H. (1980). ‘Taxation, human capital and uncertainty’, American
Economic Review, vol. 70, pp. 705-15.
Fernandez, R. and Rogerson, R. (1995). ‘On the political economy of education
subsidy’, Review of Economic Studies, vol. 62, pp. 249–62.
Friedman, M. (1955). ‘The role of government in education’, in Economics and the
Public Interest. Ed. Robert A. Solo. New Brunswick, NJ: Rutgers University
Gallipoli, G., Meghir, C., and Violante, G. (2006). ‘Education decisions and policy interventions: a general equilibrium evaluation’, mimeo, University of British Columbia.
Genest, C., K. Ghoudi and Rivest, L.P. (1995). ‘A Semi-Parametric Estimation Procedure of Dependence Parameters in Multivariate Families of Distributions’,
Biometrika, vol.82, pp. 543-52.
Goodman, A. (2005). ‘User-charging in public services: the case of tuition fees for
Higher Education’, in Charging Ahead? Spreading the Costs of Modern Public
Services . Ed. Jessica Asato. Social Market Foundation.
Greenaway, D. and Haynes, M. (2003). ‘Funding higher education in the UK: The
role of fees and loans’, Economic Journal, vol. 113, pp. F150–F166.
Heckman, J., Lochner, L., and Taber, C. (1998). ‘General equilibrium treatment
effects: a study of tuition policy’, American Economic Review, Papers and
Proceedings, vol. 88, pp. 381–86.
Joe, H. (1997). ‘Multivariate Models and Dependence Concepts’. New York:
Springer-Verlag.
Keane, M., and Wolpin, K. (1997). ‘The career decisions of young men’, Journal
of Political Economy, vol. 105, pp. 473–522.
Kodde, D. (1986). ‘Uncertainty and the demand for education’, Review of Economics
and Statistics, vol. 68, pp. 460-467.
Lee, D. (2001). ‘An estimable dynamic general equilibrium model of work, schooling and occupational choice’, Ph.D. thesis, University of Pennsylvania.
Levhari, D., and Weiss, Y. (1974). ‘The effect of risk on the investment in human
capital’, American Economic Review, vol. 64, pp. 950–63.
Nelsen, R.B. (1999). ‘An Introduction to Copulas’. London: Chapman and Hall. Nerlove, M. (1975). ‘Some problems in the use of income-contingent loans for the
finance of higher education’, Journal of Political Economy, vol. 83, pp. 157-83.
Patton, A. (2006a). ‘Estimation of Multivariate Models for Time Series of Possibly
Different Lengths’, Journal of Applied Econometrics, vol. 21, pp. 147-173.
Patton, A. (2006b). ‘Modelling Asymmetric Exchange Rate Dependence’,
International Economic Review, vol. 47, pp. 527-556.
Sklar, A. (1959). ‘Fonctions de Repartition a n Dimensions et leurs Marges’, Publ.
26
Table 1. An outline of the old system and new HE funding system for England
The “old” system The “new” system
Students would pay £1,200 in 2006-07a From 2006-07 students pay £3,000
- Up-front fee - Deferred fee
(subsidised loans: zero real interest, 25 yr debt write-off)
- Flat fee rate - Variable fee rate
- Exemptions based on family income - No exemptions
- Pre 2004-05, no grant - Up to £2,700 in grants, plus
additional bursaries aIn 2005-06 the fee is £1,175, and in the absence of reform this is up-rated in line with inflation each year.
For more detail, see Dearden et. al. (2005).
Sources: Department for Education and Skills, The Future of Higher Education, Cm. 5735, 2003; The Higher Education Bill, Bill 35,
2004; The Future of Higher Education and the Higher Education Act 2004: Regulatory Impact Assessment, 2004; Moving toward a
Single Combined Grant for Higher Education, 2004; DIUS Press Release Increased Support for Students in Higher Education, 2007.
Table 2. The change in net financial position due to moving to the new funding regime by parental income. £ p.a.
Family income
<£22,500 £25,000 £45,000 >£60,000
Old system
Costs of attending:
Fees 1200 1200 1200 1200
Payments for attending:
Fee Remissions 1200 943 0 0
Maintenance loan subsidy 905 905 678 678
Net position 905 648 -522 -522
New system
Costs of attending:
Fees 3000 3000 3000 3000
Payments for attending:
Grant 2700 2700 755 0
Bursary 300 300 0 0
Maintenance loan subsidy 676 676 773 767
Fee loan subsidy 990 990 990 990
Net position 1667 1667 -482 -1243
Table 3. Expected* levels of debt on graduation under the 2003-04 and new systems (at 4 example levels of parental income)
Year of HE entry: Funding system: 2003–04 New system Maximum government External funding Below £22,500 p.a. £12,350 £5,990 £18,340 Around £33,500 p.a. £12,350 £4,665 £18,340 Around £50,000 p.a. £9,265 £7,225 £20,285 Above £60,000 p.a. £9,265 £4,925 £19,590
*Expected debt levels show the amount students could borrow in government loans available under both systems, plus the private debt that would be required under the base system to reach the standard of living achievable through maintenance loans and grants under the new system. The figures relate to students living away from home outside London on a three-year course for which the maximum fee is charged. All amounts are expressed in 2006–07 prices.
Table 4. Average graduate payments under new HE system (debt of £18,340), by decile of graduate lifetime earnings distribution
Decile of lifetime earnings distribution a NPV repayments, £ b Subsidy as % of loan c Years to repay loan
All Females Males All Females Males All Females Males
Poorest £9,077 £ 7,435 £13,430 50.5% 59.5% 26.8% 22.7 23.8 18.6 2nd £13,314 £10,900 £14,640 27.4% 40.6% 20.2% 19.4 21.6 15.7 3rd £14,419 £13,180 £14,925 21.4% 28.1% 18.6% 17.2 19.9 14.4 4th £14,792 £14,225 £15,160 19.3% 22.4% 17.4% 15.4 17.9 13.3 5th £14,963 £14,645 £15,330 18.4% 20.1% 16.4% 14.4 16.4 12.5 6th £15,164 £14,850 £15,490 17.3% 19.0% 15.5% 13.4 15.3 11.7 7th £15,333 £14,980 £15,630 16.4% 18.3% 14.8% 12.6 14.5 11.1 8th £15,527 £15,185 £15,790 15.3% 17.2% 13.9% 11.7 13.4 10.4 9th £15,757 £15,340 £15,880 14.1% 16.4% 13.4% 10.6 12.6 9.9 Richest £16,004 £15,670 £16,105 2.7% 14.6% 12.2% 9.4 11.1 9.0 All £14,439 £13,640 £15,238 21.3% 25.6% 16.9% 14.7 16.6 12.7
28
Table 5. Average additional costs to graduates of removing interest subsidies, relative to new system, by decile of the lifetime earnings distribution
Decile of lifetime earnings distribution Variant 1, 2.5% real interest £ Variant 2, “NZ system” £ Additional cost to graduate compared to new
system
Additional cost to graduate compared to new system F M F M Poorest £371 £2,924 £299 £2,118 2nd £1,016 £3,491 £819 £2,578 3rd £1,827 £3,390 £1,450 £2,539 4th £2,616 £3,168 £2,078 £2,457 5th £3,210 £3,010 £2,469 £2,379 6th £3,419 £2,852 £2,575 £2,306 7th £3,356 £2,710 £2,557 £2,248 8th £3,156 £2,552 £2,463 £2,154 9th £2,999 £2,459 £2,411 £2,068 Richest £2,670 £2,234 £2,242 £1,931 ALL £2,464 £2,879 1936 £2,278
Table 6. Circular flows of payments: old and new systems, £billions
OLD 2003-04 system
NEW 2008-09 system
New system compared to old system
Taxpayers -£5.6 -£6.7 -£1.1
Students -£0.5 £1.1 £1.6
Graduates £0.6 -£1.1 -£1.7
Universities £5.5 £6.7 £1.3
Sums of gains and losses £0 £0 £0
Notes: Totals may not sum due to rounding. For simplicity, student gains calculated here include gains from the introduction of maintenance grants compared to the 2003–04 system (transfers from taxpayers), but do not include changes to maintenance loans (which might be thought of as transfers from graduates to students). Bursaries assumed to be minimum mandated (£300).
Source: Authors’ calculations outlined in Dearden et.