Teacher perceptions (K-8) of data-driven decision making practices: A case study of one urban Saskatchewan school district
A Thesis Submitted to
The College of Graduate Studies and Research
In Partial Fulfillment of the Requirements for the Degree of Master of Education In the Department of Educational Administration
University of Saskatchewan Saskatoon, Canada
By
Chantelle Balicki June 7, 2016
i
Acknowledgements
This thesis has been an educational journey for me even before I entered the College of Education or graduate studies. I was fortunate enough to be raised within a family who always valued the importance of higher education and a public school system with exceptional
teachers who encouraged my learning and inspired me to become an educator myself. Also, to my students who remind me daily how important this work is and how academic achievement is only one piece of the unique individuals they will grow up to be.
I am thankful for the recommendations and assistance of my thesis committee: Dr. Burgess, Dr. Newton, Dr. Squires, and Dr. Engler-Stringer and for the direction and countless hours spent by my advisor Dr. Scott Tunison. I am thankful for each of your commitment to this work and for challenging me to turn this thesis in to a project I could be truly proud of.
Lastly, I am grateful for the support of my husband, Brady. He has written tuition cheques, busied himself outside to allow me a quiet house to myself when needed, put up with piles of papers and books all over our house, and continued to support my work after the first promised deadline had passed. And the second. And the third. I am so thankful to have married the most patient man.
ii
Abstract
This study examined the perceptions of kindergarten to grade eight teachers in one urban school district regarding data driven decision making practices and the perceived barriers and supports associated with current assessment expectations. The study answered the research question regarding perceived mechanisms K-8 teachers believe either help or hinder data-driven decision making practices both in their own classrooms and as part of a school-wide professional community.
Literature on the evolution of data-driven decision making practices and implications for the current expectations in Saskatchewan were examined. Literature on the positive effects of both a formal, data driven decision making process and classroom-based formative assessment practices were also examined, as well as leadership strategies that lead to more effective school data cultures and improved instructional practices from assessment data.
110 elementary teachers and school leaders participated in the online survey to determine current practices and perceptions of data-driven decision making expectations in one urban school district. Seven teachers and administrators also participated in a follow-up interpretation panel to help analyse survey results and add to the overall research
conversation. Results were analysed through a framework consisting of 9 indicators for
efficacious data driven decision making practices at the school level. Six themes emerged from the data to infer how teachers practice and perceive data-driven decision making processes. These theme include: valuing multiple forms of assessment, time and workload intensification, leadership and communication, resources required to be responsive to assessment data, and teacher training and capacity building.
iii
TABLE OF CONTENTS
PAGE
CHAPTER 1: INTRODUCTION……….. 1
Researcher’s Position and Statement of Problem………. 3
Purpose of the Study……….………. 4
Research Question……….. 5
Assumptions………. 5
Limitations……….…… 6
Delimitations………... 7
Defining Key Terms……….…. 7
Data Culture……….…… 7
Data-driven Decision-making……….……. 8
Data Teams……….…. 8
Large Scale Assessment……….……. 8
School-Wide Assessments………... 9
Classroom-Based Assessments……….… 9
Organization of Thesis………..…… 9
CHAPTER 2: LITERATURE REVIEW………. 11
Interdisciplinary Scope of Data-driven Decision-making……….….. 12
Industry……… 12
Medicine………. 13
Data Mining in the 1800s……….. 13
Lean Management………. 14
iv
Data-driven Decision-making in Education………. 17
International Context……… 17
United States………. 18
Impact of the NCLB Act………. 20
England……….. 21 Australia……… 22 Canadian Context……….… 23 Alberta………... 24 Ontario……… 26 Saskatchewan………. 29
Education Sector Strategic Plan……… 32
Critique of Data-Driven Decision Making Practices………..………..36
Data-driven Decision Making in Schools……….………. 39
School Leadership and School-Wide Planning……….. 40
ISLLC Standards………. 46
14 Parameters……… 48
Data-driven Decision-making at the Classroom Level……… 49
Ontario Teaching Standards……….. 50
Alberta Teaching Standards……… 51
A Case for Formative Classroom-Based Assessment…………..……….. 53
Defining Formative Assessment……….………. 53
Importance of Formative Assessment in the classroom……….……… 54
Framework for Study……….………… 56
v
Context of Study……….. 60
Province………. 60
School District……… 61
Collaborative Inquiry Teams……….. 61
School Based Data Teams………. 62
Research Design………. 62
Mixed-Method……….……63
Case Study………..………. 65
Survey………..……….………….. 66
Tailored Design Method………. 66
Interpretation Panel……….……….. 67
Data Collection Tools……… 69
Data Analysis……….. 69
Triangulation of the Data Sources………..70
Ethical Considerations………. 72
CHAPTER FOUR: PRESENTATION OF COLLECTED DATA………. 73
Setting………..……….………. 73 Context………..……….……….. 73 Study Timeline……….……….….….. 74 Participant Demographics………...……. 74 Survey Participants……….…….. 74 Teaching Experience……… 75
Data Team Involvement……… 76
vi
Teaching Assignment………..….. 77
Interpretation Panel Participants……… 78
Interpretation Panel Format……….………….78
Findings………..……….………… 79
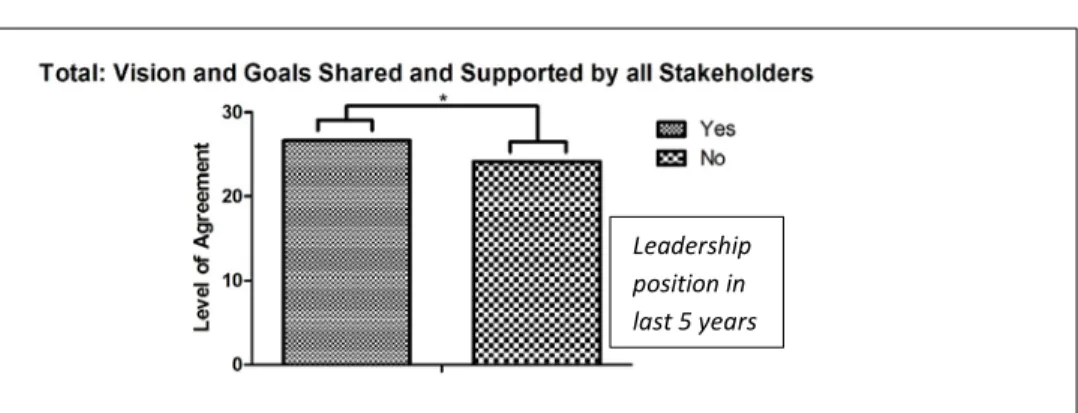
Section 1: Vision and goals are shared and supported by all………..…. 79
Section 2: Culture of Trust……….……….. 84
Section 3: Regular in-school grade-alike or subject-alike meeting times………... 89
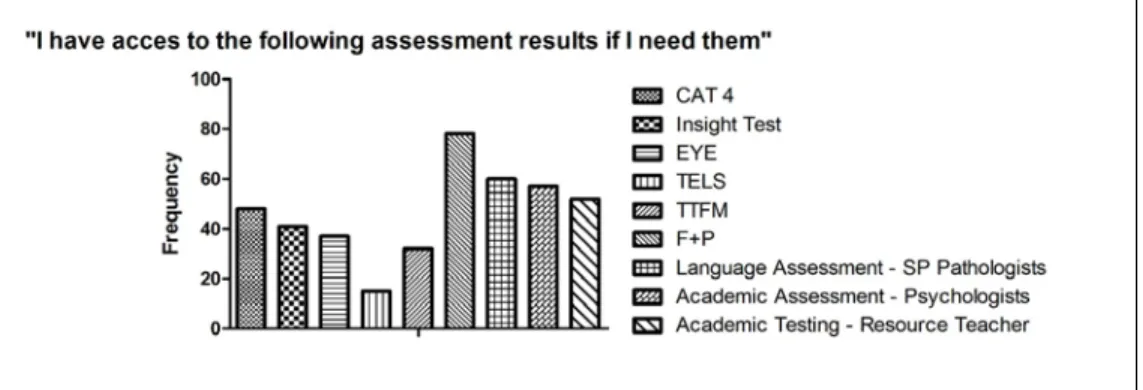
Section 4: Timely access to relevant data……….….. 91
Section 5: Early and ongoing intervention in response to assessment…….…….. 95
Section 6: Professional development and capacity building………..… 98
Section 7: Experts and coaches available to assist………..….. 101
Section 8: Multiple forms of assessment are valued………..………. 103
Perceived obstacles and supports for data-driven work………..…. 107
Obstacles……….…….. 107
Supports………. 110
Final thoughts and perceptions……….…………. 113
Discussion of thematic content………..… 113
CHAPTER FIVE: DISCUSSION AND IMPLICATIONS FROM THE DATA……….….... 109
Research questions answered……….…..…. 116
Mechanisms teachers believe help or hinder DDDM in classroom……….. 117
Mechanisms teachers believe help or hinder a school-wide data culture…….. 123
Implications for theory, practice and policy……….…….... 127
Transferability……….... 137
vii
Conclusion……… 140
REFERENCES………. 143
APPENDECIES………152
Appendix A: Consent for online survey participation……….152
Appendix B: Consent for interpretation panel participation……….154
Appendix C: Online survey instrument………..157
viii
List of Figures
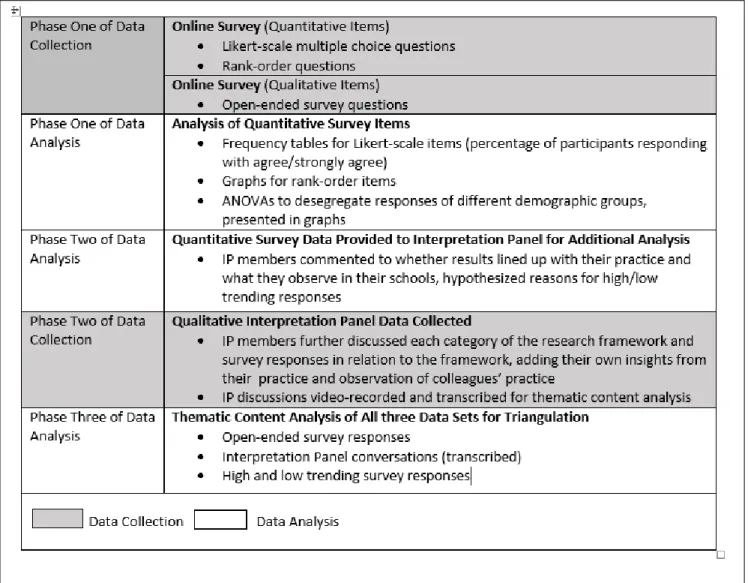
Figure 1: Description of Data Collection and Analysis……….…64
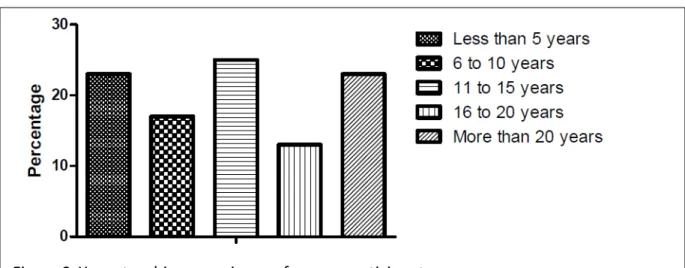
Figure 2: Years teaching experience of survey participants………..75
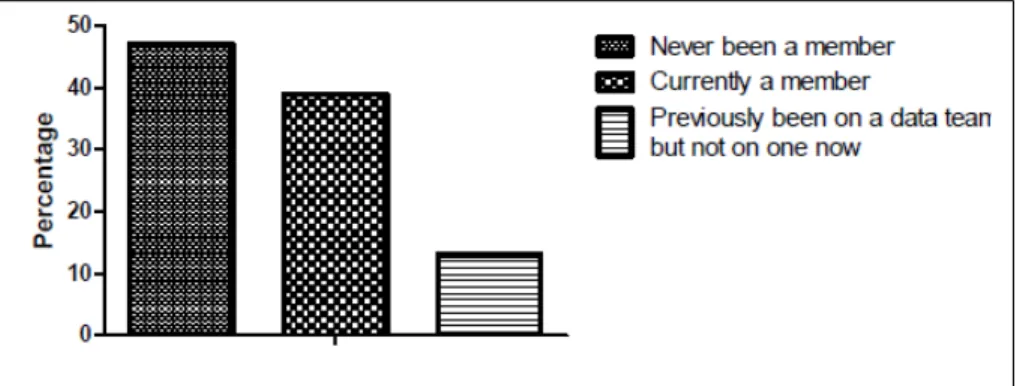
Figure 3: Data team involvement of survey participants………76
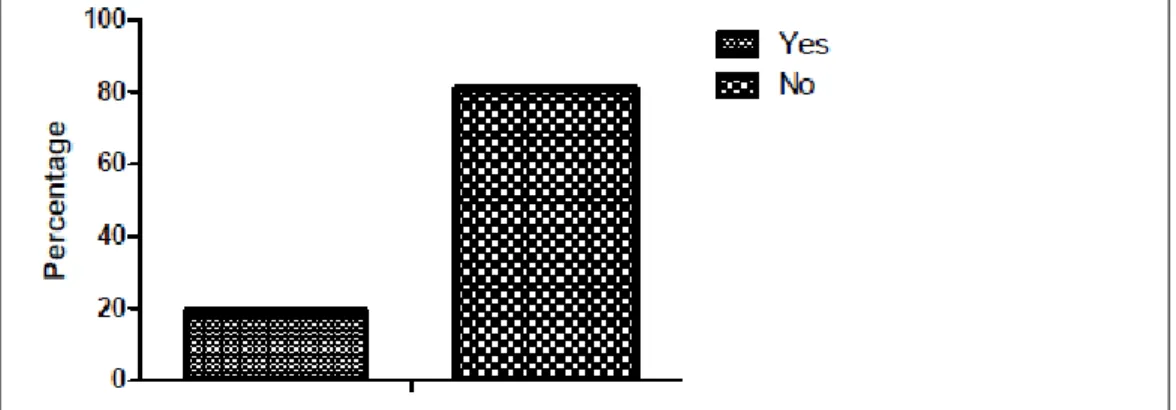
Figure 4: Leadership role of survey participants………..77
Figure 5: Teaching assignment of survey participants……….78
Figure 6: Vision and goals by data team involvement………....81
Figure 7: Vision and goals by leadership role……….……..81
Figure 8: Contribution to literacy goals by teaching assignment……….81
Figure 9: Culture of trust by leadership role……….……….86
Figure 10: Culture of trust by teaching assignment………..86
Figure 11: Culture of trust by data team involvement……….……….86
Figure 12: Timely access to specific assessments……….……….93
Figure 13: PD and capacity building by years teaching experience…………..…….………….100
Figure 14: Assessments most important to instructional decision making…………..…….104
Figure 15: Largest barrier to effective assessment practices………..108
Figure 16: 2nd Largest barrier to effective assessment practices………..109
Figure 17: 3rd Largest barrier to effective assessment practices………109
Figure 18: Most preferred support for effective assessment practices………111
Figure 19: 2nd Most preferred support for effective assessment practices………111
ix
List of Tables
Table 1: 2014-15 Government of Sask. Action Plan………34
Table 2: Research framework……….57
Table 3: Participants agreeing: Vision and goals supported by all………..80
Table 4: Participants agreeing: Culture of trust……….85
Table 5: Participants agreeing: Regular meeting times to discuss assessment………..90
Table 6: Participants agreeing: Timely access to relevant data……….92
Table 7: Participants agreeing: Early and ongoing responsive intervention……….96
Table 8: Participants agreeing: Professional development and capacity building………99
Table 9: Participants agreeing: Experts and coaches available………..101
Table 10: Participants agreeing: Multiple forms of assessment are valued………..104
Table 11: High trending responses………114
1
Chapter 1: Introduction
“If only medical thermometers could tell us how much and to what extent students have internalized learning experiences, teachers’ lives would be much easier” (Doubek, 2010, p. 11)
In Canada, and most of the western world, more formalized assessment tools are becoming increasingly more prominent as the basis for measuring both student achievement and school effectiveness. Currently every Canadian province and territory, with the exception of Prince Edward Island, has administered some form of large-scale student assessment whether by district choice or provincial mandate (Volante, 2007). Policies continue to change within each province, which have varied the extent to which provincial governments are looking to implement standardized measures of formal student achievement testing. Consequently, an increased focus on data-driven decision making with varying stakes and accountability has become the norm.
In addition to more formal or standardized measures, a focus on classroom-based formative assessment has also become increasingly popular in schools districts today and in educational research (Black & Wiliam, 2009; Fuchs & Fuchs 1986; Hattie & Timperley, 2007; Stiggins, 2002; Tomlinson & Moon, 2013; Wiliam, 2011). Many researchers argue that
improving formative assessment to respond to the needs of students and by including students in taking ownership of tracking their own learning progress has the largest impact on student learning (Black & Wiliam, 2009; Hattie, 2008).
2
Professional conversations around the topics of student learning and instructional decision making have always occurred in the education sector. Teachers talk in the staff room about new strategies they are trying in the classroom and whether or not they are contributing to student achievement. These discussions however have traditionally been based on a
teacher’s “gut feeling” or perceptions of personal experiences, often without evidence to support it. A newer development in the field of education is a more structured process of this-- the idea of data-driven decision making and evidenced-based practice to inform instructional decisions (Doubek, 2010). Given the clear research regarding the impact on learning outcomes effective assessment can achieve, it is no longer sufficient to base instructional decision making on gut feelings alone (Wiliam, 2009).
In educational research, the media, and in school board, district, and school-based discussions, the concept of using assessment to inform decision making is becoming
increasingly more common. Furthermore, many school divisions have taken a more formalized approach to this by implementing “collaborative inquiry teams” (CITs), “professional learning communities (PLCs)”, and “data teams” (DTs), among other organizational strategies, to encourage teachers and administrators to engage with both formative and standardized student assessment data (Love, 2009). While contemporary educators will have been involved in many of these organizational teams, questions still remain:
• Do educators value the process of using assessment data to inform decisions?
3
• Which types of data are most valuable to teachers when making decisions about student learning?
• Do current organizational structures in place actually lead to increased data-driven decision making practices among classroom teachers?
• Are educators using assessment effectively to (i) plan for instruction at the classroom level, and (ii) engage purposefully in strategic planning at the school-wide level?
• To what extent are data-driven decision making practices actually occurring in classrooms?
• Are school-level and division-level leaders able to impact data-driven decision making practices in schools?
Researcher’s Position and Statement of Problem
As a Special Education Resource Teacher, administrator, and as a school leader on our staff’s data team, I have been working with individual classroom teachers and whole staffs to use data from both standardized, large-scale assessments and classroom-based assessments to make informed decisions about student programming and long range planning for student success. In recent years, I have seen school divisions in this province place greater emphasis on data-driven decision making.
The process of using assessment data formatively to inform school-based and classroom-based decision-making in this province is evolving. At a broader level, I have
witnessed administrators encourage staff and community members to engage with school-wide data and contribute to strategic planning and goal setting for the school. In addition, CITs and
4
DTs have been established to promote data-baseddecision making at both the school-wide and classroom level. I have seen engagement in assessment data evolve over the years from
teachers merely collecting summative classroom assessment data for reporting purposes to teachers beginning to value various types of student assessment, both formal and informal, to improve instructional decisions on a more regular basis.
I have an educational background in using assessment to differentiate for students, and as a specialized leader in this area this topic is of interest to me. As an administrator I also want to know more about such things as:
• how to engage teachers in the process of using assessment effectively to inform classroom instructional decisions;
• how to engage my staff as a whole to collaborate as part of our whole-school strategic planning process;
• how to build skills and capacity in my staff so that we might use assessment practices more effectively to increase student success; and
• to determine what my staff needs in order to be effective data-driven decision makers in a formative assessment process.
Purpose of the Study
The purpose of this study was two-fold:
1. To examine the current data culture in one urban school district in Saskatchewan and the extent to which teachers valued particular data-driven decision making practices.
5
2. To examine teacher perceptions in relation to data-driven decision making practices and what might improve these practices.
Research Question
Given the purpose of this study the following research question was explored:
1. What are the perceived mechanisms K-8 teachers believe either help or hinder data-driven decision making practices
a. in a teacher’s own classroom?
b. as part of a school-wide professional community?
Assumptions
In my own experiences, I have found that though teachers value assessment, they do not always value these processes in the same manner ministries and division-level leaders do. I have also found that teachers want to use assessment measures to plan for instruction, but they do not always have the skills or supports to do so effectively, or they experience or perceive barriers to improving their practices in regards to responsive instruction. My
assumption is this experience is perhaps universal to a wider group and I wanted to dig deeper to examine teacher perceptions in one urban school district to determine if I was correct.
I have found that many teachers view at least some form of data-driven decision making as something they need to do in order to support higher level initiatives rather than a strategy they find meaningful as educators to make a difference in their classrooms for student success. It is also my experience that some teachers have yet to understand the terminology and theory
6
around data-driven decision making and how to collect the right assessment data to answer the questions they have around instructional programming. I have noticed that many teachers do not have the skills to analyse assessment data effectively and make changes to their instruction based on quality data. In addition, I wonder if educators feel they have the time, energy,
training, buy-in, direction, and support from leadership to see the value in this process and to feel capable of employing data-driven decision making strategies.
I assume there are many obstacles and support mechanisms to be identified that either enable or hinder the assessment culture in schools and the individual assessment practices among classroom teachers.
Limitations
This study had the following limitations:
• Though the researcher made every effort to guarantee anonymity and make
participants feel comfortable, they may not have felt comfortable sharing their opinions and practices with a colleague employed in their same school district.
• Data collection instruments could have potentially been misinterpreted by participants.
• Participants were from one school division therefore results cannot be generalized to other divisions where different structures and expectations are in place.
• Because participation in this study was “low stakes” for participants, response rates were lower or may have attracted only those participants with an extreme opinion regarding assessment practices.
7
Delimitations
This study had the following delimitations:
• The study focused on one urban school division in Western Canada.
• Participants included kindergarten to grade 8 teachers, including: classroom, itinerant, special education/resource, teacher librarians and English as an additional language teachers. Administrators who carried a current teaching load were also included (Vice Principals).
Defining Key Terms
For the purpose of the study, these key terms are defined as follows:
Data culture. Building on the work of the Council of the Chief State School Officers
(2008), Love (2009), and Peery (2011), a data culture is a community of inquiry that uses data-driven decision making for the purpose of improving student learning and involves:
a) building collaborative teams that engage in assessment data together as a staff; b) using available assessment data frequently, productively, in depth and connecting it to desired results; c) using assessment data formatively to improve instruction and decision making d) building distributive leadership and teaching capacity regarding data-driven
assessment practices; and
8
Data-driven decision making. Sometimes referred to as “evidence-based practice”,
data-driven decision making has been defined by many researchers in the field. Building on Love’s work (2004),data-driven decision making (DDDM) is the process by which professional educators, both individually in their own work and collaboratively with colleagues or whole staffs, engage in collecting, interpreting, and using assessment data to inform instructional practices with the ultimate goal of increasing student achievement. Nancy Love (2004) defined DDDM as: “the [process of examining] multiple measures and multiple levels of data, to consider the research, and to draw sound inferences” (p. 22).
Data team. A data team (DT) is a model for continuous, collaborative action that
inspires and empowers professionals to improve teaching, learning, and leadership for all (Reeves, 2010).According to Reeves, the terms, collaborative inquiry teams, professional
learning groups, and data teams, among other terms, are used interchangeably in the literature to describe small groups of professional teaching staff who collaboratively engage with student data and experiment with different research-based instructional strategies to improve student learning outcomes (Reeves, 2010). DTs could consist of (i) small, grade-alike or subject-alike groupings of teachers working together to collect evidence toward a particular student achievement goal, or (ii) a more broad, school-wide team who use data to steer strategic planning (Love, 2009).
Large-scale assessment. Large-scale assessments are summative, district or
province-wide assessments (Love, 2009). Specifically, these assessments are standardized and provide large-scale information on student achievement, student cognitive potential, school
9
demographics, and/ or attitudes. The Canadian Achievement Test (CAT), Canadian Test of Cognitive Skills (CTCS), Programme for International Student Assessment (PISA) and The Pan-Canadian Assessment Program (PCAP) are examples of large scale assessments.
School-wide assessments. School-wide assessments are defined as those that schools
have chosen collectively to evaluate student progress toward individual school-based goals. These may be standardized and formal, or designed collaboratively by teachers. They could be used formatively, for summative purposes, or both. School-wide assessments are adopted by every classroom teacher in a school, or specific groups of teachers, to ensure the same assessment tool is used to measure a school-wide achievement goal (e.g. improved reading comprehension or increased fluency of basic math facts).
Classroom-based assessments. Classroom-based assessments are teacher chosen
and/or developed assessments, for formative or summative use, not mandated by
administration, school districts, or government. These assessments may be constructed or pre-selected by a teacher to assess student success on curricular outcomes. Checklists, rubrics, math problem of the week, anecdotal notes, pre-and post-unit tests, task-based assessments, professionally developed assessments designed by or chosen by the teacher are examples of classroom-based assessments.
Organization of Thesis
This thesis is organized into five chapters. The first chapter has introduced the thesis topic and questions of inquiry that has led to the research study. I have provided reasoning for my interest in this topic, how my own educational background has lead me to a study of
data-10
driven decision making, and the significance of the topic within the current educational context. Assumptions, delimitations, and limitations were outlined and definitions of key terms that are essential to this thesis were provided.
In the second chapter, I provide a review of the contemporary and relevant literature regarding the history of data-driven decision making as well as the current context in which educators find themselves in terms of data-driven decision making. Literature suggesting effective practices for leaders at the school level and teachers at the classroom level regarding data-driven decision making is also explored. I conclude chapter two with the conceptual framework that guided the inquiries associated with this thesis.
In chapter three I describe the methodology used in the study. The design of the study is outlined and ethical considerations are discussed. In chapter four I present the data collected from (i) the online survey tool, and (ii) follow-up interpretation panels as well of an analysis of these data. Finally, I conclude with chapter five and answer the research questions and outline implications for educational leadership as well as potential areas for further study and inquiry on the topic of data-driven decision making in Saskatchewan elementary schools.
11
Chapter 2: Literature Review
Data-driven decision making (DDDM) is not a new concept; it has existed as part of industry and government policy, and the field of medicine for quite some time (Hooper, 1968; Johnson, 2007; United States department of Defense, 2013). In more recent years, beginning in the mid-80s, this term began to work its way more specifically into the field of education. Though the idea of collecting data in schools on student achievement, attendance, graduation rates, etc. has been a part of education for decades, it has become more important in recent years to report and be accountable to these data in informing government and the public on the true state of the education system. More importantly, it has become increasingly apparent that data-driven decision making practices, when used effectively, can have a large impact on improved student learning (Black & Wiliam, 2009; Hattie, 2009).
This chapter will briefly review the evolution of DDDM. First, an overview of the evolution of DDDM practices in government, industry and the field of medicine is provided. Secondly, DDDM will be reviewed in terms of its evolution in the field of international education contexts, within Canada, and in the current context in the province of Saskatchewan. This evolution will be described both in terms of formal assessment practices for accountability purposes, and formative assessment practices for improved instructional decision making and student outcomes. Third, a review of current leadership practices expected to improve DDDM practices and overall student achievement will be examined followed by expected practices for classroom teachers to ensure data and assessment practices are used appropriately to inform instruction and plan for improvement in student achievement. I conclude this chapter with the conceptual framework that has guided this research project.
12
Interdisciplinary Scope of DDDM
Much of what we see in the contemporary literature regarding data-driven decision making in the field of education has derived from the evolution of this concept in industry, medicine, and broader government policy. Each one of these sectors has had an impact on how we have come to use data in schools. While it is beyond the scope of this thesis to document fully the evolution of DDDM in the above-mentioned fields, this section will briefly detail the influence on the term and current implications for the education sector.
Industry. The concept of using data to increase efficiency started to popularize
following the second industrial revolution. Populations were growing, and technology had been introduced which allowed for mass production of goods at a price the general population could now afford. Mass production and the assembly line became the main structures in industry production and companies needed to look toward methods of increasing productivity to meet market demands and capitalize on profits (Kucera, 2001).
At the turn of the twentieth century, William Fredrick Taylor was looking to improve efficiency in the work force through his Scientific Management Theory (Taylor, 1911). Through extensive observations and data collection Taylor discovered three causes that led to inefficient work in the labor field. First, the misconception among workers that if they were to work faster and more efficiently, they would inevitably be out of work as they would be producing faster than demand. Second, Taylor observed the natural tendency for workers to want to “take it easy” if they are not being rewarded for working harder; and third, that work methods are often not scientifically standardized where workers lack training in the most efficient methods
13
to complete their work (Taylor, 1911). In response to Taylor’s day to day field research, production became more scientifically controlled and streamlined by upper management (Kucera, 2001). It was here that industry started to look at specific methods, or evidence-based practice, that statistically produced higher productivity rather than relying on the advice and preferred practices of veterans in the field to simply train employees on the methods they preferred.
This model of thinking was also popularized by Henry Ford and subsequently the Japanese auto industry to increase efficiency in the mass production of automobiles (Kucera, 2001). This thinking was data-driven decision making before the term was ever coined, and though controversial (Proudlove, Moxham & Broaden, 2008; Young & McClean, 2008) we recognize these data-driven philosophies in our educational practices today, and in the field of medicine as well.
Medicine. The concepts of data mining, evidence-based practice, and Lean management
in the field of medicine have influenced DDDM policy and actions in the field of education. One of the earliest successful studies including data mining in the field of medicine was recorded in the mid-1800s when London was hit by an infectious cholera outbreak.
Data mining in the 1800s. John Snow became known as the father of epidemiology
through his innovative methods of mapping data to disprove the miasma theory that cholera was an airborne disease (Fine, Victora, Rothman, Moore, & Yuan, 2013). Through looking for trends in data and mapping them out, Snow was able to prove that the cholera outbreak was instead spread through the drinking water at the Broad Street well. Snow combined
14
epidemiology (Johnson, 2006). Through these methods scientists began to look for trends in data to inform decision-making processes.
Lean management. Similar to Taylor and Ford’s methods of streamlining processes and
creating more efficient systems in industry, recently these processes of data-driven decision making has been used in the field of medicine through the practice of Lean management.
Lean management originated from the Toyota Motor Company in Japan in an effort to increase productivity by decreasing waste and has impacted many business models in industry, medicine, and education (Kucera, 2001; SHQC, 2015; Teich & Faddoul, 2013). Though this production system was established in 1918, the term “lean” was coined in 1990 when exploration of the Toyota model led to a transference of a working system that could be applied to a variety of different organizations, industries, and management issues (Teich & Faddoul, 2013). It was in 1990 when Lean management was introduced to the healthcare system for the first time. Engineer and management consultant, Joseph Juran linked the two industries and their management principles by advising the health care system to look to other industries to determined what has worked and what has not, and advising that managerial processes are alike in all industries despite differences in product or client (Manos, Sattler, & Alukal, 2006).
As defined by Teich and Faddoul (2013), Lean is a “multi-faceted concept that requires organizations to exert effort along several dimensions simultaneously” (p. 2). The purpose of Lean management is to create more efficient systems which minimize wasteful efforts. Hoshin Kanri is the framework used in the Lean management movement in Saskatchewan health care
15
to create better efficiency that was adopted from Toyota Motor Company. It provides a framework for strategic planning in a variety of organizational settings designed with the following benefits:
• to provide a focused corporate direction by annually setting a few strategic priorities;
• to align the strategic priorities with local plans and programmes;
• to integrate the strategic priorities with daily management; and
• to provide a structured review of the progress of the strategic priorities (Tennant & Roberts, 2001).
The Saskatchewan health care system in Western Canada adopted the Hoshin Kanri model for Lean management in learning from other health systems that patient care could be improved if systems plan and work in a more coordinated way (Saskatchewan Health Quality Council, 2015). In 2014 the Government of Saskatchewan initiated a five-year plan with
strategic priorities for 2014-2015 (Government of Saskatchewan, 2014c). The plan is extensive and includes measureable healthcare outcomes to be met through improvement targets within the five-year plan. For example, a 2014-2015 breakthrough improvement goal has also been set with aims to improve emergency department wait time and patient flow. A Hoshin target has been set to ensure at least 85% of patients requiring admission from emergency are admitted to an appropriate bed within 5 hours (Government of Saskatchewan, 2014c).
This plan was initiated through the Government of Saskatchewan’s Vision 2020and Beyond goals which include goals and plans for growth in Saskatchewan across a variety of
16
government sectors by the year 2020. Vision 2020 has greatly influenced the contemporary educational context in Saskatchewan and will be discussed in more depth later in this chapter.
Government. As industry started to see the benefits of using data to inform decision
making in business, western governments started to utilize this practice as well. One example of this is the evolution of data-driven decision making in the United States during the Kennedy administration (United States Department of Defence, 2013).
Though Henry Ford’s theories of productivity and efficiency were grounded in the intent to drive industry, similar patterns of thinking were beginning to emerge in government policy in the United States. As Secretary of Defence, McNamara worked towards unifying supply
procurement, distribution, and inventory management (United States Department of Defence, 2013). His institution of systems analysis became a basis for decision making on force
requirements, weapons systems, and other controversial matters (United States Department of Defence, 2013). One example of this is the implementation of the Planning Programming Budgeting System (PPBS).
The purpose of the PPBS was to analyze the requirements for defence systematically and to produce a long-term, program-oriented defense budget for the United States
Government. It put major emphasis on identifying program objectives by measuring actual results in quantitative terms and required some “bureaucratic unlearning” for government administration (Hooper, 1968). This philosophy meant administration would have to learn to measure results differently than they were traditionally used to; they would be asked to use concrete numbers and measurements of successes and failures rather than anecdotal
17
conversations among experts about what ought to work. For its time, the PPBS system of analysis was controversial. It was criticized by one journalist as being a “human IBM machine” who cares more for statistical logic than for human judgements. (United States Department of Defence, 2013).
In this new era, concrete data analysis was being used to make government decisions over the qualitative opinions and intuitions of experienced policy makers, or at least alongside them. In the early 1990s the Clinton administration introduced the Government Performance and Results Act. It is here that we start to see the emphasis on accountability, results, and standards across multi-year plans in the field of education in the western world that has been met with both praise and critique.
Data-driven Decision Making in Education
The process of data-driven decision making (DDDM) has evolved in the field of education in multiple countries world-wide and in a variety of educational contexts. Many of these contexts have influenced the current era we find ourselves in Saskatchewan today concerning how we use assessment data to plan for student success.
International Context
An international educational context and relationship to DDDM will be briefly reviewed in the following section. Given the United States, as our neighbouring country as well as a political world leader, has influenced educational direction in Canada, and both England and Australia are two Commonwealth countries who share a similar curricular focus with Canada,
18
these comparisons seem appropriate outlining the evolution of data-driven decision making and its current context today in education.
United States. For much of the 1990s the Clinton administration in the United States
pushed to increase the demands of accountability in education. The following section will review a linear recent history as it applies to the topic of data-driven decision making in the education sector.
In 1993, President Clinton signed Public Law no. 103-62, the Government Performance and Results Act (GPRA). The portions of the act that have influenced DDDM practices in
contemporary education include a call to improve the confidence of the American people in the capability of the Federal Government by systematically holding federal agencies accountable for achieving program results as well as to Initiate program performance reform to set program goals, measure program performance against those goals, and report to the public on their progress (NASA Headquarters Library, 2009). Also, Clinton called to improve Federal program effectiveness and public accountability by placing a focus on results (NASA Headquarters Library, 2009). Though intended for Federal regulation and to encompass a broader scope at the government level, we start to see the value the United States Government was placing on accountability and results-oriented legislation. By the mid-nineties, Clinton began to narrow this expectation to speak specifically to the field of education.
In Clinton’s fifth state of the union address he called for a “national crusade for educational standards” to represent what all students in America should know to succeed in the twenty-first century (Clinton, 1997). He further asked that over the next two years national tests of student achievement be developed in the areas of reading and math, and that every
19
state adopt standards to measure student achievement in grades four and eight. By the late 1990s it became clear formal accountability measures were not a passing trend. In his sixth state of the union address Clinton spoke of a ten-point plan to move the country forward in the field of education. This plan included a larger emphasis being placed on reading standards (Clinton, 1998). Clinton spoke to the importance of ensuring all students are reading by age eight, raising the bar for expectations and accountability on student learning, and accounting for teacher competency (Clinton, 1998).
In 1999 Clinton took initiatives that were perhaps most influential to the educational policy and legislation we see in the United States today. For the first time, these accountability measures were being recognized as “high stakes” when Clinton demanded low performing schools improve their results or be shut down (Clinton, 1999). In this address it was made clear that school districts would be held accountable for teacher performance and school
effectiveness. In terms of data-driven decision making he stated that his Education
Accountability Act would require every school district receiving federal funding to take the following steps:
• ensure that no child would graduate without being able to read;
• to turn around worst performing schools or shut them down; And
• to empower parents with more information and choices regarding public schools. Report cards for each school would be issued to the public to indicate quality as well as an increase in charter school options (Clinton, 1999)
20
Points two and three: to turn around worst performing schools and empower parents with more information, have formed the foundation for later developments in educational
accountability and how schools use data to inform instruction and decisions that will improve student achievement in the United States.
Three days after taking office, George W. Bush announced his intentions for the No Child Left Behind Act (NCLB Act). Under this Act, the US government aimed to increase accountability for educational standards while providing flexibility for states, school districts, and schools to meet standards based goals in regards to student achievement (Dillon & Rotherham, 2007; US Department of Education, 2002). While the NCLB Act illustrated many areas pertaining to educators, of particular interest to the topic of data-driven decision making is the concept of measuring Adequate Yearly Progress (AYP). This measure of AYP began to force school districts to be accountable for their progress in student achievement (Dillon & Rotherham, 2007).
Impact of the NCLB Act. Under the requirements of the NCLB Act, in addition to a state’s own accountability plan, school districts are provided guidelines to calculate whether a school meets AYP (Dillon & Rotherham, 2007). In exchange for complying with these requirements, states receive federal funding for educational services. If schools failed to meet the
requirements of AYP they would be subject to review and possible closure or forced change in management (Dillon & Rotherham, 2007). The idea that student achievement and school success was to be evaluated by standardized measures, that schools would be held accountable to these measures, and that these measures were to include all, or the vast majority of
21
education today.
With stakes this high for American schools, using data appropriately and creatively to not only prove AYP but to inform instructional practices and school policies to ensure AYP was met became crucial. Though the United States’ education model is known for its “high stakes” approach to holding schools accountable for student learning (Amrein & Berliner, 2002;
Diamond & Spillane, 2004), countries such as England, Australia and Canada have followed suit in implementing accountability measures for schools as well, and measuring student
achievement to inform instruction, policy, and in some cases legislation.
England. In contrast to the United States and Canada, where elementary and secondary
curriculum is a state or provincial responsibility, the Education Reform Act, 1988 in England established a national curriculum which includes both content areas to be taught and assessment expectations. In England it is also expected that schools include students in mandated national assessments in order to receive public funding (Cumming, 2012). Common curriculum and public examinations were also included in the traditional make up of
educational assessment in England (Cumming, 2012). By 2010 the educational accountability focus had shifted from the use of end of secondary school outcomes to the national curriculum assessment in English and mathematics for 11 year olds in elementary schools (Cumming, 2012).
This external reporting of student outcomes had become more high stakes for English schools as they were now reported to the public. School performance data would provide parents and the media with the capacity to rate school performance on different performance indicators. This practice forced school leaders to create action plans to increase student
22
proficiency or they may be turned into academies, and managed similarly to US charter schools, or face closure (Cumming, 2012). For this reason, using data to inform strategic planning, allocation of resources, as well as classroom-based instruction or student intervention became highly important as the alternative to increased student performance was so high stakes.
Australia. In Australia, the current educational policy is somewhat less clear. The
Australian government has no specific constitutional responsibility for education which leaves ambiguity over whether education is to be a federal or state domain (Cumming, 2012).
Educational policy documents indicate education is a state and territory matter; however the Australian federal government has used the “power of the purse”, to disperse income taxes through funding provision acts to legislate considerable centralized control in education policy (Cumming, 2012). Currently, in order to receive funding for public, private, and religious-based schools all students in years 3, 5, 7, and 9 must participate in annual common national tests in the areas of literacy and numeracy. Since a national curriculum is not in place, the tests for accountability purposes are based on agreed upon standards for students at these year levels (Cumming, 2012).
In addition, each state has school-based assessments of the curriculum, some of which have an external public examination component in the final year of secondary school. In contrast to the US and England however, Australia’s accountability assessments have been independent of state curriculum expectations (Cumming, 2012). Originally, to ensure basic outcomes were being met, national statements of minimal standards that all students were expected to achieve were developed and funding was tied to these. The current assessment and accountability plan in Australia however was developed by joint agreement of the state
23
ministers in 2005 and determined standards that students would be expected to achieve by the end of years 2, 4, 6 and 8 (Cumming, 2012).
Though students are socially promoted through the grade levels in Australia, regardless of their achievement on these examinations, teachers are expected to adapt instruction to a variety of student learning levels, and therefore this data is useful in determining proper
student programming (Cumming, 2012). These national examination scores are also reported to the public through a federal website. Individual schools in Australia are compared to
statistically similar schools, using demographic information. This public knowledge of school performance has increased the stakes of these examinations (Cumming, 2012). As in the US and England, funding is tied to school performance outcomes.
Canadian Context
In Canada, pre-kindergarten to grade twelve education is the responsibility of each individual province and territory, with some funding being allocated at a national level for the education of First Nations, Inuit and Métis students (Government of Canada, 2010). Currently there is no national curriculum or formal set of national standards to measure schools or student achievement for the purpose of accountability (Wallner, 2009); however, Canadian-normed standardized exams are given to many Canadian students at the choice of individual provinces or school divisions, such as the Canadian Achievement Test (CAT) or the Canadian Test of Cognitive Skills (CTCS) for planning and programming purposes (Canadian Test Centre, 2013). In addition, many Canadian provinces mandate provincial tests with varying stakes from one province to the next. Some of these will be reviewed in the sections to follow. Each
24
school management systems to ensure they are effective through provincial ministries of education (Wallner, 2009).
Recently, accountability measures have been used more frequently in Canadian
provinces to determine funding, allocations of resources, and in holding schools responsible for student achievement. From this, the practice of DDDM has become almost synonymous to the term, accountability. The remainder of this section will review the formal data-driven decision making context in the Canadian provinces that have perhaps had the most impact on
educational policy in Saskatchewan, the proposed province of study.
Alberta. In the past couple of decades Alberta has actively increased accountability for
educational performance through student achievement and examination programs, evaluation policies, and through publicly reporting requirements.
In 1994, the Alberta government introduced legislation that mandated accountability measures for all government departments, including education (Burger, Bolender, Keates, & Townsend, 2000). This legislation led to a province-wide planning model for increased and improved reporting of information to enhance accountability measures (McEwan, 1995). In addition, student information systems began to provide policy makers and administrators with accurate, up-to-date information regarding student achievement and demographics (McEwan, 1995). It is at this point in time that the Alberta education system needed to look more closely at the necessary data in order to inform policy and school decision making.
The Educational Quality Indicators initiative was another government implementation to promote results-based education in Alberta. Each aspect focused on specific areas of educational improvement and accountability, and consisted of comprehensive school system
25
reviews, school and district profiles, and a model for school evaluation. From here, annual reports were distributed to superintendents and principals, and eventually to the public (McEwan, 1995). Administrators would need to be accountable for the educational decisions being made in their schools and would need to reference concrete data to back these decisions. After all, the public and government would have these data as well.
In 1995 the Government Accountability Act stated the following:
• a board shall develop a reporting and accountability system on any matter the Minister prescribes;
• a board shall disseminate any information in the reports and accounts produced to students, parents, electors or the minister in the manner the Minister prescribes; And
• a board shall use any information in the reports and accounts produced in the manner the minister prescribes (Burger et. al, 2000).
In addition, the Accountability in Education Policy Framework provided that:
• provincially mandated goals, strategies, and measures for school boards and schools will ensure alignment with key provincial directions;
• six of nine provincial goals and eight of 40 provincial strategies apply directly to school board plans for the upcoming school year;
• school boards should determine additional goals, strategies and measures to reflect local needs; And
26
• school councils should be considered as key participants in communicating local results and in suggesting ways to improve education at the school and board levels on the basis of local results (Burger et. al, 2000).
More currently, Alberta has introduced an Accountability Pillar of the Renewed Funding Framework with the goal of improving student learning achievement while maintaining fiscal responsibility in funding education (Government of Alberta, 2013). The Accountability Pillar was meant to enhance the use of measurement in the performance management of school
authorities and included outcome based performance measures, annual surveys of parents, students and teachers, as well as transparent reporting and accessible data reports. Based on provincial achievement exams, schools are ranked according to achievement and color coding methods are used to report whether schools have improved, maintained, or declined in meeting the set standards (Government of Alberta, 2013). Though the government of Alberta has not mentioned high stakes accountability measures in the uses of these rankings, such as forced change in management for low performing schools or school closures as seen in the US or England, the message of transparency is clear to the public that schools and districts are asked to plan for improved student achievement in response to the data.
Ontario. Recently, the province of Ontario has taken significant steps to increase
accountability in education through a Provincial Assessment Program with the Educational Quality and Accountability Office (EQAO). With the exception of a few samples of student assessments during the 1970s and 1980s, Ontario had a relatively scarce history of using large-scale assessment; certainly there was no evidence of high-stakes testing for students, schools
27
and districts (Earl & Torrance, 2000; Volante, 2007). This practice changed in the mid-nineties with the establishment of the EQAO as a Crown agency in 1996 in response to the Report and Recommendations from the Royal Commission on Learning, which called for an independent testing agency among other changes to the Ontario education system the previous year (EQAO, 2012; Volante, 2007). In its report the Commission concluded that province –wide testing of all students would be required to provide “independent and public scrutiny of the education system” (EQAO, 2012, p. 53). From this point forward accountability measures have become more prominent in the province of Ontario. The EQAO has been adding initiatives ever since to improve academic success of Ontario students and has definitely had an impact on
accountability measures and assessment practices in Ontario (EQAO, 2012; EQAO, 2014; Volante, 2007).
A requirement of the EQAO assessments was to clearly link to the Ontario Curriculum goals in which students are expected to reach by key stages of their education (Educational Quality and Accountability Office, 2012). In 1997, the EQAO began its assessment work with its first full-census assessment in reading, writing and mathematics of all grade 3 students and a sample assessment of grade 6 students in the area of mathematics. By 1998 a grade 6
assessment in reading, writing, and mathematics was added. Full-census assessment of grade 9 students in mathematics was included in the EQAO’s repertoire in 2001 followed by the first Ontario Secondary School Literacy Test (OSSLT) which would be a high-stakes assessment for grade 10 students due to it being a graduation requirement in literacy (EQAO, 2012; Volante, 2007). Each of these assessment initiatives continue to the present day and educators have been involved in the development, administration and scoring of these assessments (EQAO,
28
2012).
Results of the EQAO assessments are reported to the province and shared with the public, school boards, principals, as well as individual students for progress monitoring and to show more effectively where the school system is succeeding in closing the gap between low and high achieving students (EQAO, 2012). Only recently as of 2012 however, has there been further support for administrators at the individual school level in making effective use of this assessment data to inform school planning. The new online EQAO Reporting application allows principals to create learning profile of their students and focus a whole-school response to data (Educational Quality and Accountability Office, 2012) Another recent development in Ontario has been a clear addition to the Student Achievement and School Board Governance Act (2009) outlining the roles of school boards, trustees, board chairs and directors of education in
improving student achievement through the use of EQO data (EQAO, 2012).
Despite some criticism of large-scale assessment initiatives (Alberta Teacher’s Association, 2005; Volante, 2007), Ontario educators seemed to be engaged in the DDDM process with the additional student data that has been provided through EQAO initiatives. In 2011, EQAO surveyed 3400 elementary school principals, 8500 grade 3 teachers and 7300 grade 6 teachers and found that:
• 96% of principals reported they use EQAO results and questionnaire data to guide school improvement planning
• 96% of principals reported they use EQAO data to identify specific program strengths and weaknesses
29
• 82% of grade 3 and 80% of grade 6 teachers said they use EQAO data to identify areas of program strength and weakness in reading, writing and math
• 80% of grade 3 and 78% of grade 6 teachers reported using the data to identify how well students are meeting curricular expectations (Educational Quality and
Accountability Office, 2012)
Time will tell whether or not educational professionals in Saskatchewan will find provincial assessment initiatives as valuable in informing educational programming.
Saskatchewan. Recently, the province of Saskatchewan has taken a similar approach to
that of the Alberta model in using data to influence decision making to provide transparency through accountability measures. Though teachers have always been responsible for assessing and reporting student growth and achievement, and using classroom-based assessment data to inform instructional practices (Saskatchewan Education, 1991), in recent years more formal use of standardized testing has been at the forefront of conversations regarding accountability measures for education in Saskatchewan (Government of Saskatchewan 2013a; Government of Saskatchewan, 2013b; Spooner & Orlowski, 2013).
Over the past few years educational conversation in Saskatchewan have focused on increased accountability measures, specifically in the areas of elementary reading scores, increased graduation rates, and closing the achievement gap for First Nations, Inuit and Métis students (Government of Saskatchewan, 2013a; Government of Saskatchewan, 2013b).
Recently, the Saskatchewan Ministry of Education has come out with a plan for 2013-2014 in response to the government’s Saskatchewan Plan for Growth: Vision 2020 and Beyond.
30
Though these priorities were formulated roughly a decade ago, in the plan for 2013-2014, Education Minister, Marchuk formally shared the upcoming direction for educational planning and goals which included:
• supporting higher achievement of First Nations, Métis, and Inuit (FNMI) and non-FNMI PreK-12 students and improved literacy and numeracy of all learners;
• providing equitable opportunities for all learners regardless of where they live or their personal circumstances;
• supporting smooth transitions of all early learning to Grade 12 learners throughout the course of their education;
• supporting strong system-wide accountability for governance; And
• enhancing facilities within the Minister’s mandate, and improve the effectiveness and efficiency of the Ministry’s programs and services (Government of
Saskatchewan, 2013a).
Under these goals, the Ministry lists key actions expected to take place. The list is extensive, but some actions of note specifically involving academic achievement and data-driven decision making in schools include:
• working toward ensuring Saskatchewan leads the country in graduation rates, and reducing the disparity in graduation rates between First Nations, Inuit and Métis students and non-First Nations, Inuit and Métis by 2020;
• releasing the Comprehensive Policy on Assessment in Early Years Programs and Pre-K-12 Education to guide the Ministry in assessment;
31
• begin implementation of the Early Years Evaluation (EYE);
• begin implementation of the Tell Them From Me (TTFM) survey to measure student engagement;
• begin developing provincial assessments in grades 4 through 11; And
• develop a work plan to increase the number of grade 3 students performing numeracy at grade level and increase the number of grade 3 students reading at grade level by 20% by 2015 (Government of Saskatchewan, 2013a).
We see through this report the Government of Saskatchewan is looking closely at data-driven measures to increase student achievement and will be expecting schools to collect data, report them, and use them effectively in order to track and reach these educational goals. Of note, the Saskatchewan government has not included a plan for high-stakes testing models as seen in Ontario, Alberta and U.S. assessment practices.
These high-stakes assessment practices often experienced by high school students in other districts have often been criticised as having a negative impact on student achievement. For example, Kane (2002) found that low achieving students were 25% more likely to drop out of high school in districts that employ graduation tests versus districts that do not. In addition, the Alberta Teacher’s Association (2005) has argued a decreased trend in students entering postsecondary schooling can be attributed to the unintended result of their accountability systems’ over-emphasis on high test scores.
Though the early stages of Saskatchewan’s assessment and accountability measures reform does not include some of the high-stakes testing we have seen in other provinces and countries, the assessment culture appears to be changing in our own province as well. The
32
Government of Saskatchewan’s Vision 2020 goals were discussed briefly in the examination of DDDM in medicine earlier in this chapter. To follow is a more detailed description of how these goals have influenced the contemporary educational context in Saskatchewan.
Saskatchewan’s Education Sector Strategic Plan. In April, 2014 Education Minister Don Morgan and the President of the Saskatchewan School Boards Association (SSBA) publicly announced a formal Education Sector Strategic Plan (ESSP) for the province of Saskatchewan. This plan was approved and accepted by all 28 school boards in Saskatchewan and the
provincial governments as a plan for education in the province to move ahead in achieving the province’s Vision 2020 goals. Specifically this plan prioritizes goals and action plans for student success in the areas of reading and First Nations and Métis learning outcomes (Government of Saskatchewan, 2014a). At the time of this study, there are future aspirations for the ESSP to direct ministry and school district work to develop regional plans to attain these goals in each school district (Government of Saskatchewan, 2014a).
In 2014 Saskatchewan saw the ESSP as the provincial education focus that would move toward the realisation of the Vision 2020 goals over a six year period (Government of
Saskatchewan, 2014b). The ministry identified two areas for “breakthrough improvements” in 2014-2015:
• to identify and implement a unified set of provincial high-impact reading assessment, instruction and intervention strategies; And
• develop a First Nations, Inuit and Métis (FNIM) student achievement initiative (Government of Saskatchewan, 2014b).
33
In addition to these goals, specific goals were identified moving into further years of the plan. These include:
• By June 2020, 80% of students will be at grade level or above in reading, writing and math
• by June 2020, collaboration between FNIM and non-FNIM partners will result in significant improvement in the achievement and graduation rates of FNIM students
• by 2020, Saskatchewan’s graduation rate will be 85% (measured by on-time graduation rates from statistics Canada); And
• by June 2020, 90% of students exiting kindergarten will score within the
appropriate range in 4 or the 5 domains as measured by the Early Years Evaluation (EYE) (Government of Saskatchewan, 2014b).
To work toward the achievement of these goals by 2020, the ESSP included specific actions. Table 1below describes the action plans outlined to reach the above mentioned Vision 2020 goals (Government of Saskatchewan, 2014b).
34 Table 1
Government of Saskatchewan Action Plan for Education
Goal Action Plan
1. By June 2020, 80% of students will be at grade level or above in reading, writing and math
Identify and implement a unified set of provincial high-impact reading assessment, instruction and intervention strategies:
• Develop consistent administration, collation, and reporting practices across all school divisions, and collect baseline data on reading levels of all Grade 3 students.
• Develop and distribute an instructional practices model (K-12) for reading to support students reading at or above grade level.
• Develop a sector reading strategy for best practice in reading, including instructional strategies, assessment and intervention for implementation in grades 1-3.
• Create provincial and school division reading literacy teams for grades 1-3 to: • identify needs within school divisions;
• provide professional development in school divisions as needed; and,
• provide resources needed to support models for learning such as literacy coaches.
• Initiate formal discussions with teachers and post-secondary institutions to establish a partnership to examine teacher
• training programs. 2. by June 2020,
collaboration between FNIM and non-FNIM partners will result in significant
improvement in the achievement and graduation rates of FNIM students
In partnership with FNM stakeholders, develop a FNM student achievement initiative:
• Engage First Nations and Métis leaders to develop partnerships and plans in order to increase achievement and graduation rates of First Nations, Métis and Inuit/Inuk (FNMI) students.
• Develop a governance model and transition plan to support development of the FNM student achievement initiative.
• Determine the applicability to Saskatchewan of an indigenous education model that has demonstrated exceptional success in increasing student engagement, achievement and graduation rates in that country.
• Establish a professional development program to support teachers in culturally responsive pedagogy.
• Provide professional development to support in-school and system-based leaders.
• Continue development of outcomes-based curricula that supports student learning and provides direction to teachers.
• Work with teachers and school divisions to develop a plan for curriculum, instruction and evaluation that is linked to sector priorities.
3. By 2020, Saskatchewan’s graduation rate will be 85%
• Review provincial high school graduation requirements and develop alternate pathways and supports to graduation that include increased opportunities such as off campus education, credit/outcome recovery, and hands-on learning.
• Develop a MyBlueprint database, to be used by students entering Grade 9 to develop a ‘graduation and transition from high school plan’, and test the database at pilot sites in preparation for a provincial roll out in 2015-16.
• Analyze data regarding transition of students between grades 7 and 10 and develop a middle years transition action plan for improvement
4. By June 2020, 90% of students exiting kindergarten will score within the appropriate range in 4 or the 5 domains as measured by the Early Years
Evaluation
• Review provincial high school graduation requirements and develop alternate pathways and supports to graduation that include increased opportunities such as off campus education, credit/outcome recovery, and hands-on learning.
• Develop a MyBlueprint database, to be used by students entering Grade 9 to develop a ‘graduation and transition from high school plan’, and test the database at pilot sites in preparation for a provincial roll out in 2015-16.
• Analyze data regarding transition of students between grades 7 and 10 and develop a middle years transition action plan for improvement
35
Much like the Lean medical model discussed earlier in this chapter, the ESSP has been set to follow the strategic planning guidelines of the Japanese Hoshin Kanri framework.
The Hoshin Kanri framework implies that the process of determining targets, the development of means to achieve the targets, and the deployment of both are crucial for success (Tennant & Roberts, 2001). This framework involves a “catchball” process that involves continuous communication and collaboration to ensure the development of appropriate targets and their deployment at all levels of the organization (Tennant & Roberts, 2001). Though the Government of Saskatchewan and its 28 school boards have not yet communicated a
formalized plan of how this “catchball” process might look in relation to the ESSP in
Saskatchewan, it has been made clear that school divisions are to be using the Hoshin Kanri model in creating and implementing both long term and short term district-level and school-level strategic plans for student learning (Government of Saskatchewan, 2013c). These plans are to be created using the Hoshin Kanri the A3 format.
Though the ESSP is in its early stages and it is yet to be seen how formally the province will measure, report, and hold school districts accountable for these goals, it is clear the Saskatchewan Government is moving toward a more formal approach to using student
achievement data to drive decision making at both the provincial and school district level. The province’s Vision 2020 goals and the ESSP have set the tone for expectations of data-driven decision making in Saskatchewan schools.
36
Critique of Data-Driven Decision Making Practices
Though certain data-driven assessment practices have shown to yield strongly positive outcomes for student learning and achievement (Black & Wiliam, 2009; Hattie, 2009; King & Amon, 2008), often DDDM processes which rely most heavily on large-scale or standardized assessments have been critiqued in educational literature. At times data-driven practices have overwhelmed teachers with statistics and test scores to the point where the data is
ineffectively used (Sharrat & Fullan, 2012). This is especially true when the task of finding standardized measures that accurately measure specific learning achievement is difficult at best (Mandinach & Honey, 2008). Some researchers have even attested that large-scale
assessments, especially when considered to be high-stakes, can even have a negative impact on student learning and achievement (Kane, 2002; King & Amon, 2008). To follow is jus