Page 1
2020-2021
Program Assessment Report Guide
Submission Deadline: October 31, 2020
to [email protected]
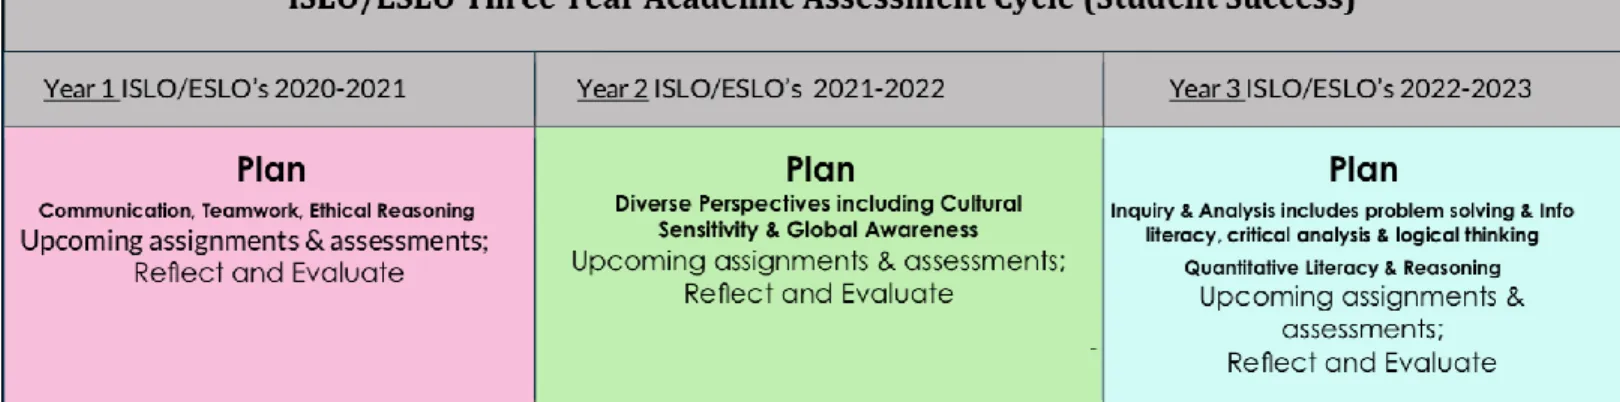
This guide will show Assessment Coordinators, Faculty, Chairs and Deans the process of program assessment for 2020-2021, including descriptions, examples and rubric measures for the annual program assessment report. Follow the guide description text in black while referencing the example text in blue and the rubric text in gray. This guide has changes to move our institution into alignment with the new NWCCU standards.Academic Assessment: Three Year Cycle
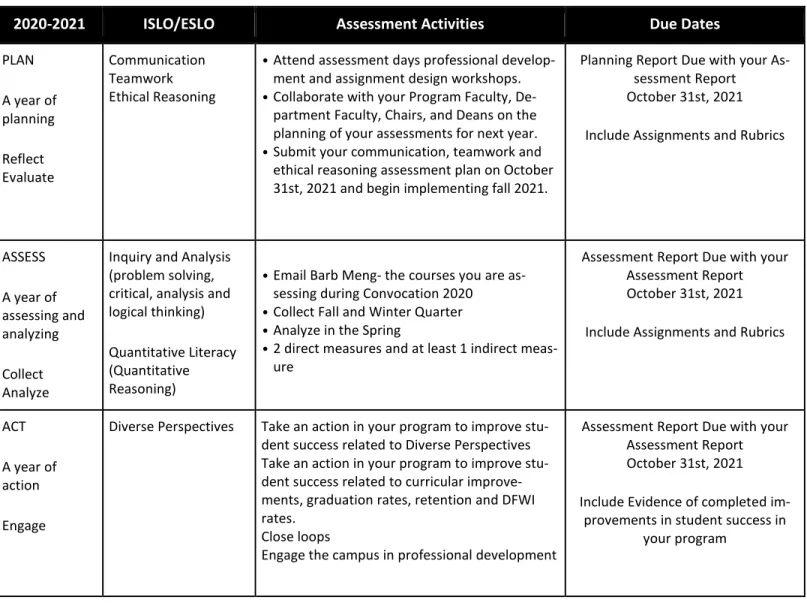
2020-2021 Plan, Assess and Act
2020-2021 ISLO/ESLO Assessment Activities Due Dates
PLAN A year of planning Reflect Evaluate Communication Teamwork Ethical Reasoning
• Attend assessment days professional develop-ment and assigndevelop-ment design workshops. • Collaborate with your Program Faculty,
De-partment Faculty, Chairs, and Deans on the planning of your assessments for next year. • Submit your communication, teamwork and
ethical reasoning assessment plan on October 31st, 2021 and begin implementing fall 2021.
Planning Report Due with your As-sessment Report October 31st, 2021 Include Assignments and Rubrics
ASSESS A year of assessing and analyzing Collect Analyze
Inquiry and Analysis (problem solving, critical, analysis and logical thinking) Quantitative Literacy (Quantitative Reasoning)
• Email Barb Meng- the courses you are as-sessing during Convocation 2020 • Collect Fall and Winter Quarter • Analyze in the Spring
• 2 direct measures and at least 1 indirect meas-ure
Assessment Report Due with your Assessment Report October 31st, 2021 Include Assignments and Rubrics
ACT A year of action Engage
Diverse Perspectives Take an action in your program to improve stu-dent success related to Diverse Perspectives Take an action in your program to improve stu-dent success related to curricular improve-ments, graduation rates, retention and DFWI rates.
Close loops
Engage the campus in professional development
Assessment Report Due with your Assessment Report October 31st, 2021 Include Evidence of completed
im-provements in student success in your program
Page 3
Planning Section
Additional Instructions
Planning at Convocation 2020
a. Put Program Learning Outcomes on a 3-year cycle
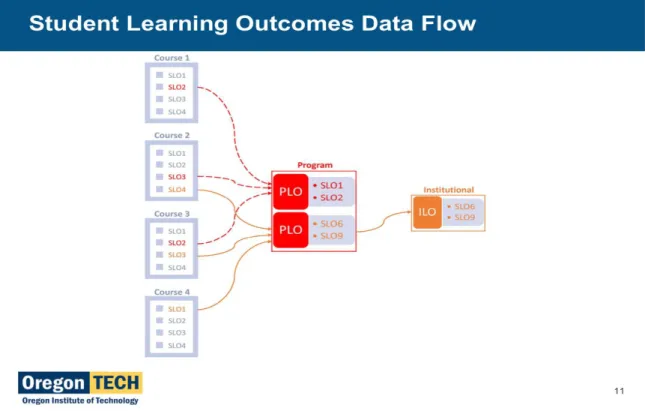
b. Create a Learning Outcomes Alignment Map to identify the courses that support this year’s program learning outcomes and institutional learning outcomes (figure 4 below).
c. Include all Learning Outcomes on a Syllabi
d. Pick your courses, assignments and rubrics for Inquiry & Analysis plus Quantitative Reasoning. Email those choices to Barb Meng by the end of convocation week and begin collection.
Figure 4: CLO alignment map to PLOs and ISLO/ESLO’s Winter Term
a. Submit your PLOs to your Dept. Chair to be make the deadline for the catalog so they appear in the catalog next year.
Planning Every Quarter
a. Fill out course worksheet at the end of the term when you submit grades for only those courses that align in support of this year’s PLOs and ISLO/ESLO (see figure 5).
Completed every quarter on any class that supports a PSLO and ISLO/ESLO
Figure #5: Tech Web: Course Learning Worksheet (only on courses that support PLOs and ISLO/ESLOs for this year.
Page 5
Equity Gap Dashboards
https://www.oit.edu/faculty-staff/institutional-research/dashboards
(Access restricted to chairs, deans and pilot programs only-will be opened to all faculty at Convocation 2020)
Retention
Tracks retention of new degree seeking stu-dents over 4 terms (figure 6)
Graduation and Persistence
Tracks persistence and completion of new de-gree seeking students (figure 7)
DFWI (D Grade, Fail, Withdraw & Incomplete)
OIT Dashboards
Equity Gap Dashboards Reflection Questions (Due October 31st 2021)
1. Retention Dashboard: What is the retention rate for all students in your program? How do retention rates compare across gender, racial groups, for first-generation students, and for low socio-economic students (Pell grant eligible)? What opportunities did the comparative data create for improvement? What actions do you plan to take to improve retention rates in your program this coming year?
2. Graduation Dashboard: What is the graduation rate for all students in your program? How do retention rates com-pare across gender, racial groups, for first-generation students, and for low socio-economic students (Pell grant eligi-ble)? How do you plan to improve graduation rates in your program this coming year?
3. Student Success Dashboard: List courses with DFWI rates greater than 20% and include disaggregated data across gender, across all racial groups, for first-generation students, and for low socio-economic students (Pell Grant eligible)? What are the gatekeeper courses in your program? How do you plan to improve (strategies) the DFWI rates in courses in your program this coming quarter/year?
4. After looking at the disaggregated data from all three dashboards, list the top three equity gaps that the data show in your program and briefly discuss plans (strategies) to try to close them?
5. What feedback do you have for the Assessment Office to improve the dashboards and reflection questions? DFWI D = D Grade F = Fail W = Withdraw I = Incomplete
Continuous improvement evidence collection
Program Reflections Questions on your past year improvements
1. What changes and improvements overall did you make in your program last year and why?
2. What changes in budget or resource allocations did you make in your program last year and why (i.e. new faculty, new equipment, etc.)?
3. What curriculum changes did you do in your program this last year and why?
4. What improvements do you plan this next year that will impact job success, curriculum improvements, even better alignment with industry needs and resource allocations? What data do you need to collect this next year to help support the improvements you want for your program?
Page 7
Academic Assessment
Section 1 – Program Mission and Educational Objectives
NWCCU’s standards for accreditation require that institutions offer “programs with appropriate content and rigor that are consistent with its mission” (1.C.1.)
In this section, address the following:
• Program Mission: What is the purpose of the degree program? What professional and lifelong opportunities does it prepare students for? Where is it anticipated that graduates end up – both immediately after graduation and 5-10 years out?
• Mission Alignment: How is the program’s mission aligned with the university mission to offer “innovative, pro-fessionally focused undergraduate and graduate degree programs,” providing a “hands-on, project-based learn-ing environment.”
[Note: In the past, we have asked programs to articulate distinct mission and educational objectives. Programs are wel-come to keep these, but we are no longer requiring each as a separate entity. Instead, we encourage you to focus your mission and objectives statement on the sorts of professional and life experiences that your degree program prepares students for.]
See also:
• Section 1 Rubric (below)
Section 2 – Program Description and History
This content will stay fairly static from year to year, and can be included in any reasonable order, but program enroll-ment, graduate, and employenroll-ment, and (if applicable) board pass rates should be updated each year based on updated data.
In this section, provide an overview of your program, including information such as: • Program History
• Program Locations • Program Enrollment • Program Graduates
• Employment Rates and Salaries
• Board and Licensure Exam Results (if applicable) • Industry Relationships
• Showcase Significant Learning Experiences – Particularly those that align with Oregon Tech’s mission to deliver a
“Hands-On, project-based learning environment” and “innovative, professionally-focused programs”
• Success Stories – Descriptions of successful graduates (potentially including quotes from students highlight the programs' effective preparation)
• Program Changes – What recent changes have occurred within the program (e.g. new faculty, new facilities, cur-riculum changes)
See also:
• Section 2 Template (below)
• B.S. Environmental Sciences, 2017-2018; • B.S., Medical Laboratory Science, 2017-2018
Section 3 – Program Student Learning Outcomes
NWCCU’s standards for accreditation require that programs must “culminate in achievement of clearly identified stu-dent learning outcomes.” (1.C.1.)
In this section, address the following:
• PSLOs: What are the 5-10 program student learning outcomes – the key skills, supported and scaffolded across the program, which graduates will need to be able to demonstrate by graduation in order to successfully pursue the professional directions described the program’s mission statement?
• Resources on Bloom’s Taxonomy: http://oregonstate.edu/instruct/coursedev/models/id/taxonomy/#table • Resources on program student learning outcomes:
o https://manoa.hawaii.edu/assessment/howto/outcomes.htm
o https://www.jmu.edu/assessment/_files/How%20to%20Write%20Clear%20Objectives.pdf o https://www.jmu.edu/assessment/_files/Objectives%20Made%20Easy.pdf
• Origin and External Validation: Content and learning outcomes need annual review by other content experts to stay current.
• Changes: Put Program Learning Outcomes on a three year cycle.
• Clearly Written Language: Make sure Program Learning Outcomes and course learning outcomes are written clearly so students know what skill they are trying to master.
• Complete Tech Web Course Learning Outcomes Worksheet (see planning on page 4)
See also:
• Section 3 rubric (below)
• B.S. Civil Engineering, 2017-2018
Section 4 – Curriculum Map
NWCCU’s standards for accreditation requires that programs must demonstrate “an appropriate breadth, depth, se-quencing, and synthesis of learning” of student learning outcomes. (1.C.2)
• Curriculum Map: How are each of your program student learning outcomes (and institutional ESLO’s) supported and scaffolded throughout the program’s curriculum?
Page 9
This content should remain relatively static from year to year, but should be updated as the program curriculum map changes.
See also:
• Section 4 rubric (below) • Section 4 template (below)
• B.S., Medical Laboratory Science, 2017-2018
• B.S. Civil Engineering, 2017-2018 Section 5 – Assessment Cycle
In this section, please complete a table to show which courses (and, where known, what assignments) are used to assess each PSLO and ESLO in a three-year cycle. (Although some programs may have compelling reasons to adopt a different cycle, assessment of program learning outcomes should follow a three-year cycle, with the intention that improvements prompted by one year’s assessment should be designed and implemented during the two years prior to the next sched-uled assessment of that outcome.)
Each PSLO should be assessed with 2 direct measures and 1 indirect measure (the indirect measure is often the Student Exit Survey, which asks graduating students about each PSLO each year).
This content should remain relatively static from year to year, although it should be extended by at least one year (and the old year dropped off) each time a new report is submitted.
See also:
• Section 5 rubric (below) • Section 5 template (below)
• B.S., Medical Laboratory Science, 2017-2018 Section 6 – Assessment Activity
NWCCU’s standards for accreditation require that institutions engage in “an effective system of assessment to evaluate the quality of learning in its programs” that “recognizes the central role of faculty in establishing quality, assessing stu-dent learning, and improving instructional programs.” (1.C.5.)
In this section, address the following for each assessment activity conducted during the academic year covered by the report. This section may be integrated with Section 7 (Action Plans) and 8 (Re-assessment) as appropriate:
• Activity: What is the activity – (for a direct assessment, typically the course assignment) – used to assess this outcome? Describe in enough detail to make it clear how the activity is a reasonable measure of the outcome, and attach the assignment as an appendix. (Archiving the assignment is critical for consistent reassessment.)
• Rubric: How is the activity to be scored/evaluated? (Especially if scoring to assess the outcome is different from course grading). Describe in enough detail to makes it clear the rubric or scoring approach is a reasonable way to assess the outcome. Where a rubric is used, attach the rubric as an appendix. (Archiving the rubric is critical for consistent reassessment.)
• Sample: How many student artifacts were assessed? Was the population representative of the program as a whole? Were there any special or unusual characteristics of the student population that should be noted?
• Reliability: Who was involved in the scoring? How was consistency of rubric use assured? Have multiple faculty been involved in the scoring process to ensure reliability of the data? (Involving multiple raters for reliability is a best practice requested by NWCCU.)
• Multiple Sites: How is comparable assessment of this outcome carried out across all program sites? Although assessment processes do not need to be identical between different sites, the same measures should be as-sessed in comparable ways that facilitate exchange of ideas between program faculty at different sites.
• Performance Target: What was the target performance level? If less than 100%, why was the target perfor-mance level set at that point?
• Performance Level: What are the summary results? (i.e. What is the distribution of rubric scores?) What per-centage of students exceeded the performance target?
• History of Results: Is there data from the previous assessment of this outcome, particularly if conducted with comparable methods? What trend(s) are seen in student performance over time?
• Faculty Discussion: How and when were results presented to and discussed by program faculty?
• Interpretation: What meaning or take-aways can be gleaned from this data? What are the factors, such as as-signment design, course context, instructor, etc., that may have impacted student performance, either positively or negatively?
See also:
• Section 6 rubric (below) • Section 6 template (below)
• B.S., Electronics Engineering Technology, 2017-2018; • B.S., Applied Mathematics, 2017-2018
Page 11
Section 7 – Data-driven Action Plans: Changes Resulting from Assessment
NWCCU’s standards for accreditation require that institutions “uses the results of its assessment efforts to inform aca-demic and learning support planning and practices.” (1.C.7.)
Every program should, based on assessment data, identify at least one area to focus on for improvement stemming from assessment results. Performance is below target threshold should also trigger action.
In this section, address the following for each improvement activity sparked by assessment data: • Action Driver: What assessment data prompted or supports action?
• Action Specifics: Is the needed action an improvement in instruction or in assessment? What improvement ac-tion is planned? How do you anticipate it will address the specific deficiencies found in assessment data? • Accountability: What course, activities, or assignments will changes take place in? Who (specific names) will be
responsible for implementation of these actions? When will these changes be implemented?
• Planning and Budgeting: What financial or resource needs will be require for implementation of these changes? How will they be sought or provided?
• Improvements in Assessment Process: What improvements are needed to the assessment process? How will they yield better, more actionable information?
• Reassessment: When will this outcome or measure be re-assessed, to determine if these changes have resulted in improved performance?
See also:
• Section 7 rubric (below)
• B.S., Applied Mathematics, 2016-2017 (page 6)
Section 8 – Closing the Loop: Evidence of Improvement in Student Learning
NWCCU’s standards for accreditation require that institutions provide evidence of “continuous improvement of student
learning.” (1.C.7.)
If this is an outcome being assessed following improvement activity, did you have past results from this outcome? If this is a specifically scheduled “closing the loop” assessment, how do this year’s results compare with the results that
prompted improvements?
Did you have past action plans? Can you say that data supports that those plans resulted in improvements?
Look backwards: Discuss the last time that outcome was assessed. • Were changes recommended?
• Were those changes implemented? • If so, was improvement seen? See also:
EXAMPLE TEMPLATE, Section 2: (Format is not mandatory, but is meant for guidance. Choose the approach that works for your program).
Program History
The Vascular Technology Program officially began in 1992 and is one of the five current on-campus Medical Imaging programs at Oregon Institute of Technology. Enrollment trends from 2002 – 2016 have varied from 50 to 89 students per year in the program. By fall term of 2016, there were 50 students enrolled in the program. For the class of 2016, retention was 70.0% and attrition was 30%.
Program Location: Klamath Falls Campus only. Program Enrollment:
Fall 2012 Fall 2013 Fall 2014 Fall 2015 Fall 2016 5 Year Difference 5 Year % Change
88 95 80 93 98 10 11.4%
Program Graduates:
2006-07 2007-08 2008-09 2009-10 2010-11 2011-12 2012-13 2013-14 2014-15 2015-16
30 30 26 23 23 25 21 28 19 24
Employment Rates and Salaries:
Employed Continuing Education Looking for Work Not Seeking Median Salary Success Rate
39 0 4 0 $62,000 91%
Board and Licensure Exam Results (if applicable):
American Registry of Diagnostic Medical Sonographers Vascular Technology
Page 13
EXAMPLE TEMPLATE, Section 4: (Format is not mandatory, but is meant for guidance. Choose the approach that works for your program).
Civil Engineering B.S. Student Learning Outcomes Table F – Foundation P – Practice C – Capstone COURSE PS L O 1 PS L O 2 P SL O 3 ES LO 1 - C om m un ica ti on E SL O 2 – Inqui ry & A naly si s E SL O 3 – E thi cal R eas on ing E SL O 4 – Q uan ti tat ive L it er a cy E SL O 5 - T ea m w ork E SL O 6 – D ive rs e P er sp ec ti ve s MATH 111 F WRI 121 F F SPE 111 P F ENGR 101 P CIV 100 P
EXAMPLE TEMPLATE, Section 5: (Format is not mandatory, but is meant for guidance. Choose the approach that works for your program).
Civil Engineering B.S. Cycle for PSLOs and ESLOs
Outcome 2017-18 2018-19 2019-20 PSLO 1 Direct CIV 100
Direct CIV 105
Indirect Student Exit Survey
PSLO 2 Direct CIV 100 Direct CIV 105
Indirect Student Exit Survey
PSLO 3 Direct CIV 100
Direct CIV 105
Indirect Student Exit Survey ESLO 1 Direct CIV 100
Direct CIV 105
Indirect Student Exit Survey
ESLO 2 Direct CIV 100 Direct CIV 105
Indirect Student Exit Survey ESLO 3
ESLO 4 ESLO 5 ESLO 6
Page 15
EXAMPLE TEMPLATE, Section 6: (Format is not mandatory, but is meant for guidance. Choose the approach that works for your program).
PSLO 1: Klamath Falls Campus, CIV 100, 201701, Seth Anthony PSLO 1: An ability to apply knowledge of mathematics, science, and engineering.
Performance Criteria Assessment Methods Measurement Scale
Performance Target Results
Demonstrates
knowledge of the pro-fessional code of eth-ics.
Ethics assignment in CHE260 evaluated by course instructor using Oregon Tech's Ethics Rubric (attached as appendix A) 1-4 according to attached criteria 75% of students scor-ing 3 or higher 75% more than 3 75% = 4
Describes ethical issue using code of ethics
Ethics assignment evaluated by course instructor using Ore-gon Tech's Ethics Ru-bric. 1-4 according to attached criteria 75% of students scor-ing 3 or higher 100% more than 3 50% = 4
OREGON TECH PROGRAM ASSESSMENT REPORT RUBRIC (Section 1)
1 – Beginning 2 – Developing 3 – Good 4 – Exemplary
Program Mission/Mission Alignment No mission statement or
educational objectives are included.
Mission statement and ob-jectives are vague, unclear, or lack coherence. They are too general too general to distinguish it from other programs or are focused on the department rather than the program.
Mission statements and objectives identify the pro-grams purpose, but needs some development. The statement might not be fo-cused on learners as the primary stakeholders.
Well-developed mission statements and objective outlines why the program exists and what distin-guishes it from other units or programs. The wording of the statement is focused on learners as the primary stakeholders and is clear to a general audience.
OREGON TECH PROGRAM ASSESSMENT REPORT RUBRIC (Section 3)
1 – Beginning 2 – Developing 3 – Good 4 – Exemplary
PSLOs No outcomes stated. Outcomes present, but
with non-measurable verbs (e.g., know, understand; things internal to the stu-dent), vague description of content/skill/or attitudinal domain, or outcomes aren’t student-centered.
Outcomes generally con-tain precise and measura-ble verbs with rich descrip-tion of the content/skill/or attitudinal domain. Out-comes describe how stu-dents demonstrate learn-ing.
All outcomes are stated in student centered terms (i.e. “Students will…”) with precise and measurable verbs (for example, from Bloom's taxonomy) articu-lating how students demonstrate learning, with rich description of the con-tent/skill/or attitudinal do-main.
Origin and External Validation No discussion of external
validation of outcomes.
At a superficial level, it ap-pears the learning out-comes are aligned with in-dustry needs, but no expla-nation is provided.
General detail about how outcomes relate to industry needs or are externally vali-dated is provided, but lacks detail or specificity. Little to no evidence of recent dis-cussions (either internally or with external partners) about the currency of pro-gram learning outcomes.
External validation of out-comes is clearly articulated, through reference to out-comes originating from ex-ternal accreditors, industry advisory boards, employer surveys, etc.. Evidence of recent program and exter-nal discussions about the continued relevance of learning outcomes.
Page 17
OREGON TECH PROGRAM ASSESSMENT REPORT RUBRIC (Section 4)
1 – Beginning 2 – Developing 3 – Good 4 – Exemplary
Curriculum Map: Scaffolding No alignment of curriculum
to outcomes.
Report contains a curricu-lum map connecting stu-dent experiences with some outcomes. Map is not clear or difficult to inter-pret.
Report contains a curricu-lum map clearly illustrating how each outcome is sup-ported within the curricu-lum.
Report contains a curricu-lum map illustrating how the curriculum as a whole supports scaffolded, devel-opment (e.g., introduction, development, mastery) of each outcome for both pro-gram outcomes (PSLOs) and institutional outcomes (ESLOs).
Curriculum Map: Detail of Alignment Program doesn't
demon-strate alignment of course activity with program learning outcomes.
Program asserts that course activity for at least some outcomes is at least somewhat aligned with program outcomes and points to some evidence to support this.
Program points to some level of detail about course activities (for instance, identifying an assignment by name) for each outcome that indicate meaningful and regular attention to program outcomes in course design.
Program points to publicly available materials (e.g. course syllabi, assignments, unit learning outcomes, class materials) which demonstrate thorough and consistent alignment in all course of relationships be-tween course activity and program learning out-comes.
OREGON TECH PROGRAM ASSESSMENT REPORT RUBRIC (Section 5)
1 – Beginning 2 – Developing 3 – Good 4 – Exemplary
Assessment Cycle: Current Year No activities/ courses listed
for outcomes assessed dur-ing the current year
Activities/courses listed but link to outcomes is absent.
Most outcomes have clas-ses and/or activities linked to them.
All outcomes assessed dur-ing the report year have classes (or activities) linked to them.
Assessment Cycle: 2 Direct, 1 Indirect No measures indicated Most objectives are not
as-sessed via direct measures (only with indirect
measures).
Most objectives assessed with at least one direct measure and one indirect measure.
All objectives assessed us-ing at least two direct measures (e.g., tests, es-says) and one indirect measure.
Assessment Cycle: Multiple Years No formal assessment plan
beyond current year.
Report contains a multi-year cycle outlining when assessment of all program student learning outcomes will occur.
Report contains a multi-year plan for assessment of learning outcomes, with courses identified for all as-sessment activities.
Clear, multi-year plan with several years of implemen-tation (both past and fu-ture) outlined and clearly connected, with identifica-tion of courses (or activities where) assessment will oc-cur. Plan extends out at least far as the next assess-ment of any outcomes as-sessed during the report year.
Page 19
OREGON TECH PROGRAM ASSESSMENT REPORT RUBRIC (Section 6)
1 – Beginning 2 – Developing 3 – Good 4 – Exemplary
Activity: Valid relationship between outcomes and assignment Seemingly no relationship
between outcomes and as-signment.
At a superficial level (e.g. based on the assignment ti-tle), it appears the assign-ment assessed by the measures matches the out-comes, but no explanation is provided.
General detail about how outcomes relate to assign-ment is provided. For exam-ple, the faculty wrote items to match the outcomes, or the assignment was se-lected “because its general description appeared to match our outcomes.”
Narrative describes assign-ment and its alignassign-ment with outcomes, including provid-ing the assignment in an ap-pendix. Assignment appears to be a natural feature of the course and not inserted arbitrarily. Report describes assignment (including fit with class context) in suffi-cient detail to see that it is a natural feature of the course (not inserted arbi-trarily) and is a reasonable way to assess that out-comes.
Rubric: Valid relationship between outcomes and rubric Seemingly no relationship
between outcomes and ru-bric. (No indication of rubric being used.)
At a superficial level (such as based on a listing of ru-bric criteria), it appears that an appropriate rubric is used to assess the out-comes, but no explanation is provided.
Rubric and description re-port doesn't fully justify the appropriateness of the ru-bric to evaluation of the outcome; or rubric is miss-ing detailed performance criteria (e.g. is just 1-4 rat-ings for each criteria). Ru-bric appears largely discon-nected from student evalu-ation and feedback.
Rubric is provided and shows clear alignment be-tween outcome and rubric criteria and elements. De-tail provided regarding out-come-to-rubric alignment. Rubric or variant of rubric is used to provide feedback to students (isn't totally dis-joint from class goals and feedback).
Sample: Data collection and research design No information is provided
about data collection pro-cess or data not collected.
Limited information is pro-vided about data collection such as how many students took the assessment, but not enough to judge the ve-racity of the process.
Enough information is pro-vided to understand the data collection process, such as a description of the sample size, course condi-tions (student motivation to participate).
The data collection process is clearly explained (e.g. term, number of students), in sufficient detail to assure that student work reflects representative sampling and adequate student moti-vation.
Reliability No additional reliability
in-formation provided.
Report identifies process for scoring (e.g. identifies rater).
Multiple raters involved in scoring for at least some scores, or an externally vali-dated rubric used. Reports states how efforts have been made to ensure relia-bility (e.g., raters were trained on rubric; reported scores are average from multiple raters).
Reliability (inter-rater com-parisons) used for all scor-ing, with clear evidence of both internal agreements. Or, externally validated ru-bric used with trained scor-ers and inter-rater agree-ment. (Raw data provided in an appendix/attachment) Multiple Sites
No discussion of alignment of assessment processes across sites.
Report includes data from all sites where the program is offered.
Reports includes data from approximately comparable assessment activity for each outcome from all sites where the program is of-fered.
Similar measures are used at all multiple sites/modes where program is offered. Differences in methodology between sites are clearly justified. [Or: Program is only at one site/mode.] Performance Targets
No desired results for ob-jectives stated.
Statement of desired result in qualitative terms (e.g., comparison to previous year’s data), but no fixed target (e.g., students will perform better than last year).
Desired result specified quantitatively (e.g. 80% of our students will score a "Proficient" or "Highly Profi-cient" on rubric). Desired result is not justified. (“Gathering baseline data” is acceptable for this rat-ing.)
Desired result specified AND justified (e.g., "Last year the typical student scored 20 points on meas-ure x. The current cohort underwent more extensive coursework in the area, so we hope that the average student scores 22 points or better.")
Performance Level: Presentation of Results No results presented Results are presented in
summary form with respect to performance criteria. (e.g. "Students perfor-mance met our criteria.")
Results are presented, and they directly relate to the objectives and the desired results for objectives (e.g. 78% of students scored "Proficient" or "Highly Profi-cient,"). Statistical analysis may or may not be present. Raw data is not provided.
Results are presented, and they directly relate to ob-jectives and the desired re-sults for objectives, are clearly presented, and were derived statistical analyses, as appropriate. Raw data is provided in attachments or appendices.
History of Results No results presented Only current year’s results
provided.
Past iteration(s) of results provided for some assess-ments in addition to current years.
Past iteration(s) of results provided for majority of as-sessments in addition to current years.
Page 21
Faculty Discussion No evidence of
communica-tion of results to faculty and others.
Results from assessment provided to limited number of faculty or communication process with program fac-ulty is unclear (not in minutes)
Results from assessment provided to all faculty, and mode and details of com-munication are clearly de-scribed.
Information provided to all program faculty, mode and details of communication clear (e.g. meeting dates, minutes, etc.). In addition, information shared with others such as advisory committees or other stake-holders.
Interpretation No interpretation
at-tempted
Limited narration of results. Interpretation attempted, but the interpretation does not refer back to the objec-tives or desired results of objectives, or interpreta-tions are not clearly sup-ported
Some narration of assess-ment analysis and results. Interpretation of results seem to be reasonable in-ferences given the objec-tives, desired results of ob-jectives, or limited method-ology or discussion (e.g. only reviewed by a single faculty member).
A complete and clear narra-tion and analysis of the as-sessment results. Interpre-tations of results seem rea-sonable. Multiple faculty are involved in interpreting results. Interpretation in-cludes discussion of con-text: how classes/activities might have affected results, whether positively or nega-tively.
OREGON TECH PROGRAM ASSESSMENT REPORT RUBRIC (Section 7)
Action Drivers1 – Beginning 2 – Developing 3 – Good 4 – Exemplary
No improvement plans are outlined.
Some areas where perfor-mance is below targets re-sults in plans to collect fur-ther data, program im-provements, or assessment improvements.
All areas where perfor-mance is lower than tar-gets result in either (1) plans to collect further data, (2) program improve-ments, or (3) assessment method improvements. [Or: no areas fall below performance thresholds.]
All areas where perfor-mance is lower than tar-gets result in either (1) plans to collect further data, (2) program improve-ments, or (3) assessment method improvements. Further opportunities for program improvement are identified, such as areas where targets are met but improvement is still possi-ble.
Action Specifics No mention of any
im-provements to specific ac-tivity or courses.
Examples of improvements documented, but they are poorly described, and the link between them and as-sessment findings is not clear.
Plans to improve) are docu-mented and directly re-lated to the findings of as-sessment. However, im-provements lack close ties with specific assessment findings, lack details, or are developed simply based on "best intuition" of program faculty.
Plans to make program, curricular, or course provements or plans to im-prove) are documented and clearly relate to find-ings of assessment (e.g. specific criteria that fall be-low desired performance levels). Improvements draw upon knowledge of best practices in the field to maximize likelihood of success and make sense in the context of a rational, vertically-designed curricu-lum.
Accountability No information is there on
how the modifications will be re-evaluated, when and by whom.
Incomplete information is included on implementa-tion timelines, responsible parties, and re-assessment plans.
Most information on imple-mentation plan is included (timeline, responsible par-ties, re-assessment sched-ule) is included.
All modifications include timeline for implementa-tion, names of responsible parties, and identify when re-assessment will occur (whether at the next time the outcome comes up in the assessment cycle or sooner).
Page 23
Planning and Budgeting No attempt at aligning
im-provement plans with plan-ning and budgeting pro-cesses. No recognition or discussion of resource needs to implement im-provement plan.
Minimal or vague attempt at integrating improvement plans and planning and budgeting processes. (Ac-knowledgment that re-sources may be required, but doesn't specify or quantify then.)
Meaningful attempt at in-tegrating improvement plans and planning and budgeting processes. Plan begins to quantify resource needs.
Improvement plan articu-lates needed resources and implementation plan ex-plicitly feeds in to planning and resource request pro-cesses (e.g. staffing, equip-ment, etc.).
Improvements in Assessment Process No recommendations in
improving the program as-sessment practices.
Some critical evaluation of past and current assess-ment practices, including acknowledgment of flows. Minimal or surface-level recommendations in im-proving the program as-sessment practices.
Critical evaluation of past and current assessment, in-cluding acknowledgement of flaws. Some evidence of recommendations for revi-sion improving the pro-gram assessment practices.
Critical and specific evalua-tion of past and current as-sessment, including recog-nition of flaws. Detailed recommendations for the improvement of the assess-ment practices in the pro-gram (changing methodol-ogy, collecting supplemen-tary data, etc.), drawing upon specific analysis of past flaws in and best prac-tices in assessment.
OREGON TECH PROGRAM ASSESSMENT REPORT RUBRIC (Section 8)
Closing the loop1 – Beginning 2 – Developing 3 – Good 4 – Exemplary
No evidence of assessment concerning data following past curricular or program-matic changes.
Some evidence is pre-sented to suggest improve-ment in student learning in response to program modi-fications. Evidence or im-provements are vague and/or not clearly pre-sented.
Evidence, from direct measures, suggesting learning curricular and/or pedagogical modifications, RE assessed, and found that student learning im-proved. Lack of clarity re-garding the interventions or methodological issues (unrepresentative sam-pling, concerns regarding student motivation, etc.) leave legitimate questions regarding the improvement interpretation.
Strong evidence, from di-rect measures, supporting substantive and/or peda-gogical modifications, RE-assessed, and found that student learning improved. The rationale and explana-tion of the modificaexplana-tions leading to the change are clearly laid out. The meth-odology is of sufficient strength that most reason-able alternative hypotheses can be ruled out (e.g., sam-pling concerns, validity is-sues with instrument or student motivation), and it is plausible to conclude that the improvement ac-tivity prompted improve-ment in student perfor-mance.
Communication Studies Assessment Report 2018-2019 1 Communication Studies Program Assessment Report
2018-2019
Contents
I. Communication Studies Program Mission and Educational Objectives ... 3 A. Program Mission ... 3 B. Mission Alignment ... 3 C. Additional Information ... 3 II. Program Description and History ... 4 III. Program History: AY 2014 to Present ... 4 A. Program Locations ... 4 B. Enrollment and Retention Trends ... 4 C. Program Graduates ... 5 D. Industry Relationships ... 5 E. Learning Experiences ... 5 F. Program Changes ... 5 IV. Program Education Objectives and Program Student Learning Outcomes (PSLOs) ... 5 A. Program Education Objectives ... 5 B. Program Student Learning Outcomes ... 6 C. Origin and External Validation ... 6 V. Curriculum Map ... 6 VI. Assessment Cycle of Student Learning Outcomes... 10 VII. Summary of 2018-2019 Assessment Activities ... 10 A. PSLO 6: Cultural Communication ... 11 1) Indirect Assessment: Student Exit Survey and Course Grades... 11 2) Direct Assessment: Performance in COM 106: Introduction to Communication
Research and Other Courses ... 12 3) Discussion: Cultural Communication ... 13 B. PSLO 7: Communicate ethically ... 13 1) Indirect Assessment: Student Exit Survey and Course Grades... 13 2) Direct Assessment: Performance in Related Courses ... 14 3) Coordinated Direct Assessment: Ethical Reasoning ESLO ... 14
4) Discussion: Communicate Ethically ... 15 C. PSLO 8: Demonstrate positive group communication exchanges ... 15 1) Indirect Assessment: Student Exit Survey and Course Grades... 15 2) Future Coordinated Direct Assessment: Teamwork ESLO ... 16 3) Discussion: Group Communication ... 17 VIII. Action Plan ... 17 A. AY 2019 ... 17 B. Ongoing ... 17 IX. Closing the Loop ... 17 A. AY 2017 Report: Longitudinal Tracking ... 17 B. Continuing Conversations ... 18 X. References ... 18 Appendix A: Ethical Reasoning ESLO Rubric ... 19 XI. Appendix B: Assessed Course Descriptions ... 20 A. COM 106: Introduction to Communication Research ... 20 B. COM 115: Introduction to Mass Communication ... 20 C. COM 205: Intercultural Communication ... 20 D. COM 248: Digital Media Production ... 20 E. COM 255: Communication Ethics ... 20 F. COM 325: Gender and Communication ... 20 XII. Appendix C: Direct Assessment Rating Scale ... 21 Table 1: Communication Studies B. S. Enrollment and Retention ... 4 Table 2: Preliminary Curriculum Map by PSLO and Course ... 10 Table 3: Communication Studies Assessment Cycle prior to AY 2018 ... 10 Table 5: Academic Performance in Critical-Thinking –Oriented Courses, Fall 2013 through Summer 2018 ... Error! Bookmark not defined. Table 6: Academic Performance in Communication-Theory –Oriented Courses .... Error! Bookmark not defined.
Communication Studies Assessment Report 2018-2019 3
I. Communication Studies Program Mission and Educational Objectives
A. Program Mission
The Communication Studies Program prepares students for the challenges of a society that is shaped by communication. As participants in the program, students develop and integrate knowledge, creativity, ethical practice, and skills. Students also examine and produce work in oral, written, and visual communication and practice skills in group and intercultural communication.
B. Mission Alignment
The Communication Studies degree typically culminates in an externship, offering students a chance to practice their target career with a current professional. Prior to that hands-on experience,
Communication courses offer a variety of open-ended projects and opportunities to engage with professional or public communities as objects of study for research (e.g. COM 326: Communication Research) or practice (e.g. COM 425/426: Mediation and Mediation Practicum).
As every student’s 36-credit focused sequence (see below) creates a unique degree program, innovation is a regular feature of the curriculum – students’ programs of study vary as much as the students themselves. AY 2018 saw the development of a new introductory-level Communication technologies course (COM 135) meant to support other Communication Studies courses and Business/Marketing courses many students take in their focused sequence. This course will be piloted in AY 2019, with initial artifacts collected for a longitudinal assessment across technology-oriented courses addressing COM PSLO 5.
C. Additional Information
The Communication Studies program fills a niche in the Human and Professional Communication world by offering students the opportunity to design a major particular to their career goals. All students are required to complete 36 credit hours in courses of their choosing, forming a Focused Sequence tailored to their individual professional goals. These courses may come from within the Communication department, but many students enroll in courses from Business, CSET, and Psychology to gain specific technical expertises in addition to the interpersonal communication knowledge and skill they gain in a Communication Studies program.
The diversity of our students’ career goals results in a graduate body that does not conform to a single mold. Graduates have pursued careers in law enforcement, education, management and marketing, while others have moved on to Communication-focused graduate programs. Each student is guided by their advisor to craft their focused sequence. The student to faculty ratio in our program (69:13 across AY 2018, 48:13 in Fall 2018, Week 4) allows students to work with an advisor with some expertise in their career goal.
II. Program Description and History
The Communication Studies program fills a niche in Communication programs nationally. Rather than focus on content production within a specific medium (e.g. television or radio broadcast) or on the dynamics of interpersonal communication, the Communication Studies B. S. gives students the flexibility to craft their own program of study. Students do gain experience in content production through courses like COM 248: Digital Media Production and COM 309: Communication Technology in Use, and they do gain experience in interpersonal communication through OIT’s general education requirements and courses like COM 205: Intercultural Communication and COM 347: Negotiation and Conflict Resolution. However, these experiences are the foundations for students to develop their specific professional interests.
III. Program History: AY 2014 to Present
The Communication Studies program was revised and approved by the CPC in Winter 2014. All new courses within the major have been rolled out, but many courses in the major are offered once per year or once per two years. As a result, initial PSLO data has not been collected in many of these courses. Within the same department, the Professional Writing program was approved in Winter of 2017 and its first courses launched in Winter 2018. While it is a distinct program from
Communication Studies, the two share many faculty and some courses. As this report discusses in section V: Assessment Cycle of Student Learning Outcomes, the PSLO assessment cycle is undergoing active revision to more efficiently assess these programs.
A. Program Locations
All Communication Studies students are located on the Klamath Falls campus, but the department is developing hybrid and online offerings to make the major more appealing to students in other locations. Communication faculty are present on the Klamath Falls campus (10), the Portland-Metro campus (2) and online (1).
The program serves primarily Communication Studies majors, but also serves students in other fields interested in communication-related course work to complement their chosen major.
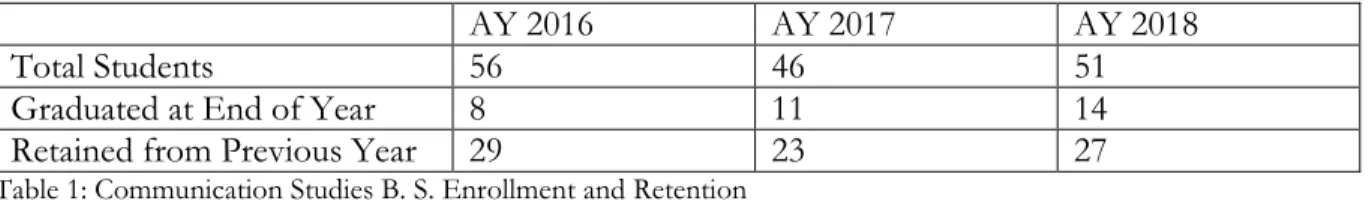
B. Enrollment and Retention Trends
According to FAST data, there were 44 total Communication Studies majors in Fall 2018, including 11 first year students, 8 sophomores, 6 juniors and 14 seniors. 7 additional students joined the major during AY 2018.
AY 2016 AY 2017 AY 2018
Total Students 56 46 51
Graduated at End of Year 8 11 14
Retained from Previous Year 29 23 27
Table 1: Communication Studies B. S. Enrollment and Retention
Communication Studies Assessment Report 2018-2019 5 Community College programs or from other programs at OIT, common retention data focused on first-time freshmen would not accurately describe our retention figures.
C. Program Graduates
In AY 2018, 14 students graduated with a Communication Studies B. S. One student also majored in Population Health Management, and another majored in Management (Small Business Option).
D. Industry Relationships
The Communication department as a whole does not maintain industry relationships beyond its advisory board, which includes school board members, Jeld-Wen employees and members of the community.
During AY 2018, the Communication department continued its membership in the MadCap Scholar Program, which grants access to the professional MadCap Flare suite of technical writing
applications for students (normally $1,799 per license).
E. Learning Experiences
In April of 2019, six students presented papers at the Northwest Communication Association’s annual conference in Coeur d’Alene, Idaho. These students experienced an academic conference in its entirety, networking with faculty from colleges and universities around the Pacific and Inland Northwest. Their work was presented at the same level as graduate students and faculty.
F. Program Changes
The Communication Studies B. S. has no programmatic changes from AY 2017 to AY 2018 due to formal assessment data. Some programmatic changes are occurring due to changes in the faculty and student bodies, but the results will not be known until AY 2018 or AY 2019.
Due to informal focus-group–style data (focused discussion in department and curriculum group meetings) regarding student preparedness to use technology relevant to communication professions (COM PSLO 5), the Communication department designed a new course focused on advanced tools in professional communication software (e.g. Apache OpenOffice or Microsoft Office). This class will be piloted in AY 2019.
Additionally, the assessment coordinator worked individually with faculty through AY 2018 to chart expected development along COM PSLO 5 to begin coordinating the activities of several classes that had previously been offered irregularly and without formal oversight. Early results of that coordination will be discussed in the AY 2019 assessment report.
IV. Program Education Objectives and Program Student Learning Outcomes (PSLOs)
A. Program Education Objectives
Upon completion of the Communication Studies program, students should be able to: 1. Apply appropriate communication skills across settings, purposes, and audiences. 2. Demonstrate knowledge of communication theory and application.
3. Practice critical thinking to develop innovative and well-founded perspectives related to the students’ emphases.
4. Build and maintain healthy and effective relationships.
5. Use technology to communicate effectively in various settings and contexts. 6. Demonstrate appropriate and professional ethical behavior.
B. Program Student Learning Outcomes
Students with a bachelor’s degree in Communication Studies should be able to: 1. Demonstrate critical and innovative thinking
2. Display competence in oral, written, and visual communication 3. Apply communication theories
4. Understand opportunities in the field of communication 5. Use current technology related to the communication field 6. Respond effectively to cultural communication differences 7. Communicate ethically
8. Demonstrate positive group communication exchanges
C. Origin and External Validation
The program objectives are reviewed annually by the department and at each advisory board
meeting. They are implicitly discussed at each CSAC (Communication Studies Advisory Committee) meeting, occurring twice per academic term, as individual students’ programs of study are reviewed. The Communication department has not yet begun external validation of these outcomes nor assessment of student proficiency after graduation. In AY 2019, the department will pilot an informal self-assessment of program graduates, hopefully creating a regular graduate assessment routine beginning in AY 2020.
V. Curriculum Map
The AY 2017 assessment report concluded that the existing curriculum map’s focus on individual courses for particular PSLOs and the resulting assessment cycle was suboptimal for a small program with such rapidly changing programs of study (i.e. focused sequences). As a result, a fuzzy ISM analysis (Singh & Garg, 2007) was conducted on courses taught during AY 2018 to begin remapping the curriculum according to faculty perceptions of where each PSLO was emphasized. This mapping process is intended to be recalibrated academic each year. Most courses are taught by the same faculty member or small group of faculty members each year, likely resulting in minimal change in the map over time, but it is believed that this continual recalibration of our map will improve the data received in our annual assessment cycle.
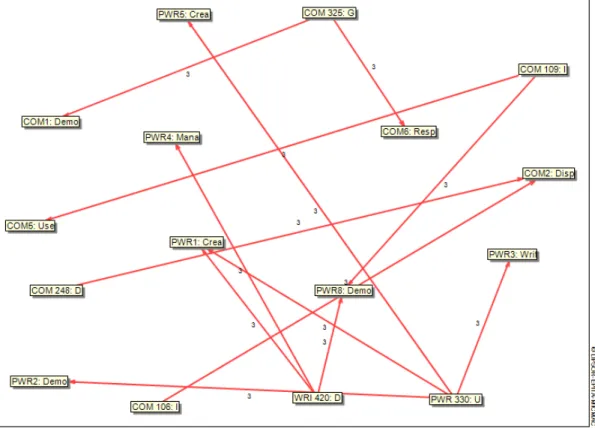
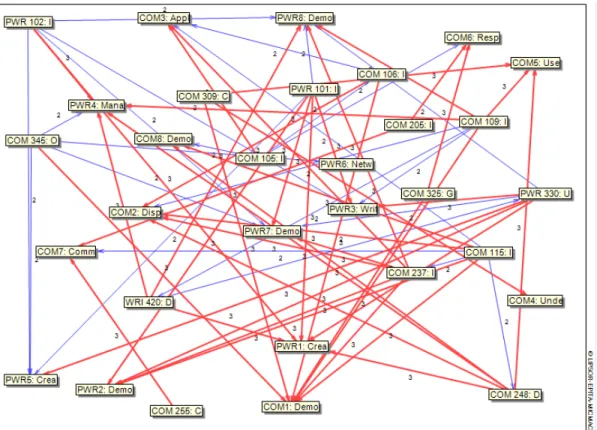
Communication Studies Assessment Report 2018-2019 7 Figure 1 above shows the courses and PSLOs1 with the most direct, dependent connections to each other – what we might consider the core of our program. Figure 2 below, while more difficult to read, shows the degree of connection between courses and PSLOs with some influence on each other. These maps were generated using the LIPSOR MICMAC method developed by Godet and Bourse (2010). Arrow-heads on lines indicate the direction of influence.
This map was developed by asking each faculty member teaching an in-major course during AY 2018 to rate the importance of each PSLO in determining a student’s final grade. Ratings were ranked nominally as Necessary, Important, Tangential or Not Assessed. In the LIPSOR method, impactors are rated on a scale from 3 (strong influence) to 0 (no influence) on other variables, and the software then uses these ratings to determine the structural relationships between variables based on those impacts. In our map, if demonstration of a PSLO had a definite impact on a student’s grade (the Necessary rating), this was ranked as a 3. Important ratings were ranked as 2, Tangential as 1 and Not Assessed as 0. Because faculty in the Communication department often rotate courses
1 Maps include both COM and PWR prefixes. Communication and Professional Writing course sequences have several
overlapping courses, and department faculty teach in both areas. Additionally, Communication and Professional Writing have several similar PSLOs. Rather than attempt to extricate Communication-specific data from the complete set, this report and the Professional Writing report will present shared curriculum mapping data.
between each other, it is assumed that their subjective evaluations need no additional external validation (cf. Buyserie, Macklin, Frye, & Ericsson, 2019, forthcoming).
Because only one round of responses has been collected and because not all Communication courses are offered in a single academic year, the map is not yet complete. In examining impactors only, a preliminary revised curriculum map would look as follows. Checkmarks indicate a course with a Relatively Strong or Strong influence on a student’s PSLO development. The AY 2019 assessment report will have gathered sufficient data to indicate expected degrees of mastery in each PSLO and observed student performance in almost all Communication courses.
Figure 2: MICMAC Direct Influence Graph, Strongest and Relatively Strong Influences Only (cf. Godet & Bourse, 2010)
Communication Studies Assessment Report 2018-2019 9 Course CO M 1 De mo ns tra te c rit ic al a nd inn ov at iv e t hi nk ing CO M 2 D ispl ay c om pe te nc e i n or al, wr itt en, a nd v isu al com m uni ca tion CO M 3 A pp ly c om m uni ca tion the or ie s CO M 4 U nd er st and op por tu ni tie s i n the fi el d of c om m uni ca tion CO M 5 U se cu rr en t t ech no lo gy re lat ed to th e co mmu nic at io n f ie ld CO M 6 Res po nd ef fect iv el y t o cu ltu ra l c ommu nic at io n di ff er en ces CO M 7 Co mmu nic at e e th ic ally CO M 8 D em on st ra te p osi tiv e g rou p com m uni ca tion e xc ha ng es COM 104: Introduction
to Communication Insufficient rating data
COM 105: Introduction to Communication Theory ✔ COM 106: Introduction to Communication Research ✔ ✔ COM 109: Introduction to Communication Technology ✔ ✔ COM 115: Introduction to Mass Communication ✔ ✔ ✔ ✔ COM 205: Intercultural Communication ✔ ✔ COM 216: Essentials of Grammar and
Punctuation Insufficient rating data
COM 225: Interpersonal
Communication Insufficient rating data
COM 237: Introduction to Visual Communication ✔ ✔ COM 248: Digital Media Production ✔ ✔ ✔ COM 255: Communication Ethics ✔ COM 276: Democracy
and Media Insufficient rating data
COM 301: Rhetorical
Theory and Application Insufficient rating data
COM 305:
Contemporary Rhetorical
Theory Insufficient rating data
COM 309: Communication
Technology in Use ✔ ✔ ✔
COM 325: Gender and
Communication ✔ ✔
COM 326:
Communication Research Insufficient rating data
COM 345: Organizational
Communication I ✔
COM 347: Negotiation
COM 358:
Communication and the
Law Insufficient rating data
COM 424: Capstone Insufficient rating data
JOUR 211: Publication
/ Student Newspaper Insufficient rating data
SPE 314:
Argumentation Insufficient rating data
Table 2: Preliminary Curriculum Map by PSLO and Course
VI. Assessment Cycle of Student Learning Outcomes
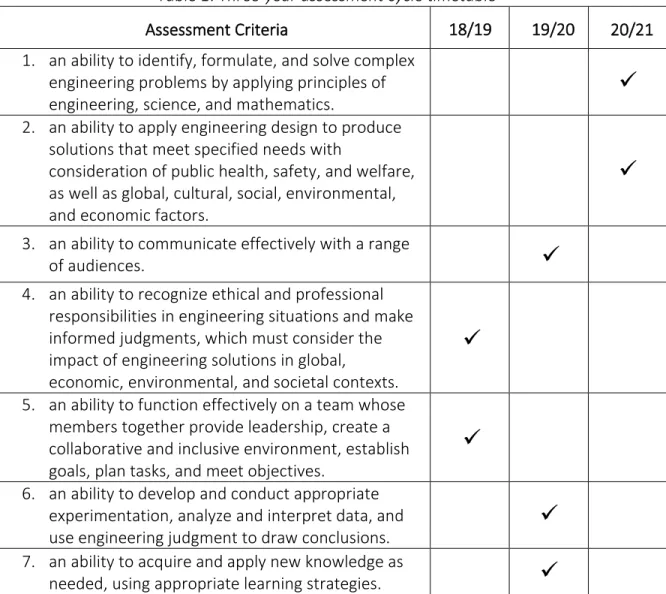
Along with recalibrating the curriculum map each year, the Communication department will collect artifacts across most or all of its courses offered, with each faculty member rating a sample of them on all PSLOs. This method follows a model put forth by Buyserie et al. (2019, in press). It assumes that all faculty in a program can act as expert readers of student work produced in that program. While the method loses some finer definition of individual students’ performances in each artifact, it does allow for wide-spread data collection and comparison within an individual program.
The previous assessment cycle is noted below. For continuity’s sake, this report will offer extra discussion of the PSLOs intended for assessment this year: PSLO 6, 7 and 8.
Learning Outcomes ’14-‘15 ’15-‘16 ’16-‘17 ’17-‘18 ’18-‘19 ’19-‘20
PSLO 1: Critical Thinking ● ●
PSLO 2: Competence in Comm ● ●
PLSO 3: Communication
Theory ● ●
PSLO 4: Opportunities in Field ●
PSLO 5: Use of Technology ● PSLO 6: Cultural Communication ● ● PSLO 7: Ethics ● ● PSLO 8: Group Communication ● 2 ●
Table 3: Communication Studies Assessment Cycle prior to AY 2018
VII. Summary of 2018-2019 Assessment Activities
The Communication Studies faculty participated in formal assessment of the Ethical Reasoning Essential Studies Learning Outcome (ESLO ER). Direct and indirect assessments of PSLO 6
(Cultural Communication), PSLO 7 (Communication Ethics) and PSLO 8 (Group Communication), the scheduled PSLOs for this cycle, are discussed below.
Communication Studies Assessment Report 2018-2019 11 Indirect assessments were formed by taking up to five years (AY 2014-2018) of final grade data from FAST, examining student performance in a series of courses (described below). This data is compared to responses in the Student Exit Survey, broadly measuring the agreement between students and faculty about their performance in these outcomes. This inexact process helps fill the gaps in artifact gathering, though it is complicated by a limited response rate from graduating Communication Studies students graduating in Spring 2017 (response n = 5).
Direct assessments were conducted through Portfolium. While faculty continued to have access to Blackboard courses when artifacts were collected, CMS platform changes and other internal
workload concerns limited artifact collection. Due to an initial error in setting up the assessment process on Portfolium, each artifact was only rated once. Future reports will include multiple raters per artifact and measures of inter-rater reliability.
Further, direct assessments were conducted using a career-long, nominal scale. This scale is not intended to be used by untrained or non-expert raters, and therefore does not intend to be reliable if used by individuals outside the Communication department’s current faculty roster. Instead, the goal is to be both reflexive and trustworthy (cf. Lincoln & Guba, 1985), prompting faculty discussion of student performance and desired changes. The scale is presented in Appendix C: Direct Assessment Rating Scale.
As there is some overlap in courses relevant to each PSLO discussed in this report, readers are encouraged to consult Table 2: Preliminary Curriculum Map by PSLO and Course above to see how each course fits in the curriculum overall. Course descriptions are included in Appendix B: Assessed Course Descriptions.
A. PSLO 6: Cultural Communication
1) Indirect Assessment: Student Exit Survey and Course Grades
All students rated themselves as having “High Proficiency” in ESLO 6 (Diverse Perspectives), but only three students rated themselves as having “High Proficiency” in COM PSLO 6: Respond effectively to cultural communication differences (stated in that language on the exit survey). The other two rated themselves as “Proficient.”
In comparison, courses that faculty rated as having a strong Cultural Communication component (COM 106, COM 205, COM 325) saw a similar rate from the faculty perspective. Again, as noted above, grades in these courses are not solely based on PSLO performance, but faculty teaching these courses have indicated that PSLO 6 plays a strong role in a student’s overall grade. In this indirect look at student performance, it is worth noting that the sophomore-level course (COM 205: Intercultural Communication) saw the largest split between what we might consider “High Proficiency” in course content (“A” scores) and “Proficiency” in course content (“B” and “C” scores).
The cause in this dip cannot be determined from these data, but it is worth noting that a similar trend can be seen over the last five years, indicating that it is unlikely to be a cohort effect. COM 205
does feature a broader survey of content, and future assessments of ESLO 2 (Inquiry and Analysis) and COM PSLO 3 (Apply communication theories.) should examine artifacts from this course if that dip in performance grows or if students are unable to transfer knowledge from that course into other contexts.
AY2018 A B/C Below C
AY2014-AY2018 A B/C Below C COM 106 35% n=(6) 53% n=(9) 12% n=(2) COM 106 56% n=(37) 33% n=(22) 11% n=(7) COM 115 33% n=(5) 53% n=(8) 13% n=(2) COM 115 43% n=(28) 45% n=(29) 9% n=(6) COM 325 100% n=(6) 0% n=(0) 0% n=(0) COM 325 88% n=(30) 12% n=(4) 0% n=(0) Table 4: Final Grades for PSLO 6 Relevant Courses: AY 2018 (Blue) and AY 2014-2018 (Yellow)
All students credit their time at Oregon Tech and in the Communication Studies program “very much” in developing this ability. Of these students, only one had started their academic career in a different program (Medical Imaging), transferring to Communication Studies as a junior. The exit survey did not ask how much prior majors (if any) contributed to learning outcomes.
Again, this is a small set of responses from a small program, so the results must be viewed as the individual experiences of these students, rather than a robust assessment of the program as a whole.
2) Direct Assessment: Performance in COM 106: Introduction to Communication Research and Other
Courses
COM 106 concludes with an academic literature assignment applying a communication theory learned in COM 104 and/or COM 105 to a specific instance or medium of communication (e.g. media selectivity and social media feeds). This course follows COM 105, which provides a general introduction to Communication theories as a whole, and precedes COM 326, in which they use their literature review assignment as the foundation for a term-long research study.
The nature of this course as part of a core scaffold in the Communication Studies program and of the Communication Studies student body (composed of traditional college students in their first major, advanced students who have changed majors and non-traditional students) does not imply clear “starting point” for performance. Further, because students were applying theory in
Communication Studies—a field heavily focused on cultural contact zones—it is unsurprising that students generally performed at least as expected.
However, the assignment does not explicitly require students to demonstrate an understanding of cultural communication differences. The two artifacts that were not rated as Advanced or Beginning Student were preparing to study monocultural groups and, as a result, did not have an opportunity to demonstrate PSLO 6.
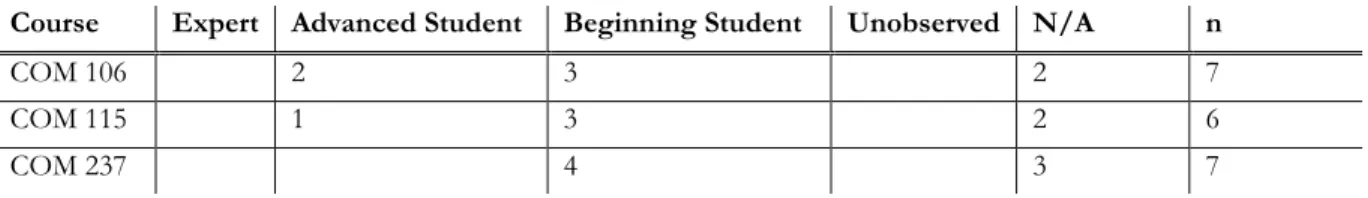
Communication Studies Assessment Report 2018-2019 13 Course Expert Advanced Student Beginning Student Unobserved N/A n
COM 106 2 3 2 7
COM 115 1 3 2 6
COM 237 4 3 7
Figure 3: PSLO 6 Performance in COM 106, COM 115, COM 237
COM 115 (Introduction to Mass Communication) and COM 237 (Introduction to Visual
Communication) are courses that require more attention to the effect of culture on communication. COM 115 requires an understanding of both the culture of the sending a message and the culture(s) receiving it. COM 237 likewise requires students to understand the effect of a non-verbal text on different audiences. COM 115 is typically taken in the first year of the program, while COM 237 is taken by both first- and second-year students. Of the 17 students represented in these artifacts, 10 were first-year students at the time of artifact collection.
While it should not be surprising, then, that a majority of students performed at the level of a beginning college student, it is worth noting that students were performing some degree of cultural communication competency even when not explicitly prompted to do so.
3) Discussion: Cultural Communication
Data indicate that Communication Studies students are generally performing as expected in PSLO 6: Respond effectively to cultural communication differences.
That they likewise perform this outcome well when unprompted (or minimally prompted by course content) is not a large surprise. A primary focus of communication theories is the interaction between a message’s sender and receiver(s), a relationship that at least implicitly requires an understanding of and response to each side’s cultural standpoint. As this is the first year of
assessment activity using a dispersed artifact-gathering process, a longitudinal understanding of how (and where) students progress in this outcome is not yet possible. Subsequent reports will
continue to gather and report on artifacts in this PSLO. Further, the assessment coordinator has logged the names of students whose work was collected in this assessment. Where possible, individual longitudinal growth will be discussed in future reports.
B. PSLO 7: Communicate ethically
1) Indirect Assessment: Student Exit Survey and Course Grades
Of the five student exit survey responses received, four students rated their ability to communicate ethically as “High Proficiency,” while one rated themselves as having “Proficiency” in this area. All five rated themselves has having “High Proficiency” when prompted to rate their performance in
the Ethical Reasoning: Making Ethical Judgments ESLO.
Comparing these self-assessments to final grade data in courses, it is worth noting that overall performance in ethics-related courses tends to trend upwards. As noted earlier, COM 115 tends to be taken in the first year. COM 205, as a heavily-enrolled general education course, is taken as soon
as students can get a seat in it (typically in their first or second year). COM 255 is typically taken by second- and third-year students.
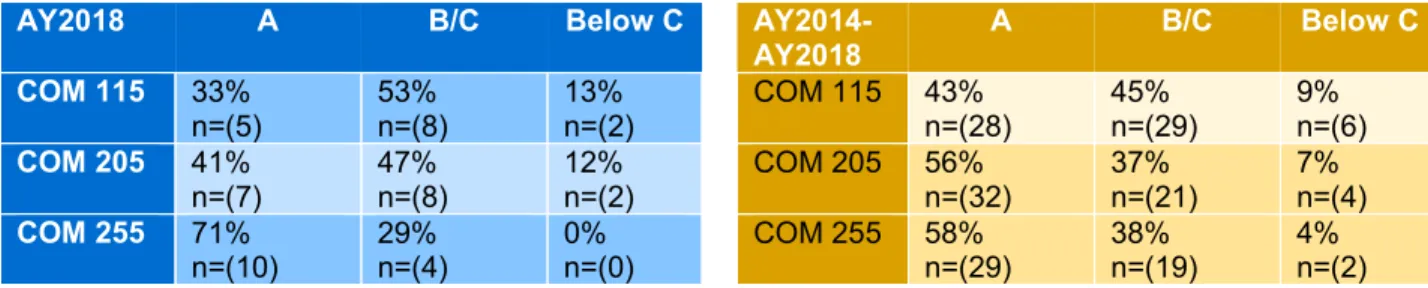
AY2018 A B/C Below C
AY2014-AY2018 A B/C Below C COM 115 33% n=(5) 53% n=(8) 13% n=(2) COM 115 43% n=(28) 45% n=(29) 9% n=(6) COM 205 41% n=(7) 47% n=(8) 12% n=(2) COM 205 56% n=(32) 37% n=(21) 7% n=(4) COM 255 71% n=(10) 29% n=(4) 0% n=(0) COM 255 58% n=(29) 38% n=(19) 4% n=(2) Table 5: Final Grades for PSLO 7 Relevant Courses: AY 2018 (Blue) and AY 2014-2018 (Yellow)
Final grade data suggests that students may be overestimating their ethical reasoning ability, whether we are judging by the COM PSLO prompt or the university ESLO prompt. The AY 2019 report should examine artifacts demonstrating prompted and unprompted ethical reasoning and communication practices.
2) Direct Assessment: Performance in Related Courses
Artifacts collected from COM 106, COM 115 and COM 237 showed high proficiency in ethical communication practices. As each of the assignments were end-of-term research papers, this PSLO was demonstrated primarily through academic attribution practices – “Beginning Student” ratings went to artifacts with accurate use of APA style, while “Advanced Student” ratings went to artifacts that showed significant effort into fully and properly representing ideas within source text.
Course Expert Advanced Student Beginning Student Unobserved N/A N
COM 106 5 2 7
COM 115 2 4 6
COM 237 3 3 1 7
Table 6: PSLO 7 Performance in COM 106, COM 115, COM 237
While it is unsurprising that COM 106 featured the most Advanced Student ratings (as students spend the full term compiling an academic literature review through several rounds of revision and instructor feedback), it is surprising to see that COM 237 students did not carry all of those lessons forward. Whether this was due to implicit differences between the assignments themselves or to a cohort effect is unclear. However, these gaps are being discussed in curriculum group meetings and between faculty who teach sequenced courses to improve latent knowledge activation in later courses. As no formal effort or curriculum revision has begun, there are no results or plans to note yet.
3) Coordinated Direct Assessment: Ethical Reasoning ESLO
The Communication Studies program submitted artifacts from two courses (JOUR 211: Student Newspaper and COM 255: Communication Ethics) for the university-wide ESLO assessment of Ethical Reasoning. During the university-wide Assessment Days, artifacts from JOUR 211 were