University of South Florida
Scholar Commons
CUTR Faculty and Staff Publications
The Center for Urban Transportation Research
(CUTR)
2017
Exploring Factors Contributing to Lane Changes
during Left Turns on Quadruple Left-Turn Lanes
at Signalized Intersections
Fulu Wei
Jilin Jianzhu University
Zhenyu Wang
University of South Florida, [email protected]
Jian Lu
Tongji University
Follow this and additional works at:
https://scholarcommons.usf.edu/cutr_facpub
Part of the
Transportation Commons
, and the
Transportation Engineering Commons
This Article is brought to you for free and open access by the The Center for Urban Transportation Research (CUTR) at Scholar Commons. It has been accepted for inclusion in CUTR Faculty and Staff Publications by an authorized administrator of Scholar Commons. For more information, please [email protected].
Scholar Commons Citation
Wei, Fulu; Wang, Zhenyu; and Lu, Jian, "Exploring Factors Contributing to Lane Changes during Left Turns on Quadruple Left-Turn Lanes at Signalized Intersections" (2017).CUTR Faculty and Staff Publications. 122.
Advances in Mechanical Engineering
2017, Vol. 9(5) 1–9
ÓThe Author(s) 2017 DOI: 10.1177/1687814017700062 journals.sagepub.com/home/ade
Exploring factors contributing to lane
changes during left turns on quadruple
left-turn lanes at signalized
intersections
Fulu Wei
1, Zhenyu Wang
2and Jian Lu
3Abstract
Quadruple left-turn lanes are employed gradually at some major intersections in Jilin, China. At these intersections, fre-quent lane changes during left turns of vehicles can lead to vastly disordered traffic operations. In this study, the factors contributing to lane changes during left turn behaviors at quadruple left-turn lane intersections were interpreted based on a field survey. In total, data on 192 green intervals and 550 individual lane-change behaviors were collected in Changchun, Jilin Province. A lane-changing rate model was established to predict the rate of lane changes during left turns. In addition, an interval selection model was built to estimate the probability of lane changes during left turn (from inside to outside only) for an individual vehicle using logistic regression. The two models provide insights to assess the traffic conditions of quadruple left-turn lane at intersections. The results of this study suggest that weaving distance, ini-tial lane, traffic flow rate, and percentage of large vehicles significantly contribute to lane changes during left turn. Based on the identified factors, safety countermeasures to reduce lane changes during left turn behaviors are proposed. Keywords
Quadruple left-turn lanes, lane-changing rate, lane-changing interval selection, traffic capacity, traffic safety
Date received: 4 August 2016; accepted: 22 February 2017 Academic Editor: Yongjun Shen
Introduction
Problem statement
In the past decade, vehicle ownership in China has increased rapidly with the fast growth of the economy. Traffic congestion, and its consequential traffic con-flicts, energy consumption, and air pollution, has been a severe issue for transportation agencies, travelers, and residents in urban areas in China. To satisfy the growth in traffic demand, elevated expressways have been built widely in some metropolises. As the connec-tor between an elevated expressway and a major sur-face arterial, a signalized intersection transfers high left-turn volume from the elevated expressway to the arterial. Quadruple left-turn lanes (QLLs) have been constructed gradually at these intersections to provide
enough capacity for the left-turn movements from ele-vated expressways. The use of QLLs improves the effi-ciency for releasing left-turning vehicles in a traffic signal cycle; however, it also increases the difficulty of lane changing for left-turning vehicles whose initial lane is different from the target lane.
1
School of Transportation Engineering, Jilin Jianzhu University, Changchun, China
2
Center for Urban Transportation Research (CUTR), University of South Florida, Tampa, FL, USA
3
School of Transportation Engineering, Tongji University, Shanghai, China
Corresponding author:
Zhenyu Wang, Center for Urban Transportation Research (CUTR), University of South Florida, Tampa, FL 33620, USA.
Email: [email protected]
Creative Commons CC-BY: This article is distributed under the terms of the Creative Commons Attribution 3.0 License (http://www.creativecommons.org/licenses/by/3.0/) which permits any use, reproduction and distribution of the work without further permission provided the original work is attributed as specified on the SAGE and Open Access pages (https://us.sagepub.com/en-us/nam/ open-access-at-sage).
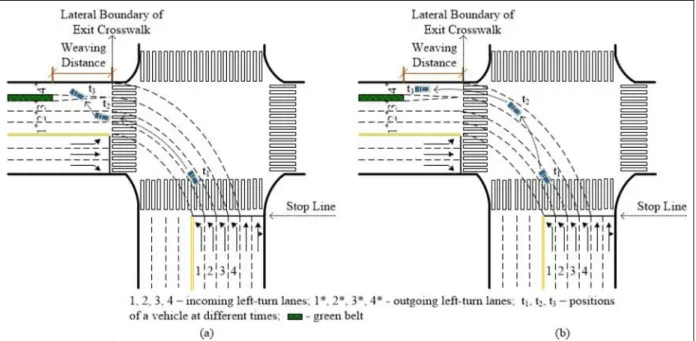
For example, as shown in Figure 1, a driver exits from an elevated expressway, and his or her target is to merge into the right-most (most outside) lane on the intersecting arterial. Due to the high traffic volume, the driver has few opportunities to stay in the right-most lane before entering the intersection (a common phe-nomenon in peak hours). Ideally, the driver makes a lane change after completing the left turn. In many Chinese arterials, however, raised green belts are a pop-ular design to separate the right-most lane from other lanes. This design determines the space (weaving dis-tance) that can be used for lane changing in the receiv-ing approach. The shorter the weavreceiv-ing distance is, the less frequent lane-change opportunities are, especially during peak hours. In this situation, the driver may have to seek lane-change opportunities during the left turn within the intersection area. It should be noted that this issue is the same for drivers whose target lane is the left-most (inside) lane and the initial lane is on the right (outside).
Lane-changing behaviors of left-turning vehicles at intersections, either from inside to outside (I2O) or from outside to inside (O2I), are divided into two types in this study: (1) lane changes after left turn (LCAL), in which a lane change occurs after a left turn at the down-stream weaving area of the intersection, starting at the lateral boundary of the exit crosswalk and ending at the nose of the green belt, as shown in Figure 1(a), and (2) lane changes during left turn (LCDL), in which a lane change occurs during a left turn within an intersection area, starting at the entry stop line and ending at the
lateral boundary of the exit crosswalk, as shown in Figure 1(b).
LCDL is strongly discouraged, because it tends to
cause serious conflicts between turning vehicles.
Consequently, traffic congestion caused by LCDL can block intersections and even lead to traffic accidents. Thus, it is necessary to understand the mechanism of LCDL and contributing factors for developing effective safety countermeasure at QLL intersections.
Literature review
In the past several decades, lane changes have been widely studied, and the negative effects of lane changes on traffic efficiency and safety have been confirmed
fre-quently.1–6 At present, research on lane-changing
focuses on both macroscopic and microscopic aspects. The macroscopic performance of traffic flow is affected
by lane-changing behaviors.7–10 Macroscopic
lane-changing models were built to predict lane-lane-changing rates and highway capacity and to probe the character-istics of lane-changing flow.3,11,12 However, the special impact of large vehicles was not considered in these studies. Kinematic wave theory was introduced to describe traffic dynamics and lane-changing traffic
flow.13–15 However, the kinematic wave theory does
not reflect the specific performance of individual lane-changing vehicles.
During the past three decades, many kinds of micro-scopic lane-changing models have been proposed to reflect the decision-making process of drivers of
Figure 1. Lane-changing behaviors of left-turning vehicles at QLL intersections: (a) lane change after left turn and (b) lane change during left turn.
lane-changing vehicles.1,16,17These models usually were classified as mandatory lane-changing or discretionary
lane-changing types by the maneuvers.18–20Gap
accep-tance behaviors were considered in some mandatory lane-changing models, and the distribution of accepted
gaps was probed in these models.21,22 Gap acceptance
is the term used to indicate a safety opportunity selected by a driver to change lanes. The lead and lag vehicles are also considered to be significant variables
to build microscopic lane-changing models.23–26 The
primary limitations are that they fail to consider the destination attractions and traffic conditions of the tar-get lane. Moreover, the initial location of lane-changing vehicles is ignored in most microscopic lane-changing models. Fuzzy logic theory often was adopted to build lane-changing models for both mandatory and
discre-tionary lane changes.27–30 Some microscopic
lane-changing models use classifiers or neural networks to
predict lane-changing events.31–34Although these
mod-els perform well for resolving complex problems, the specific effects of individual contributing factors are difficult to address in detail.
Research objectives
Generally speaking, previous studies focused on lane-changing behaviors on roadway segments. Rarely were studies found to explore lane-changing behaviors in turning, especially at QLL intersections. The research objective of this study was to address the contributing factors that cause LCDL at QLL intersections. In par-ticular, this study sought to
Develop a lane-changing rate model to predict
the LCDL rate at QLL intersections considering both I2O and O2I lane changes;
Develop a logit model to identify the factors
con-tributing to the probability of LCDL (e.g. I2O) for individual vehicles at QLL intersections.
Data collection
Four approaches with QLLs at two major signalized intersections in Changchun were selected for data col-lection. As shown in Figure 2, the selected intersections have the following characteristics:
Both intersections connect an elevated
express-way with a major urban arterial, with four left-turn lanes on major approaches, as shown in Figure 2.
The intersections have similar geometries (except
for weaving distance), traffic controls, and traffic
conditions; there are no special road permission settings or temporary controls.
The intersections represent two typical weaving
distance designs in Changchun: long weaving distance (53–60 m), which accounts for 42% of major intersections, and short weaving distance (22–29 m), which accounts for 37% of major intersections.
The operations of vehicles at QLLs of signalized intersections were recorded by video cameras. Lane-changing data were extracted from the videos using three criteria: (1) the data collection period lasted 1.5 months and covered morning and evening rush hours, (2) the data were collected during each left-turn green interval, and (3) 192 green intervals were observed for the macroscopic model, and information on 550 individual lane-change behaviors was collected as an appropriate sample size for the microscopic model. The descriptive statistics of the collected data are shown in Table 1.
The LCDL rate is defined in equation (1) as follows
LCDL rate=LCDL vehicles in traffic flow
Traffic flow ð1Þ
whereLCDL rateis the rate of LCDL,LCDL vehicles
in traffic flowis the volume of left-turning vehicles that make LCDL (both I2O and O2I) in a green interval, and traffic flow is the volume of left-turning vehicles that are released in a green interval. The mean LCDL rate is 0.46, indicating that almost one LCDL occurs for every two left-turning vehicles at a QLL intersec-tion. This statistic indicates that the left-turning traffic at QLL intersections is extremely disordered in China. Possible reasons include improper geometric designs in upstream and downstream, ineffective traffic controls, aggressive driver behaviors, and lack of enforcement and education.
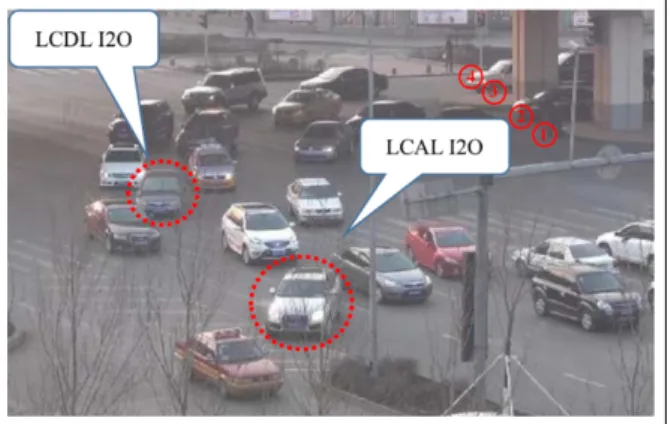
Figure 2. Example of lane changes during left turn at QLL intersection.
Methodology
Two statistical models were developed in this study: a linear regression model was used to explore the factors contributing to the rate of LCDL (both I2O and O2I) at QLL intersections, and a logit regression model was used to quantify the probability of individual LCDL at QLL intersections.
Linear regression
The form of the linear regression model can be expressed in equation (2) as follows
yi=b0+b1xi1+ +bpxip+ei, i=1,. . .,n ð2Þ
whereyi is the rate of LCDL, xi1,. . .,xip are the inde-pendent variables, b0 is a constant, b1,. . .,bp are the
slope coefficients of the independent variables,i repre-sents the ith observation, and ei is an error item that indicates unobserved noise.
Logit regression
If the initial lane of a left-turning vehicle is different from its target lane, the driver will exhibit a lane-changing behavior, either LCDL or LCAL. This choice is a typical binary variable; a logistic regression method is widely applied to describe the relationship between a
binary dependent variable and explanatory (indepen-dent) variables. The form of the logistic regression model is given as equation (3)
Logit(Pi) =LN Pi 1Pi =l0+l1X1,i+l2X2,i+ +lKXK,i ð3Þ
where Pi is the probability of LCDL occurring in ith
observation, l0,l1,l2,. . .,lK represents the constant
and slope coefficients that can be estimated by maxi-mum likelihood estimation, and X1,i,X2,i,. . .,XK,i are
the independent variables. To transform equation (3),
the probability of the ith left-turning vehicle taking
LCDL can be expressed as equation (4)
Pi= EXP½l0+l1X1,i+l2X2,i+ +lKXK,i
1+EXP½l0+l1X1,i+l2X2,i+ +lKXK,i
ð4Þ
Model interpretation
To interpret the models, marginal effect (ME) and adjusted prediction (AP) were employed to explain the impacts of independent variables. ME is the change in probability due to an individual independent variable change (1 unit for continuous variables and 0–1 for categorical variables); all other variables were held Table 1. Descriptive statistics of collected data.
Macroscopic model
Continuous variable Min. Max. Mean Std deviation
LCDL rate 0.2632 0.5909 0.4604 0.0662
Traffic flow rate (vehicle(s)/min) 35 76 58.48 9.686
Categorical variable Code Freq. %
Large vehicle(s) percentage (PLV) 1: PLV= 0 117 60.9
2: 0\PLV<5 35 18.2
3: PLV.5 40 20.8
Weaving distance 1: Short (22–29 m); 0: long (53–60 m) 112 58.3
Microscopic model
Categorical variable Code Freq. %
Lane-change behaviors (I2O only) 1: LCDL; 0: LCAL 334 60.7
Initial lane 1: Lane-changing vehicle starts from Lane 1 155 28.2
2: Lane-changing vehicle starts from Lane 2 149 27.1
3: Lane-changing vehicle starts from Lane 3 246 44.7
Weaving distance 1: Short (22–29 m); 0: long (53–60 m) 317 57.6
Traffic flow rate on left-side adjacent lane 1: Traffic flow rate<14 vehicles/min 0: Traffic flow rate.14 vehicles/min
456 82.9
Traffic flow rate on right-side adjacent lane 1: Traffic flow rate<11 vehicles/min 0: Traffic flow rate.11 vehicles/min
97 17.6
LCDL: lane changes during left turn; LCAL: lane changes after left turn.
constant. In a linear regression model, the ME of an independent variable is its slope coefficient. Because the relationship between an independent variable and a dependent variable is assumed to be linear, the ME of a continuous variable can explain the impact of the variable through its whole range. In a non-linear model (such as a logistic model), ME represents an ‘‘average’’ change in the probability of the dependent variable rather than a constant change rate.
AP is defined as the predicted probability given independent variables. In this study, average MEs (AMEs), average AP (AAP), MEs at representative val-ues (MERs), and AP at representative (APR) were used to explain the independent variables. A more detailed explanation of ME and AP can be found in a previous article.35
Estimation results and discussion
Macroscopic model
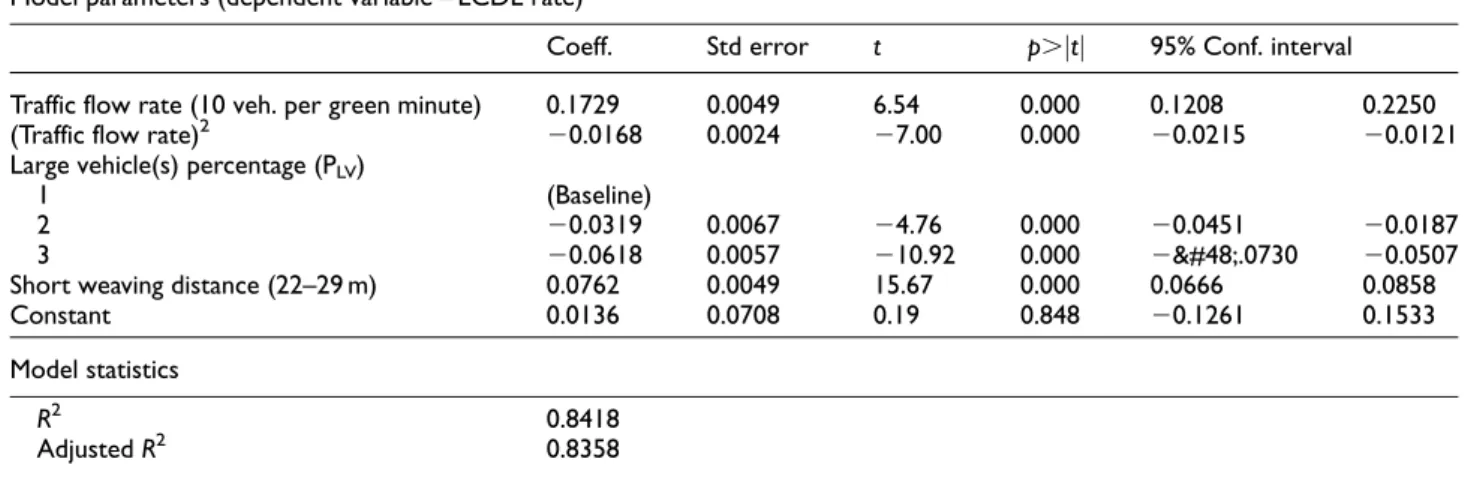
The macroscopic model was estimated by the STATA 12 package. The model has three independent vari-ables: traffic flow rate (multiple of 10 vehicles per green minute), percentage of large vehicles in left-turn vol-ume, and downstream weaving distance. The estimated results and goodness-of-fit are given in Table 2. TheR2 (0.8418) is close to 1, indicating that the regression line has a good fitting degree to the observation values.
According to the estimated model (Table 2), the downstream weaving distance significantly influences
the LCDL rate (p.0.001). Compared to a long
weav-ing distance (53–60 m), a short weavweav-ing distance tends to increase the LCDL rate by 7.62%. This finding is intuitive to understand in that a long weaving distance provides more opportunities for a left-turning vehicle to make a lane change after completion of a left turn.
The presence of large vehicles is another factor that significantly contributes to the LCDL rate. Compared to no presence of large vehicles in a green interval, the presence of 5% or less large vehicles is more likely to decrease the LCDL rate by 3.19%. If the percentage of large vehicles is more than 5%, the LCDL rate will be reduced by 6.18%. It is clear that the presence of large vehicles in left-turning traffic reduces available gaps (opportunities) for vehicles intending to make an LCDL. These vehicles have to seek lane-change oppor-tunities after completion of the left turn.
The traffic flow rate of left-turning vehicles in a green interval is a significant factor influencing the LCDL rate. A high left-turning flow rate means high traffic density and less probability of available gaps for LCDL. On the other hand, a driver’s intention to make an LCDL is low if the left-turning flow rate is small because, in this situation, he or she has enough oppor-tunities to make an LCAL. In this situation, LCDL is an unnecessary risk for drivers. As shown in Table 2 and Figure 3, the relationship between the LCDL rate and the total left-turning volume in one green interval is quadratic rather than linear.
Table 2. Estimation results for macroscopic model. Model parameters (dependent variable = LCDL rate)
Coeff. Std error t p.j jt 95% Conf. interval
Traffic flow rate (10 veh. per green minute) 0.1729 0.0049 6.54 0.000 0.1208 0.2250
(Traffic flow rate)2 20.0168 0.0024 27.00 0.000 20.0215 20.0121
Large vehicle(s) percentage (PLV)
1 (Baseline)
2 20.0319 0.0067 24.76 0.000 20.0451 20.0187
3 20.0618 0.0057 210.92 0.000 20.0730 20.0507
Short weaving distance (22–29 m) 0.0762 0.0049 15.67 0.000 0.0666 0.0858
Constant 0.0136 0.0708 0.19 0.848 20.1261 0.1533
Model statistics
R2 0.8418
AdjustedR2 0.8358
LCDL: lane changes during left turn.
Figure 3. Average adjusted prediction of traffic flow rate in green interval.
Figure 3 shows the AAP of the LCDL rate over the left-turn traffic flow rate, holding other factors con-stant. The LCDL rate tends to increase when the left-turn traffic flow rate is low. With an increase in the left-turn flow rate, the lane-changing opportunities in downstream weaving areas decrease and the driver’s intention to make an LCDL increases. If the left-turn flow rate is extremely high, the opportunity for an LCDL decreases gradually. In this stage, a driver must take lane changes in the downstream. As shown in Figure 3, the maximum LCDL rate (0.48) occurs in the vicinity of 52 vehicles/min.
It is interesting that the minimum LCDL rate in Figure 3 is still close to 0.4. At this time, the left-turn volume is close to congestion status (75 vehicles/min on four lanes = 1125 vehicles/h/lane (vphpl)). This shows that drivers have strong intentions to change lanes during left turns, even if the gap is very small (close to congestion status).
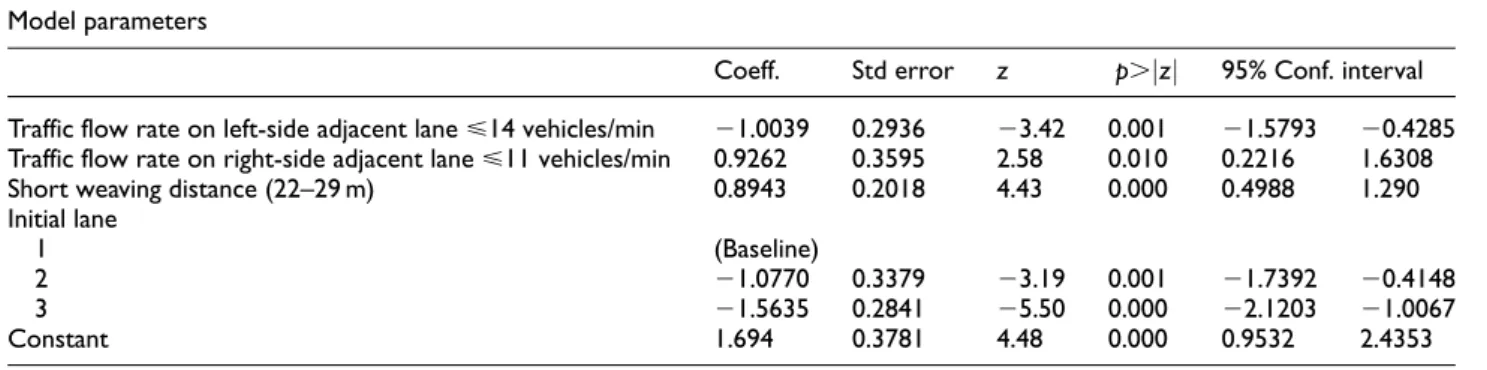
Microscopic model
The coefficients of the logit model for individual lane-changing vehicles and the AME for explanatory vari-ables were estimated using the STATA 12.0, as shown in Table 3. Note that the microscopic model included LCDL-I2O only, as this is the major portion of LCDL at QLL intersections.
As shown in Table 3, a short weaving distance (22– 29 m) is more likely to increase the probability of indi-vidual LCDL by 18.21%, compared to a long weaving distance (53–60 m). This finding is constant with the macroscopic model.
The traffic flow rate in the adjacent lane on the left side has a significant influence on the probability of individual LCDL-I2O. If the left-turn traffic flow rate in the adjacent lane on left side is 14 vehicles/min or less, the probability that individual LCDL will be 19.0% lower than the left-turn traffic flow rate is more than 14 vehicles/min. A high left-turn traffic flow rate on the left-side adjacent lane indicates an increased probability of lane change from the left lane to the cur-rent lane that the target vehicle is occupying. Thus, the target vehicle may receive the pressure from the lane-change vehicles on the left lane and is forced to lane-change to the right lane. This chain reaction may result in a high probability of LCDL. On the contrary, a higher flow rate in the right-side lane indicates smaller gaps and lower opportunities of LCDL for its inside lane.
A vehicle targeting the right-most lane and starting from Lane 2 will have a reduction of 20.2% in the LCDL probability compared to that starting from Lane 1 (most inside). If the vehicle is starting from Lane 3, the reduction will be 31.1%. Usually, a vehicle whose target lane is the right-most lane (Lane 4) is Table 3. Estimation and AME for microscopic models.
Model parameters
Coeff. Std error z p.j jz 95% Conf. interval Traffic flow rate on left-side adjacent lane<14 vehicles/min 21.0039 0.2936 23.42 0.001 21.5793 20.4285 Traffic flow rate on right-side adjacent lane<11 vehicles/min 0.9262 0.3595 2.58 0.010 0.2216 1.6308
Short weaving distance (22–29 m) 0.8943 0.2018 4.43 0.000 0.4988 1.290
Initial lane 1 (Baseline) 2 21.0770 0.3379 23.19 0.001 21.7392 20.4148 3 21.5635 0.2841 25.50 0.000 22.1203 21.0067 Constant 1.694 0.3781 4.48 0.000 0.9532 2.4353 Model statistics Link function: logistic
Log likelihood =2320.3695, pseudoR2= 0.1306 AME for microscopic model
dy/dx Std error t p.j jt 95% Conf. interval Traffic flow rate on left-side adjacent lane<14 vehicles/min 20.1900 0.0498 23.82 0.000 20.2875 20.0924 Traffic flow rate on right-side adjacent lane<11 vehicles/min 0.1773 0.0626 2.83 0.005 0.0547 0.3000
Short weaving distance (22–29 m) 0.1821 0.0397 4.59 0.000 0.1043 0.2600
Lane-changing vehicle starts from Lane 2 20.2017 0.0608 23.32 0.001 20.3209 20.0825
Lane-changing vehicle starts from Lane 3 20.3112 0.0497 26.26 0.000 20.4086 20.2138
AME: average marginal effect.
dy/dxfor factor levels is discrete and change from 0 to 1.
willing to stay on Lanes 4 as early as possible before a left turn; however, not all lane-changing vehicles have the opportunity. Many vehicles may enter Lanes 2 and 3, and a small portion may stay in Lane 1. LCAL from Lane 1 is more difficult than from Lane 2 or 3, espe-cially in peak hours. Thus, Lane 1 has the highest likeli-hood of LCDL. Compared to starting a left turn on Lane 1, starting the left turn from Lane 2 has a less pressure to take an LCDL. Starting from Lane 3 has the lowest likelihood to take an LCDL.
The probabilities of LCDL by traffic flow rates on adjacent lanes, downstream weaving distances, and ini-tial lanes are compared in Figure 4. It can be seen that the probability of LCDL for each scenario keeps a high
level ( 49.4%), confirming the disorder of the traffic
stream at QLL intersections in China.
Conclusion and recommendations
In this study, the factors contributing to LCDL at QLL intersections in Jilin were identified from both the macroscopic and microscopic aspects. The following conclusions were drawn:
The organization of left-turning traffic at QLL
intersections in Jilin is very disordered. Based on the macroscopic and microscopic models, it can be estimated that more than 40% of left-turning vehicles make LCDLs.
Extension of weaving distance in the
down-stream is an effective countermeasure to reduce LCDL behaviors. From a macroscopic aspect, replacing a short weaving distance (22–29 m) in the downstream with a long weaving distance (53–60 m) will reduce the LCDL rate by 7.6%. The microscopic model shows that this replace-ment will reduce the probability of LCDL (I2O) by 18.2%.
The relationship between the LCDL rate and the
left-turn traffic flow rate in a green interval is just like a quadratic curve. The left-turn traffic flow rate of approximately 52 vehicles/min experi-ences the maximum LCDL rate (0.48). Thus, countermeasures should be optimized for this flow rate range.
From the microscopic aspect, a low traffic flow
rate in the left adjacent lane (14 vehicles per green light minute) results in the probability of LCDL (I2O) being 19% lower than a high
vol-ume (.14 vehicles/min). A low traffic flow rate
in the right adjacent lane (11 vehicles per green light minute) tends to increase the probability of LCDL (I2O) by 17.7% when compared to a high volume (.11 vehicles/min).
The initial lane from which a left-turn vehicle
starts is a significant factor that contributes to the probability of LCDL (I2O). Lane 1 (the most inside lane) experiences the highest probability (80.6%), followed by Lane 2 (60.4%) and Lane 3 (49.4%). Traffic warning signs and optimum geometric designs should be installed in the upstream to encourage drivers who target the outside lanes to stay on the right-most lane as early as possible before entering the intersection. Based on the findings, some recommendations on countermeasures, aiming to reduce LCDL behaviors and improve traffic efficiency at QLL intersections, are proposed:
Effective engineering countermeasures: (1)
extend weaving distance to provide enough space to make LCAL; (2) add extension lines to indicate lane splits within intersections; (3) apply access management technology, moving access points from major roads to downstream side Figure 4. AAP of LCDL-I2O over traffic flow rates on left/right-side adjacent lanes, initial lanes, and weaving distance.
street so as to reduce the needs of instant lane change to right-most lane after left turn; and (4) advanced warning signs to guide drivers to make an early lane change before entering the intersection.
Effective enforcement countermeasures: (1) ban
vehicle LCDL behaviors and (2) enforce
right-of-way limits for large vehicles at QLL
intersections.
Effective education countermeasures: (1)
orga-nize volunteers to identify dangerous behaviors and (2) distribute handbills, T-shirts, and other promotional materials to advocate following traffic rules.
In future, the influencing factors of QLL traffic operation should be explored in depth, because other influencing variables may exist that affect traffic opera-tion efficiency, safety, and distribuopera-tion, such as land use around intersections and lane channel types.
Declaration of conflicting interests
The author(s) declared no potential conflicts of interest with respect to the research, authorship, and/or publication of this article.
Funding
The author(s) disclosed receipt of the following financial sup-port for the research, authorship, and/or publication of this article: This research was funded by the National Natural Science Foundation of China (grant no. 51278220) and the Doctoral Startup Foundation of Jilin Jianzhu University, and it was supported by the China Scholarship Council, 2017 Jilin Province Science and Social Science in Colleges and Universities of ‘‘Thirteen-Five’’ research plan project. References
1. Gipps PG. A model for the structure of lane-changing decisions.Transport Res B1986; 20: 403–414.
2. Winsum W, Waard D and Brookhuis KA. Lane change manoeuvres and safety margins.Transport Res F1999; 2: 139–149.
3. Laval JA and Daganzo CF. Lane-changing in traffic stream.Transport Res B2006; 40: 251–264.
4. Zheng Z, Ahn S and Monsere CM. Impact of traffic oscillations on freeway crash occurrences.Accident Anal Prev2010; 42: 626–636.
5. Wei F, Guo W, Liu X, et al. Left-turning vehicle trajec-tory model and guide line setting at intersections. Dis-crete Dyn Nat Soc2014; 2014: 950219.
6. Zheng Z. Recent developments and research needs in modeling lane changing. Transport Res B 2014; 60: 16–32.
7. Daganzo CF. A behavioral theory of multi-lane traffic flow. Part II: merges and the onset of congestion. Trans-port Res B2002; 36: 159–169.
8. Kerer BS and Klenov SL. Microscopic theory of spatial-temporal congested traffic patterns at highway bottle-necks.Phys Rev E2003; 68: 036130.
9. Duret A, Ahn S and Buisson C. Lane flow distribution on a three-lane freeway: general features and the effects of traffic controls.Transport Res C2012; 24: 157–167. 10. Tian J, Treiber M, Ma S, et al. Microscopic driving
the-ory with oscillatthe-ory congested states: model and empiri-cal verification.Transport Res B2015; 71: 138–157. 11. Chang GL and Kao YM. An empirical investigation of
macroscopic lane-changing characteristics on uncon-gested multilane freeways. Transport Res A 1991; 25: 375–389.
12. Tang TQ, Wong SC, Huang HJ, et al. Macroscopic mod-eling of lane-changing for two-lane traffic flow. J Adv Transport2009; 43: 245–273.
13. Lighthill MJ and Whitham GB. On kinematic waves. II. A theory of traffic flow on long crowded roads.P Roy Soc1955; 229: 281–345.
14. Richards PI. Shockwaves on the highway.Oper Res1956; 4: 42–51.
15. Jin W. A kinematic wave theory of lane-changing traffic flow.Transport Res B2010; 44: 1001–1021.
16. Hidas P. Modelling lane changing and merging in micro-scopic traffic simulation. Transport Res C 2002; 10: 351–371.
17. Reimer B, Donmez B, Lavalliere M, et al. Impact of age and cognitive demand on lane choice and changing under actual highway conditions.Accident Anal Prev2012; 52: 125–132.
18. Ahmed KI.Modeling drivers’ acceleration and lane chang-ing behavior. PhD Thesis, Department of Civil and Envi-ronmental Engineering, Massachusetts Institute of Technology, Cambridge, MA, 1999.
19. Toledo T, Choudhury CF and Ben-Akiva ME. Lane-changing model with explicit target lane choice. Trans-port Res Rec2005; 1934: 157–165.
20. Qi HS, Wang DH, Chen P, et al. Location-dependent lane-changing behavior for arterial road traffic. Netw Spat Econ2014; 14: 67–89.
21. Vivek G. Gap acceptance behavior in mandatory lane changes under congested and uncongested traffic on a multilane freeway. Paper presented at the 86th annual meeting of Transportation Research Board, Washington, DC, 21–25 January 2007. Washington, DC: Transporta-tion Research Board of the NaTransporta-tional Academies. 22. Liu P, Wang X, Lu J, et al. Headway acceptance
charac-teristics of U-turning vehicles at unsignalized intersec-tions.Transport Res Rec2007; 2027: 52–57.
23. Toledo T, Koutsopoulos HN and Ben-Akiva ME. Mod-eling integrated lane-changing behavior. Transport Res Rec2003; 1857: 30–38.
24. Hidas P. Modelling vehicle interactions in microscopic simulation of merging and weaving. Transport Res C 2005; 13: 37–62.
25. Choudhury CF, Ben-Akiva ME, Toledo T, et al. Model-ing cooperative lane-changModel-ing and forced mergModel-ing beha-vior. Paper presented at the 86th annual meeting of Transportation Research Board, Washington, DC, 21–25
January 2007. Washington, DC: Transportation Research Board of the National Academies.
26. Rahman M, Chowdhury M, Xie Y, et al. Review of microscopic lane-changing models and future research opportunities.IEEE T Intell Transp2013; 14: 1942–1956. 27. McDonald M, Wu J and Brackstone M. Development of
a fuzzy logic based microscopic motorway simulation model.IEEE Proc Intell Transp Syst1997; 82–87. 28. Das S and Bowles BA. Simulation of highway chaos
using fuzzy logic.Fuzzy Inf Process Soc1999; 130–133. 29. Peeta S, Zhang P and Zhou W. Behavior-based analysis
of freeway car-truck interaction and related mitigation strategies.Transport Res B2005; 39: 417–451.
30. Hou Y, Edara P and Sun C. A genetic fuzzy system for modeling mandatory lane changing. IEEE Proc Intell Transp Syst2012; 1044–1048.
31. Hunt JG and Lyons GD. Modeling dual carriageway lane-changing using neural networks. Transport Res C 1994; 2: 231–245.
32. Tomar RS, Verma S and Tomar GS. Prediction of lane change trajectories through neural network. IEEE Proc Comput Intell Commun Netw2010; 249–253.
33. Hou Y, Edara P and Sun C. Modeling mandatory lane changing using Bayes classifier and decision trees.IEEE T Intell Transp2014; 15: 647–655.
34. Zheng J, Suzuki K and Fujita M. Predicting driver’s lane-changing decisions using a neural network model.Simul Model Pract Th2014; 42: 73–83.
35. Williams R. Using the margins command to estimate and interpret adjusted predictions and marginal effects.Stata J2012; 12: 308–331.