DETERMINATION OF THE BEST SINGLE IMPUTATION ALGORITHM
FOR MISSING RAINFALL DATA TREATMENT
(Penentuan Al-Khwarizmi Imputasi Tunggal bagi Merawat Data Hujan Lenyap yang Terbaik)
GAMIL ABDULRAQEB ABDULLAH SAEED, ZUN LIANG CHUAN, ROSLINAZAIRIMAH ZAKARIA, WAN NUR SYAHIDAH WAN YUSOFF & MOHD ZUKI SALLEH
ABSTRACT
The presence of missing rainfall data is inevitable due to error of recording, meteorological extremes and malfunction of instruments. Consequently, a competent imputation algorithm for missing data treatment algorithm is very much needed. There are several such efficient algorithms which have been introduced in earlier studies. However, the limitations of current algorithms are they are highly dependent on the information and homogeneity of adjoining rainfall stations. Therefore, this study is intended to introduce several single imputation algorithms for missing data treatment, which believed to be more competent in treating missing daily rainfall data without the need to depend on the information of adjoining rainfall stations. The proposed algorithms use descriptive measures of the data, including arithmetric means, geometric means, harmonic means, medians and midranges. These algorithms are tested on hourly rainfall data records from six selected rainfall stations located in the Kuantan River Basin. Based on the analysis, the proposed singular imputation algorithms, which treated missing data by geometric means, harmonic means and medians are more superior compared to the other imputation algorithms, irrespective of missing rates and rainfall stations.
Keywords: missing data; rainfall data; numerical descriptive measures; Kuantan River Basin
ABSTRAK
Kehadiran data hujan lenyap tidak dapat dielakkan berpunca dari ralat perekodan, kejadian ekstrem meterologi dan kegagalan peralatan. Natijahnya, suatu al-Khwarizmi imputasi bagi data lenyap yang cekap amat diperlukan. Terdapat beberapa al-Khwarizmi imputasi yang cekap telah diperkenalkan dalam kajian lepas. Walau bagaimanapun, kelemahan bagi al-Khwarizmi tersebut adalah mereka amat bersandar pada maklumat dan kehomogenan stesen-stesen hujan berhampiran. Oleh itu, kajian ini bertujuan untuk memperkenalkan beberapa al-Khwarizmi imputasi tunggal bagi data lenyap, yang mana ia mampu merawat data hujan harian lenyap tanpa bergantung pada maklumat dan kehomogenan stesen-stesen hujan yang berhampiran. Al-Khwarizmi yang diperkenalkan merawat data lenyap dengan menggunakan sukatan perihalan berangka, iaitu min aritmetik, min geometri, min harmonik, median dan julat tengah. Al-Khwarizmi yang dicadangkan ini dinilai menggunakan data hujan per jam dari enam stesen hujan terpilih yang terletak di Lembangan Sungai Kuantan. Hasil analisis mendapati al-Khwarizmi imputasi tunggal dengan menggunakan min geometri, min harmonik dan median merupakan al-Khwarizmi yang paling cekap berbanding dengan al-Khwarizmi imputasi lain tanpa mengira kadar data lenyap mahupun stesen hujan yang terlibat.
Kata kunci: data lenyap; data hujan; ukuran perihalan berangka; Lembangan Sungai Kuantan
1. Introduction
Due to the conversion status of agricultural land to non-agricultural status in Malaysia, the contribution from the agricultural sector to the Gross Domestic Product (GDP) has been continuously declining. Nevertheless, agricultural sector still remains significant to ensure food security, economic growth, socioeconomic improvement, employment generation,
80
poverty reduction and overall achievement of Vision 2020 (Alam et al. 2012). In relation to this, the accurate estimation of frequency and magnitude of extreme rainfall events is highly demanded for efficient crop water management. However, the estimation is often flawed due to the lack of complete rainfall records. Hence, a competent imputation algorithm for estimating missing rainfall data is much needed.
Based on literatures in environmental sciences, the commonly used conventional algorithms in treating missing data include normal ratio algorithm (NRA) (Radi et al. 2015; Young 1992), inverse distance weighting algorithm (IDWA) (Ahrens 2006; Chen & Liu 2012; Radi et al. 2015; Simanton & Osborn 1980; Tabios & Salas 1985), and coefficient of correlation of weighting algorithm (CCWA) (Radi et al. 2015; Teegavarapu & Chandramouli 2005). Furthermore, several modified versions of the NRA and IDWA have also been proposed to improve the accuracy in treating missing data (Ozelkan et al. 2005; Tang et al. 1996). Recently, Suhaila et al. (2008) and Azman et al. (2015) showed that the hybridization of modified NRA, IDWA and CCWA are more reliable with missing rates of up to 30%. Jamaludin and Suhaimi (2013) also demonstrated that the kriging interpolation algorithm is competent in the estimation of missing rainfall data.
The main limitation of the aforementioned algorithms is it is highly dependent on the information and homogeneity of adjoining stations. In addition, the accuracy of the algorithms is questionable when high level of missing rates is present at the adjoining stations records. Therefore, the main purpose of this study is to develop an efficient single imputation algorithm in treating missing rainfall data without depending on the information and homogeneity of adjoining stations. In order to pursue the main purpose of this paper, the rest of this paper is organized as follows: In Section 2, a brief description of rainfall stations involved in this study is presented. The theoretical background of proposed algorithms and performance indices used are described in Section 3 while the analysis results are rendered in Section 4. Finally, conclusion of the study is given in Section 5.
2. Study Areas
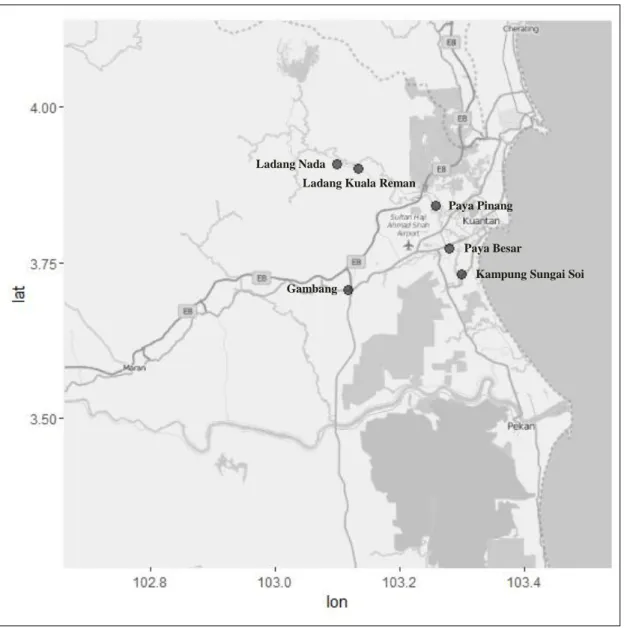
Kuantan River Basin is located at the north eastern end of Pahang in Peninsular Malaysia, covering 1630 km2 catchment area starting from forest reserved area in Mukim Ulu Kuantan, passingthrough agricultural areas and Kuantan town before flowing to the South China Sea (Nasir et al. 2012; Win & Win 2014). This river basin is one of the crucial tributaries in Pahang, where it irrigates the major rural, agriculture, urban and industrial areas of Kuantan District (Win & Win 2014). The main economic activities in this river basin are agricultural activities, including oil palm, rubber and fruits (Nasir et al. 2012). This area is exposed to risk due to natural disasters such as flood and landslide during northest moonson, resulting in massive impact on society and economy. Therefore, the prediction of the frequency and magnitude of extreme rainfall events by using complete time series data is highly important. In this study, hourly rainfall data from six selected rainfall stations in the Kuantan river basin were used to evaluate the competency of the several proposed single imputation algorithms for missing data treatment. The stations are shown in Figure 1 and information on each station can be found in Table 1. The data ranges from October to December, which is the timeframe for northeast monsoon season. These data which are free from missing data covers the period 2013 to 2014 obtained from the Department of Irrigation and Drainage Malaysia (DID). The main intention for selecting complete data is for validation of the proposed imputation algorithms for missing data treatment. The missing data is randomly simulated and extracted out from the complete dataset.
81 Figure 1:Location of the six selected rainfall stations in Kuantan River Basin
Table 1: Description of the six selected rainfall stations in Kuantan River Basin
Station ID Station Name Latitude Longitude Period Number of Days, n
3731018 Gambang 03° 42’20’’ 103° 07’ 00’’ 01/01/2013-03/02/2014 399
3732020 Paya Besar 03° 46’20’’ 103° 16’ 50’’ 01/01/2013-05/11/2013 309
3732021 Kampung Sungai Soi 03° 43’50’’ 103° 18’ 00’’ 01/01/2013-02/02/2014 398
3832015 Paya Pinang 03° 50’30’’ 103° 15’ 30’’ 01/01/2013-04/02/2014 400
3931013 Ladang Nada 03° 54’30’’ 103° 06’ 00’’ 01/01/2013-30/01/2014 395
3931014 Ladang Kuala Reman 03° 54’00’’ 103° 08’ 00’’ 01/01/2013-06/07/2013 187
Ladang Nada
Ladang Kuala Reman
Gambang
Paya Pinang
Kampung Sungai Soi Paya Besar
82
3. Theoretical Backgrounds 3.1 Numerical descriptive measures
Numerical descriptive measures, including measure of central tendency, are the non-graphical exploratory data analysis technique, which is frequently used to summarize main characteristics of datasets. In addition, numerical descriptive measures also can be used to treat missing data. Based on literatures on environmental sciences (Dray & Josse 2015; Troyanskaya et al. 2001; Zainuri et al. 2015), row mean is frequently used as the initial value for iteration-based imputation algorithms. However, the use of row mean is not recommended when the imputation of missing data is performed based on hourly data. This is due to the high occurance of missing data in the series. Hence, the purpose of this study is to compare the competency of several measures of central tendency in treating daily rainfall data. Let
24
An represents the
n
days of hourly time series rainfall data, which comprises of ,A
ij
a the available hourly rainfall amount and aijmissA, the missing data. Therefore, the five proposed single imputation algorithms for missing data treatment can be expressed as below: 1
1
mi miss j i ij ia
a
m
(1) 1 1 i i m m miss j ij ia
a
(2) 11
i miss i j m ij im
a
a
(3)
1median
1 miss j ij i ma
a
(4)
1 11
min
max
2
i i miss j ij ij i m i ma
a
a
(5) where j1, 2, , 24 and mi n is the length of the aij. Equations (1) - (5) represent the column measures of central tendency, which are column arithmetic means (CAM), column geometric means (CGM), column harmonic means (CHM), column medians (CMD) and column midranges (CMR), respectively. On the other hand, these measures will be compared with the most frequently used numerical descriptive measures and the best algorithm used based in a study by Masseran et al. (2013) to treat missing data and the equations are as below. 1 j m ij j miss i ja
a
m
(6)83 1 1 1 2 miss j i j i j a a a (7)
where mj 24. Equations (6) - (7) represent the row arithmetic means (RAM) and the last- and-next (LAN) algorithm, respectively.
3.2 Performance indices
The performance indices which have been widely applied to evaluate imputation algorithms for missing data treatment are correlation coefficient, root index of agreement, mean square error, mean relative error and normalized root mean square error (Azman et al. 2015; Chen & Liu 2012; Radi et al. 2015; Suhaila et al. 2008; Tang et al. 1996; Teegavarapu & Chandramouli 2005; Zainuri et al. 2015). In this study, three performance indices, namely Bray-Curtis dissimilarity (BD), mean square error (MAE) and normalized root mean square error (NRMSE) are used with value close to 0 indicates better fit. These three performance indices can be expressed as follows:
est obs 1 est obs 1 BD n i i i n i i i a a a a
(8) est obs 11
MAE
n i i ia
a
n
(9)
2 est obs 1 2 obs obs 1 1 NRMSE 1 1 n i i i n i i a a n a a n
(10)where est 24 est
1
i j ij
a
a and obs 24 obs1
i j ij
a
a are estimated and observed daily rainfall amounts, respectively. In this study, the best algorithm is determined by ranking the averages of BD, MAE, and NRMSE at various missing rates.4. Data Analysis
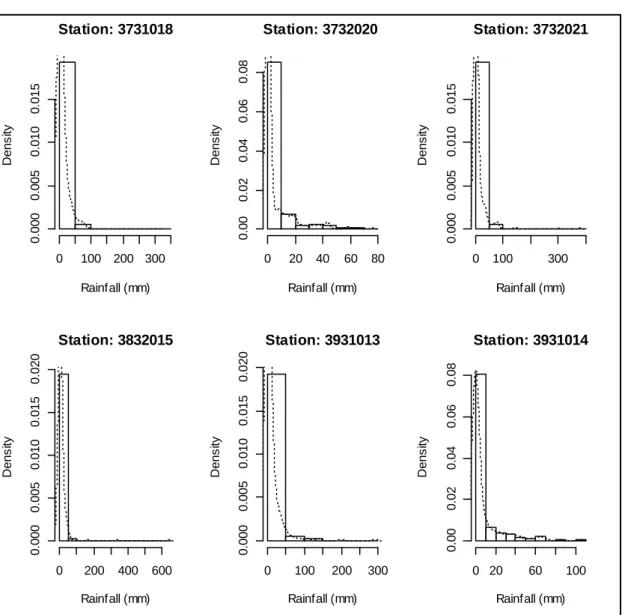
Table 2 depicts the descriptive analysis of daily rainfall data for the six selected rainfall stations in Kuantan River Basin, comprising of the arithmetic means, standard deviations, and coefficient of variations. Meanwhile, Figure 2 depicts stations’ data distribution. Based on the values of arithmetic means in Table 2, it is found that the average daily rainfall amount of Gambang, Kampung Sungai Soi, Paya Pinang and Ladang Nada stations are greater than 8mm, while the Paya Besar station has lowest average daily rainfall amount. On the other hand, it can also be seen that Ladang Kuala Reman station experienced the lowest variation as
84
the coefficient of variation of this station is relatively small compared to the other five stations. Figure 2 demonstrates that the daily rainfall records for the six selected rainfall stations are all skewed to the right.
Table 2: Descriptive analysis of daily rainfall (mm) for the six selected rainfall stations
Station ID Station Name Mean Standard Deviation Coefficient of variation
3731018 Gambang 8.9301 25.6628 2.8737
3732020 Paya Besar 4.9359 11.7632 2.3832
3732021 Kampung Sungai Soi 8.1302 29.2155 3.5935
3832015 Paya Pinang 8.6155 39.1805 4.5477
3931013 Ladang Nada 8.4013 24.6776 2.9374
3931014 Ladang Kuala Reman 7.3043 16.5869 2.2708
Figure 2: Daily rainfall distribution for the six selected rainfall stations
Station: 3731018 Rainfall (mm) De n s ity 0 100 200 300 0 .0 0 0 0 .0 0 5 0 .0 1 0 0 .0 1 5 Station: 3732020 Rainfall (mm) De n s ity 0 20 40 60 80 0 .0 0 0 .0 2 0 .0 4 0 .0 6 0 .0 8 Station: 3732021 Rainfall (mm) De n s ity 0 100 300 0 .0 0 0 0 .0 0 5 0 .0 1 0 0 .0 1 5 Station: 3832015 Rainfall (mm) De n s ity 0 200 400 600 0 .0 0 0 0 .0 0 5 0 .0 1 0 0 .0 1 5 0 .0 2 0 Station: 3931013 Rainfall (mm) De n s ity 0 100 200 300 0 .0 0 0 0 .0 0 5 0 .0 1 0 0 .0 1 5 0 .0 2 0 Station: 3931014 Rainfall (mm) De n s ity 0 20 60 100 0 .0 0 0 .0 2 0 .0 4 0 .0 6 0 .0 8
85 Table 3: A performance comparison among the single imputation missing data algorithms
Missing rate
Station ID
Average Ranked
RAM* LAN* CAM CGM CHM CMD CMR RAM
* LAN * CA M CG M CH M CM D CMR 5% 3731018 0.1644 0.2392 0.2181 0.0889 0.0889 0.0889 7.1860 4 6 5 1 1 1 7 3732020 0.1165 0.1243 0.1437 0.0772 0.0772 0.0772 4.5089 4 5 6 1 1 1 7 3732021 0.1226 0.2336 0.2129 0.0962 0.0962 0.0962 7.0338 4 6 5 1 1 1 7 3832015 0.1833 0.2472 0.2589 0.1345 0.1345 0.1345 7.8446 4 5 6 1 1 1 7 3931013 0.1617 0.1865 0.2106 0.0931 0.0931 0.0931 5.5622 4 5 6 1 1 1 7 3931014 0.1052 0.2348 0.1528 0.0469 0.0469 0.0469 4.2140 4 6 5 1 1 1 7 10% 3731018 0.3929 0.5012 0.4714 0.2270 0.2270 0.2270 14.1601 4 5 6 1 1 1 7 3732020 0.2331 0.3128 0.2775 0.1366 0.1366 0.1366 8.2160 4 5 6 1 1 1 7 3732021 0.2831 0.2826 0.4265 0.2133 0.2133 0.2133 14.0048 5 4 6 1 1 1 7 3832015 0.4226 0.5565 0.5426 0.3412 0.3412 0.3412 15.7721 4 6 5 1 1 1 7 3931013 0.3087 0.3657 0.6684 0.2334 0.2334 0.2334 11.0100 4 5 6 1 1 1 7 3931014 0.3340 0.4821 0.3499 0.1283 0.1283 0.1283 9.0152 4 6 5 1 1 1 7 15% 3731018 0.5014 0.6304 0.6815 0.3358 0.3358 0.3358 20.9573 4 5 6 1 1 1 7 3732020 0.3250 0.3879 0.3870 0.1776 0.1776 0.1776 12.2665 4 6 5 1 1 1 7 3732021 0.4819 0.5234 0.6518 0.3284 0.3284 0.3284 20.7561 4 5 6 1 1 1 7 3832015 0.5135 0.7046 0.7836 0.4605 0.4605 0.4605 20.8581 4 5 6 1 1 1 7 3931013 0.4061 0.5234 0.6829 0.3614 0.3614 0.3614 16.3365 4 5 6 1 1 1 7 3931014 0.3850 0.3480 0.4866 0.1912 0.1912 0.1912 13.3385 5 4 6 1 1 1 7 20% 3731018 0.7667 1.0144 0.9505 0.4938 0.4938 0.4938 28.0776 4 6 5 1 1 1 7 3732020 0.4136 0.4784 0.5578 0.2914 0.2914 0.2914 15.9553 4 5 6 1 1 1 7 3732021 0.5661 0.7923 0.8986 0.4739 0.4739 0.4739 27.9957 4 5 6 1 1 1 7 3832015 0.5605 0.8507 0.9161 0.5122 0.5122 0.5122 29.8132 4 5 6 1 1 1 7 3931013 0.5451 0.7729 0.8837 0.4860 0.4860 0.4860 20.8749 4 5 6 1 1 1 7 3931014 0.5368 0.8633 0.7300 0.3037 0.3037 0.3037 17.8860 4 6 5 1 1 1 7 25% 3731018 0.7472 1.0221 1.1500 0.6684 0.6684 0.6684 32.8720 4 5 6 1 1 1 7 3732020 0.5430 0.6730 0.6727 0.3537 0.3537 0.3537 20.0668 4 6 5 1 1 1 7 3732021 0.7457 0.8822 1.0723 0.5976 0.5976 0.5976 35.0766 4 5 6 1 1 1 7 3832015 0.6719 0.9566 1.1634 0.6112 0.6112 0.6112 36.2791 4 5 6 1 1 1 7 3931013 0.7848 0.9578 1.0796 0.6196 0.6196 0.6196 27.3223 4 5 6 1 1 1 7 3931014 0.7612 0.8682 0.8473 0.3197 0.3197 0.3197 21.8995 4 5 6 1 1 1 7 30% 3731018 0.9829 1.2624 1.4395 0.8361 0.8361 0.8361 42.3990 4 5 6 1 1 1 7 3732020 0.5684 0.7660 0.7708 0.3641 0.3641 0.3641 25.5809 4 5 6 1 1 1 7 3732021 0.8125 1.0586 1.3000 0.6769 0.6769 0.6769 38.9218 4 5 6 1 1 1 7 3832015 0.7860 1.0696 1.4025 0.7833 0.7833 0.7833 41.7996 4 5 6 1 1 1 7 3931013 0.8754 1.1780 1.3255 0.8139 0.8139 0.8139 32.6420 4 5 6 1 1 1 7 3931014 0.9625 1.0474 1.0926 0.4539 0.4539 0.4539 26.7392 4 5 6 1 1 1 7
86
To verify the performance of the five proposed single imputation algorithms, the average values of the three performance indices considered at missing rates of 5%, 10%, 15%, 20%, 25% and 30% are calculated and presented in Table 3. In addition, the average of the performance indices for the existing single imputation algorithms (RAM and LAN) are also provided. Based on Table 3, it can be seen that the single imputation missing data algorithms, which replaced the missing data with column geometric means (CGM), column harmonic means (CHM) and column medians (CMD) are consistently more superior compared to the other four algorithms as displayed by lower averages of performance indices for all levels of missing rates considered. On the contrary, the algorithm which replaced the missing data with column midranges (CMR) is the least effcient in this study.
5. Conclusions and Future Work
This study provides the evaluation of single imputation algorithms for missing data treatment by using numerical descriptive statistics, which are column arithmetic means, column geometric means, column harmonic means, column medians and column midranges. The proposed algorithms are tested by using six selected hourly rainfall data from monitoring stations in the Kuantan River Basin with missing rates as high as 30%. These algorithms are evaluated by ranking the averages of the three selected performance indices. Based on the analysis, it is found that the proposed algorithms in this study, which replaced missing data with column geometric means, column harmonic means and column medians are more superior compared to the existing algorithms. Thus, this study recommends using the column geometric means, column harmonic means and column medians as initial points for multiple imputation algorithms for missing data treatment.
Acknowledgements
The authors would like to acknowledge the support of the Department of Irrigation and Drainage Malaysia. Appreciations are also extended to the Universiti Malaysia Pahang (UMP) for providing the flagship research grant RDU150393.
References
Ahrens B. 2006. Distance in spatial interpolation of daily rain gauge data. Hydrology and Earth System Sciences
10: 197-208.
Alam M.M., Morshed G., Siwar C. & Murad M.W. 2012. Initiatives and challenges of agricultural crop sector in East Coast Economic Region (ECER) development projects in Malaysia. American-Eurasian Journal Agriculture & Environmental Sciences12(7): 922-931.
Azman M.A., Zakaria R. & Radi N.F.A. 2015. Estimation of missing rainfall data in Pahang using modified spatial interpolation weighting methods. In AIP Conference Proceedings, 1643, pp. 65-72.
Chen F-W. & Liu C-W. 2012. Estimation of the spatial rainfall distribution using inverse distance weighting (IDW) in the middle of Taiwan. Paddy and Water Environment 10(3): 209-222.
Dray S. & Josse J. 2015. Principal component analysis with missing values: a comparative survey of methods. Plant Ecology216(5): 657-667.
Jamaludin S. & Suhaimi H. 2013. Spatial interpolation on rainfall data over Peninsular Malaysia using ordinary kriging. Jurnal Teknologi63(2): 51-58.
Masseran N., Razali A.M., Ibrahim K., Zaharim A. & Sopian K. 2013. Application of the single imputation method to estimate missing wind speed data in Malaysia. Research Journal of Applied Sceinces, Engineering and Technology6(10): 1780-1784.
Nasir M.F.M., Zali M.A., Juahir H., Hussain H., Zain S.M. & Ramli N. 2012. Application of receptor models on water quality data in source apportionment in Kuantan River Basin. Iranian Journal of Environmental Health Science & Engineering9:18, doi:10.1186/1735-2746-9-18.
87 Ozelkan E., Bagis S., Ozelkan E.C., Ustundag B.B., Yucel M. & Ormeci C. 2005. Spatial interpolation of climatic
variables using land surface temperature and modified inverse distance weighting. International Journal of Remote Sensing36(4): 1000-1025.
Radi N.F.A., Zakaria R. & Azman M.A. 2015. Estimation of missing rainfall data using spatial interpolation and imputation methods. In AIP Conference Proceedings, 1643, pp. 42-48.
Simanton J.R. & Osborn H.B. 1980. Reciprocal-distance estimate of point rainfall. Journal of Hydraulic Engineering 106: 1242-1246.
Suhaila J., Sayang M.D. & Jemain A.A. 2008. Revised spatial weighting methods for estimation of missing rainfall data. Asia-Pacific Journal of Atmospheric Sciences44(2): 93-104.
Tabios G. & Salas J.D. 1985. A comparative analysis of techniques for spatial interpolation of precipitation. Water Resources Bulletin21(3): 365-380.
Tang W.Y., Kassim A.H.M. & Abubakar S.H. 1996. Comparative studies of various missing data treatment methods-Malaysia experience. Atmospheric Research42(1-4): 247-262.
Teegavarapu R.S.V. & Chandramouli V. (2005). Improved weighting methods, deterministic and stochastic data-driven models for estimation of missing precipitation records. Journal of Hydrology312(1-4): 191-206. Troyanskaya O., Cantor M., Sherlock G., Brown P., Hastie T., Tibshirani R., Botstein D. & Altman R.B. 2001.
Missing value estimation methods for DNA microarrays. Bioinformatics 17(6): 520-525.
Win N.L. & Win K.N. 2014. The probability distributions of daily rainfall for Kuantan River Basin in Malaysia. International Journal of Science and Research 3(8): 977-983.
Young K.C. 1992. A three-way model for interpolating for monthly precipitation values. Monthly Weather Review
120(11): 2561-2569.
Zainuri N.A., Jemain A.A. & Muda N. 2015. A comparison of various imputation methods for missing values in air quality data. Sains Malaysiana44(3): 449-456.
Faculty of Industrial Sciences and Technology Universiti Malaysia Pahang
Lebuhraya Tun Razak 26300 Gambang, Kuantan Pahang DM
MALAYSIA
E-mail: [email protected], [email protected]*, [email protected], [email protected]
_______________________ *Corresponding author