Energy Consumption, CO
2
Emissions, and Economic
Growth: An Ethical Dilemma
Nikolaos Antonakakis
*,†, Ioannis Chatziantoniou
*, and George Filis
‡*
University of Portsmouth, Economics and Finance Subject Group, Portsmouth Business School, Portland Street, Portsmouth, PO1 3DE, United Kingdom
†Webster Vienna Private University, Department of Business and Management, Praterstrasse
23, 1020, Vienna, Austria
‡Panteion University of Social and Political Sciences, Department of Economic and Regional
Development, 136 Syggrou Avenue, Athens, 17671, Greece
December 8, 2016
Abstract
In this study we examine the dynamic interrelationship in the output–energy– environment nexus by applying panel vector autoregression (PVAR) and impulse response function analyses to data on energy consumption (and its subcomponents), carbon dioxide emissions and real GDP in 106 countries classified by different income groups over the period 1971–2011. Our results reveal that the effects of the various types of energy consumption on economic growth and emissions are heterogeneous on the various groups of countries. Moreover, causality between total economic growth and energy consumption is bidirectional, thus making a case for the feed-back hypothesis. However, we cannot report any statistically significant evidence that renewable energy consumption, in particular, is conducive to economic growth, a fact that weakens the argument that renewable energy consumption is able to promote growth in a more efficient and environmentally sustainable way. Finally, in analysing the case for an inverted U-shaped EKC, we find that the continued process of growth aggravates the greenhouse gas emissions phenomenon. In this regard, we cannot provide any evidence that developed countries may actually grow-out of envi-ronmental pollution. In the light of these findings, the efficacy of recent government policies in various countries to promote renewable energy consumption as a means for sustainable growth is questioned. Put differently, there seems to be an ethical dilemma, between high economic growth rates and unsustainable environment and low or zero economic growth and environmental sustainability.
Keywords: Energy Consumption, Economic Growth, CO2 Emission, Panel Vector Auto Regression, Panel Impulse Response Function
1
Introduction
The increasing threat of global warming and climate change has been a major, worldwide, ongoing concern for more than two decades. It was in 1995 when the Intergovernmental Panel on Climate Change (IPCC) for the first time announced that “the balance of ev-idence suggests that there is a discernible human influence on global climate.” (IPCC, 1995, p. 22). Nevertheless, this statement acknowledged a number of uncertain and per-haps dubious – at the time - assertions and thus, these results were treated as tentative. More recently, though, the IPCC (2014) reported that global warming is being caused by the ever increasing concentration of greenhouse gases (GHG), as well as, other an-thropogenic activities. They maintain that the key factors that lead to increased GHG emissions are, among others, the economic activity and energy usage.
The link among energy consumption, emissions and economic growth has received con-siderable attention over the years by both policy makers and researchers, as the achieve-ment of sustainable economic growth has gradually become a major global concern. It should also be noted that interest in this field has been further escalated due to the rather intricate character of this particular nexus, both from a theoretical and an empirical per-spective.
The existing literature in this field can be classified under three strands. The first group consists of studies that investigate the causal links between energy consumption and economic growth (see, among others, Kraft and Kraft, 1978; Chiou-Wei et al., 2008; Chontanawat et al., 2008; Huang et al., 2008; Akinlo, 2009; Apergis and Payne, 2009b; Ghosh, 2009; Payne, 2010; Ozturk, 2010; Eggoh et al., 2011; Joyeux and Ripple, 2011; Chu and Chang, 2012; Dagher and Yacoubian, 2012; Abbas and Choudhury, 2013; Bozoklu and Yilanci, 2013; Dergiades et al., 2013; Yıldırım et al., 2014). The second group of studies concentrates its attention on the relationship between economic activity and emissions (e.g. Grossman and Krueger, 1991; Dinda, 2004; Stern, 2004; Kijima et al., 2010; Al-Mulali et al., 2015; Furuoka, 2015; Wang and Feng, 2015b). Finally, the third group of studies combines the two aforementioned relationships and thus uses a unified framework to identify the links among energy consumption, emissions and economic growth (e.g. Soytas et al., 2007; Ang, 2008; Apergis and Payne, 2009a; Soytas and Sari, 2009; Zhang and Cheng, 2009; Halicioglu, 2009; Wang et al., 2012b,a; Wang and Yang, 2015).
The main conclusion among the aforementioned studies in any of these three strands of the literature is that results are contested (a point discussed in more detail in the following section). Potential explanations for the conflicting results of previous studies could be, among others, due to the different time-periods and country-sample data used, different econometric approaches and/or the omitted variables bias. In addition, the majority of these studies are based on static and not dynamic analysis, on aggregated (total) data of energy consumption and/or focus on a small group of countries.
In this study, we attempt to shed more light into the intricate and complex relation-ships of the energy–growth–emissions nexus by accounting for the shortcomings of the existing literature. Thus, our contributions can be summarized as follows. First, we build
a very comprehensive dataset of energy consumption, economic growth and CO2
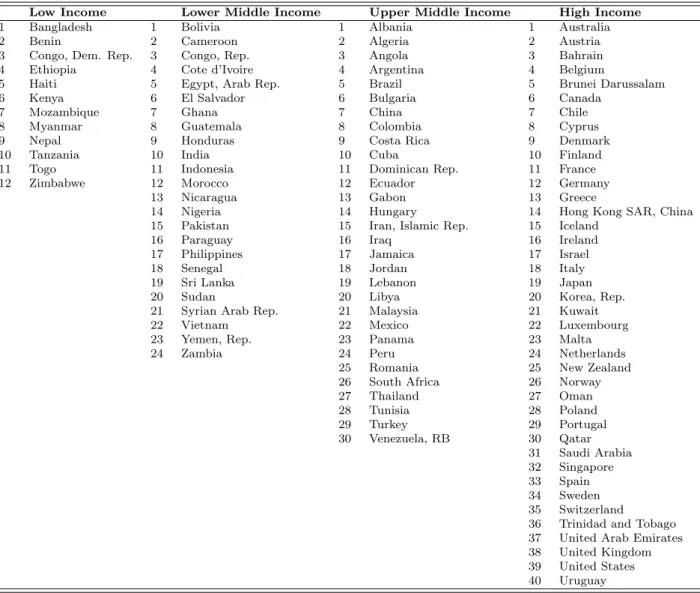
emis-sions consisting of 106 countries over the period 1971-2011. Second, we classify countries according to their level of development (i.e. low income, lower middle income, upper mid-dle income and high income) and control for any omitted variable bias by the inclusion of
control variables typically used in the neoclassical growth theory. Third, we disaggregate total energy consumption into 5 subcategories (i.e. electricity, oil, renewable, natural gas and coal energy consumption) in an attempt to examine whether the links between energy consumption, economic growth and emissions differ among the various sources of energy consumption. Finally, and most importantly, we examine the dynamic links between
our endogenous series (energy consumption, economic growth and CO2 emissions) using
a Panel Vector Auto Regression (PVAR) approach, originally developed by Holtz-Eakin
et al. (1988), along with panel impulse response functions.1
Panel VARs have been used to address a variety of issues of interest to applied macroe-conomists and policymakers, such as, business cycle convergence and cross sectional dy-namics (Canova et al., 2007; Canova and Ciccarelli, 2012), the construction of coincident or leading indicators of economic activity (Canova and Ciccarelli, 2009), financial de-velopment and dynamic investment behavior (Love and Zicchino, 2006a), housing price dynamics (Head et al., 2014) and exchange rate volatility dynamics (Grossmann et al., 2014), among others.
The advantages of using a PVAR methodology relative to methods previously used to
examine the relation between energy consumption, economic growth and CO2 emissions
are several. First, PVARs are extremely useful when there is little or ambiguous theoreti-cal information regarding the relationships among the variables to guide the specification of the model. Second, and more importantly, PVARs are explicitly designed to address the endogeneity problem, which is one of the most serious challenges of the empirical
research on energy consumption, economic growth and CO2 emissions. PVARs help to
alleviate the endogeneity problem by treating all variables as potentially endogenous and explicitly modeling the feedback effects across the variables. Thus, we use a generalised identification scheme in line with Koop et al. (1996), Pesaran and Shin (1998) and Diebold and Yilmaz (2012), in which the results are invariant to the ordering of the variables in the PVAR, unlike those under the Cholesky identification scheme. In the context of the present study, this is particularly important since it is hard, if not impossible, to justify
one particular ordering between the energy consumption, economic growth and CO2
emis-sions. Put differently, shocks are highly intertwined, and this feature is very well captured by the generalised PVAR framework that we employ. Third, impulse response functions based on PVARs can account for any delayed effects on and of the variables under con-sideration and thus determine whether the effects between energy consumption, economic
growth and CO2 emissions are short–run, long–run or both. Such dynamic effects would
not have been captured by panel regressions. We thus conduct panel impulse response function analysis so as to examine both the short-run and the long-run interdependen-cies in the energy–growth–emissions nexus. Fourth, PVARs allow us to include country fixed-effects that capture time-invariant components that may affect energy consumption and growth, and global time effects that affect all countries in the same period. Fifth, time fixed-effects can also be added to account for any global (macroeconomic) shocks that may affect all countries in the same way. Both time and country fixed-effects are included in our analysis. Last but not least, PVARs can be effectively employed with relative short-time series due to the efficiency gained from the cross-sectional dimension. Our findings suggest that the effects of the various types of energy consumption on eco-1For a recent survey on PVARs, readers are referred to study of Canova and Ciccarelli (2013).
nomic growth and CO2 emissions are heterogeneous across the various groups of countries
and sources of energy consumption. In particular, despite causality between economic growth and energy consumption being bidirectional in the case of the full sample of coun-tries and of total energy consumption (i.e. evidence for the feedback hypothesis), the same does not hold true for all sub-sources of energy consumption and country income group-ings. For instance, the feedback hypothesis is only supported for oil energy consumption (in the lower middle, upper middle and high income countries) and to a lower extent for electricity energy consumption (only in lower middle income countries), while no signif-icance evidence of the feedback hypothesis is documented for renewable energy, natural gas and coal energy consumption. Importantly, our findings do not point to any statis-tically significant evidence that renewable energy consumption in particular is conducive to economic growth, a fact that weakens the argument that renewable energy consump-tion is able to promote growth in a more efficient and environmentally sustainable way. Finally, in analysing the case for an environmental Kuznets curve (EKC), we find that the continued process of growth aggravates the greenhouse gas emissions phenomenon. Put differently, CO2 emissions increase with the level of development. In this regard, our findings do not provide any evidence that developed countries may actually grow-out of environmental pollution.
In the light of these findings, the efficacy of recent government policies in various countries to promote renewable energy consumption as a means for sustainable growth is questioned. At the same time, it puts forward the argument that perhaps decisions should be made not on the basis of how developed societies may sustain current levels of growth by employing renewable energy consumption strategies (as this might in fact be an infeasible approach in the long run), but rather, to concentrate on more communally just ways and ideas of social conduct such as the ones endorsed by the process of de-growth or a-de-growth. Put differently, there seems to be an ethical dilemma, between high economic growth rates and unsustainable environment and low or zero economic growth and environmental sustainability. Interesting avenues for future research might include the investigation of other pollutants in order to get a more complete picture of the effects of energy consumption and growth on the environment.
The rest of this paper is organised as follows: Section discusses the key related studies in this field. Section 3 describes the data used and the econometric models employed. Section 4 presents the empirical results. Section 5 concludes the paper and discusses potential avenues for further research.
2
Brief Literature Review
Although literature in this area is very crowded, the aim of this section is not to provide a comprehensive review of the related studies but rather to highlight their key findings.
In short, there are three main groups of studies under this line of research. The first group comprises those studies that investigate the causal links between energy consump-tion and economic growth and it was initiated by Kraft and Kraft (1978). A rather complete review of the related literature can be found in Payne (2010), Ozturk (2010), Abbas and Choudhury (2013) and Yıldırım et al. (2014). Existing work in this group of study does not provide a single interpretation to describe the aforementioned
relation-ship, but rather, four alternative hypotheses: i) the growth hypothesis, ii) the conservation hypothesis, iii) the feedback hypothesis and iv) the neutrality hypothesis.
The growth hypothesis is supported when there is evidence of unidirectional causality running from energy consumption to economic growth. In such case, energy consumption plays an important direct role in the process of economic growth and/or as a comple-ment to capital and labor, and thus energy conservation policies aiming at protecting the environment are expected to erode the process of economic growth. The conservation hypothesis is verified when there is unidirectional causality flowing from economic growth to energy consumption. If the latter hypothesis prevails, then energy conservation
poli-cies can be implemented to reduce carbon dioxide (CO2) emissions and global warming
without negatively affecting the process of economic growth. The feedback hypothesis postulates a bi–directional causality between energy consumption and economic growth. In this case, energy policies should be carefully regulated, as one sided policy selection is harmful for economic growth or ecological balance and budget for energy consumption. Finally, the neutrality hypothesis suggests no causality between energy consumption and economic growth, and as such, conservation policies devoted to reducing energy consump-tion will not have any influence on economic growth.
Studies in this area mainly focus on the total energy consumptions and on particular groups of countries (e.g. South Asia, G7, Central America, etc.), although some stud-ies disentangle the energy usage by energy source, such as, electricity, coal, nuclear and renewables (see, for example, Chiou-Wei et al., 2008; Akinlo, 2009; Apergis and Payne, 2009b; Ghosh, 2009; Eggoh et al., 2011; Chu and Chang, 2012; Dagher and Yacoubian, 2012; Abbas and Choudhury, 2013; Bozoklu and Yilanci, 2013; Dergiades et al., 2013; Yıldırım et al., 2014). Furthermore, there are studies that assess whether the level of
development or income plays a role in the energy-growth nexus (see, inter alia,
Chon-tanawat et al., 2008; Huang et al., 2008; Joyeux and Ripple, 2011), reporting different results among developed and developing countries or countries that belong to different income groups.
The second group of studies concentrates its attention on the relationship between economic activity and emissions. These studies are fuelled by the Environment Kuznets Curve (EKC) hypothesis, which was developed in the 1950s and 1960s. The seminal paper by Grossman and Krueger (1991) paved the way for the empirical testing of the EKC theory and allowed numerous studies to explore linear and non–linear relationships
between economic activity and emissions. Dinda (2004), Stern (2004), Kijima et al.
(2010), Furuoka (2015) and Al-Mulali et al. (2015) provide an exhaustive list of studies in this strand of the literature. Findings are once again inconclusive and country or region specific, as in the case of the energy–growth relationship.
The third group of studies combines the two aforementioned relationships and thus uses a unified framework to identify the links among energy consumptions, emissions and economic growth. Despite the fact that is a relatively new area of study (early studies in this area include those by Soytas et al., 2007; Ang, 2008; Apergis and Payne, 2009a; Soytas and Sari, 2009; Zhang and Cheng, 2009; Halicioglu, 2009), a wealth of literature has emerged, given its importance to policy makers. Table 1 presents some of the most recent studies.
As suggested in Table 1, it is not a surprise that even in this more holistic approach, results remain conflicting and often contradicting among the different studies. It is worth noting that the majority of these studies provide evidence based on total energy con-sumption and focusing on small groups of countries (e.g. ASEAN, BRICS, etc.). On a parallel note, it is perhaps not surprising that the nexus among economic activity, energy consumption and environmental waste has received considerable attention in developing economies in which the continuing development of the secondary sector has caused major environmental concerns and has stressed the necessity to identify efficient ways of energy consumption and growth (see, for example, Zhang, 2003; Wang et al., 2015; Wang and Feng, 2015a; Zhang and Wang, 2014).
As pointed out by Stern and Common (2001), Toman and Jemelkova (2003), Dinda (2004), Stern (2004) and Yang and Zhao (2014), among others, the fact that a consen-sus has not been reached in any of the three strands of the literature could be due to the different data that have been used, the different econometric approaches but more importantly due to the omitted variables bias, among other reasons.
3
Empirical methodology
3.1
Data
In this study we collect annual data from the World Development Indicators database
maintained by the World Bank2 for real GDP per capita (in 2005 US$) and CO2
emis-sions (metric tones per capita) for 106 countries (see Table 2) between 1971–2011. CO2
emissions for 2011 are supplemented by Emissions Database for Global Atmospheric Re-search (EDGAR). In addition, we collect from the International Energy Association (IEA) for final consumption of total energy consumption along with its 5 subcomponents i) elec-tricity, ii) oil, iii) renewable, iv) gas and v) coal energy consumption (each measured in
kilotons of oil equivalent per capita) over the period 1971–2011.3
[Insert Table 2 here]
In table 2 and Figure 1, which present the aforementioned series, it becomes clear that, overtime, economic development (indicated by higher income) is associated with an increasingly higher share of environmentally pollutant energy consumption sources. For instance, high income countries have the highest share of oil and coal energy consumption (the most pollutant energy sources), while the share of renewable energy consumption (an environmental-friendly energy source) declines as country income increases. The only exception is for gas consumption (a relatively pollutant-free source of energy consump-tion), with its share rising as country income increases. These developments pose several questions about environmental sustainability and pollution, as well as their impact on economic growth across countries with different economic development. Thus, the
in-vestigation of the causal linkages among alternative sources of energy consumption, CO2
2The database was accessed on March 25, 2014.
3We have ensured that in the construction of the aforementioned 5 subcategories of energy consumption there is not any double-counting (i.e. overlapping).
emissions and economic growth across countries of different income groups is of paramount importance and which we explore in detail below.
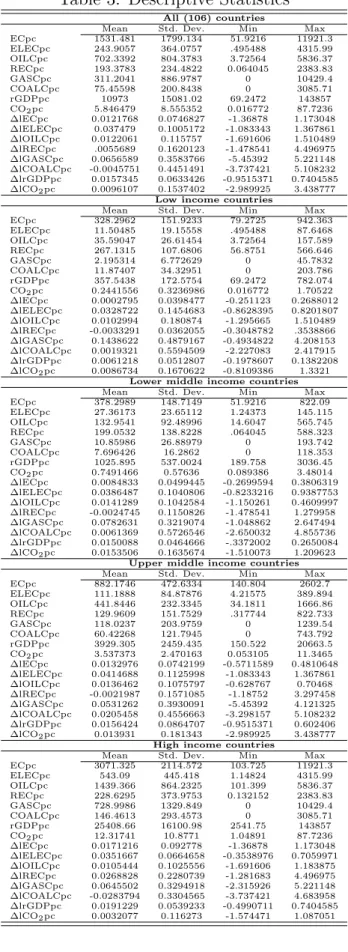
[Insert Figure 1 here] [Insert Table 3 here]
3.2
Panel unit root tests
The first step for the investigation of causality is to determine whether the series has any integration orders. For this purpose, this study employs panel unit root tests developed by Levin et al. (2002) (hereafter LLC) and Im et al. (2003) (hereafter IPS).
The LLC (2002) unit root test considers the following panel ADF specification:
∆ lnYit=ρiYit−1+
pi
X
j=1
δi,j∆ lnYit−j +εit, (1)
where Yit is a vector of our key endogenous variables: energy consumption per capita
growth, CO2 emissions per capita growth and real GDP per capita growth.
The LLC (2002) assumes that the persistence parametersρi are identical across
cross-sections (i.e., ρi = ρ for all i), whereas the lag order pi may freely vary. This procedure
tests the null hypothesis ρi = 0 for all i against the alternative hypothesis ρi <0 for all
i. Rejection of the null hypothesis indicates a possible panel integration process.
The IPS (2003) test, which is also based on Eq. (1), differs from the LLC test by
assuming ρi to be heterogeneous across cross–sections. The IPS tests the null hypothesis
H0: ρi < 0 against the alternative hypothesis H1: ρi < 0, (i = 1, ..., N1); ρi = 0,
(i = N1, ..., N) for all i. Acceptance of the alternative hypothesis allows the individual
series to be integrated.
The LLC and IPS tests were executed on data both in levels and first differences of the natural logarithms, and results were reported in Table 4. It is evident that all of the variables are stationary in first differences, while the level results indicate the presence of a unit root.
[Insert Table 4 here]
3.3
Panel Granger–causality
Next we examine the direction of causality among GDP per capita growth, energy (and
its subcomponents) per capita consumption growth and CO2 emissions per capita growth
in a panel context. The Granger causality test is as follows:
∆ lnGit = α1t+ mlGi X l=1 β1i,l∆ lnGit−l+ mlECi X l=1 γ1i,l∆ lnECit−1+ mlCO2i X l=1 δ1i,l∆ lnCO2it−l+ε1it ∆ lnECit = α2t+ mlGi X l=1 β2i,l∆ lnGit−l+ mlECi X l=1 γ2i,l∆ lnECit−1+ mlCO2i X l=1 δ2i,l∆ lnCO2it−l+ε2it
∆ lnCO2it = α3t+ mlGi X l=1 β3i,l∆ lnGit−l+ mlECi X l=1 γ3i,l∆ lnECit−1+ mlCO2i X l=1 δ3i,l∆ lnCO2it−l+ε3it(2),
where indexi refers to the country (see Table 2),t to the time period (t= 1, ..., T) andl
to the lag. ∆ lnGdenotes the real GDP per capita growth, ∆ lnEC denotes energy (and
its subcomponents) per capita consumption growth, and ∆ lnCO2 denotes CO2 emission
per capita growth, andε1it, ε2it and ε3it are supposed to be white-noise errors.
According to model (2), for instance, in country group i there is Granger causality
running only fromEC toG if in the first equation not all γ1i’s are zero but all β1i’s and
δ1i are zero. The Chi2 statistic tests the null of no causal relationship for any of the
cross-section units, against the alternative hypothesis that causal relationships occur for at least one subgroup of the panel. Rejection of the null hypothesis indicates that e.g.
EC Granger causes Gfor all i.
3.4
Panel VAR approach
The PVAR methodology, originally developed by Holtz-Eakin et al. (1988), combines the traditional VAR approach, which treats all the variables in the system as endogenous, with the panel-data approach, which allows for unobserved individual heterogeneity. In its general form, our model can be written as follows:
∆ lnYit =A0+A1∆ lnYit−1+A2∆ lnYit−2+...+Aj∆ lnYit−j+BXit+µi+λt+εit (3)
whereYit is a 1×3 vector of our three key endogenous variables, namely: (i) energy
con-sumption per capita growth, (ii) CO2 emissions per capita growth and (iii) real GDP per
capita growth. ∆ ln denotes the first difference of the natural logarithm. The
autoregres-sive structure allows all endogenous variables to enter the model with a number ofj lags.
The optimal lag-length is determined by the Akaike Information Criterion (AIC) and the
Bayesian Information Criterion (BIC). Xit is a 1×3 vector of the exogenous variables
(commonly used in endogenous growth models) comprising: (i) labour force participation rate, capturing labour input, (ii) gross fixed capital formation as a % of GDP, measuring capital input, and (iii) imports plus exports over GDP, capturing the degree of openness. The inclusion of these control variables is to avoid any potential omitted variable bias.
The advantage of the PVAR is the same as the advantage of any panel approach; i.e.,
it allows for the explicit inclusion of country fixed-effects in the model, denotedµi, which
capture all unobservable time-invariant factors at a country level. This is important for our purposes as inclusion of these fixed-effects allows each country to have a country specific level of each of the factors in the model, and, in addition, to capture other time-invariant factors, such as country size. However, inclusion of country fixed-effects presents an estimation challenge, which arises in any model which includes lags of the dependent variables: the fixed-effects are correlated with the regressors and, therefore, the mean– differencing procedure commonly used to eliminate country fixed effects would create biased coefficients. To avoid this problem we use forward mean-differencing, also referred to as the ‘Helmert procedure’ (Arellano and Bover, 1995). This procedure removes only the forward mean, i.e., the mean of all the future observations available for each country-year. This transformation preserves the orthogonality between transformed variables and
lagged regressors, which allows us to use lagged regressors as instruments and estimate the coefficients by system GMM. Our PVAR estimation routine follows Holtz-Eakin et al.
(1988) and Love and Zicchino (2006b).4
Another benefit of the panel data is to allow for time fixed effects,λt, which are added
to model (3) to capture any global (macroeconomic) shocks that may affect all countries in the same way. For example, time fixed effects capture common factors such as key global risk factors. To deal with the time fixed effects, we time difference all the variables prior to inclusion in the model, which is equivalent to putting time dummies in the system.
The prime benefit of the PVAR is to allow the evaluation of the effect of the orthog-onal shocks i.e., the impact of a shock of one variable on another variable, while keeping all other variables constant. This is accomplished with the use of panel impulse-response functions, which identify the reaction of one variable to the innovations in another vari-able in the system, while holding all other shocks equal to zero. However, since (i) the actual variance-covariance matrix of the errors is unlikely to be diagonal (e.g. errors are correlated), (ii) the results of the panel Granger causality tests revealed multidirectional causality among our variables and (iii) given that any particular particular ordering of the variables in our PVAR model would be hard to justify, we use generalised PVAR framework (in the spirit of Koop et al., 1996; Pesaran and Shin, 1998), in which forecast error variance decompositions are invariant to the ordering of the variables.
In order to get a more complete picture of the dynamic interactions among energy
con-sumption, economic growth and CO2 emissions, we perform a panel generalised
impulse-response function (PGIRF) analysis, in order to assess the speed of adjustments to shocks originating in our aforementioned three variables. The panel generalised impulse response function analysis employed, which is based on Koop et al. (1996) and Pesaran and Shin (1998), provides a natural solution when theory does not provide a clear cut guidance on the identification of the aforementioned endogenous variables, as discussed above. More-over, the PGIRFs are also decomposed into the responses of shocks to specific variables by taking out from the PGIRFs the effects of shocks to all other variables (Koop et al., 1996), which gives us further insights into the transmission mechanisms of the energy-growth–emissions nexus.
4
Empirical findings
4.1
Panel causality tests
We begin our analysis by focusing on panel Granger causality tests, discussed in Section 3.3 above, among different groups of countries. In particular, we adopt World Banks classification of countries by virtue of their income, which basically entails five groups. These groups are (i) all countries, (ii) low income countries, (iii) lower-middle income countries, (iv) upper-middle income countries and (v) high income countries. What is more, in each panel, we consider 6 different types of energy consumption; namely, (i) total energy consumption (EC), (ii) electricity consumption (ELEC), (iii) oil consumption 4More recently, Love and Rima (2014) have employed the same approach to examine the impact of macroeconomic shocks on bank loan portfolio quality.
(OILC), (iv) renewable energy consumption (REC), (v) natural gas consumption (GASC), and (vi) coal consumption (COALC). Results are given by table 5.
[Insert Table 5 here]
According to these results, some interesting patterns are revealed. First, total energy consumption along with electricity and oil consumption Granger-cause economic growth in almost all country groupings, while renewable energy consumption does not Granger-cause
economic growth in any of the country groupings. Second, CO2 emissions Grnager-cause
economic growth only in the high income countries. Third, economic growth, in gen-eral, Granger-causes total energy (and it subcomponents) consumption in every country
grouping, while CO2 emissions Granger-cause total energy consumption, electricity and
oil consumption only in high income countries. Fourth, economic growth Granger-causes
CO2 emissions in all country groups apart from lower middle income countries. Fifth,
total energy consumption, electricity and oil consumption Granger-cause CO2 emissions
in lower middle income, upper middle income and high income countries, while
renew-able energy consumption, as expected, is pollutant free as it does not Granger-cause CO2
emissions across all country groups, apart from that in high income countries, albeit at
the 10% level of significance. Finally, the evidence of a three-way (i.e from EC to G,
EC to CO2, G to EC, G to CO2, CO2 to G and from CO2 to EC) Granger causality
in many of the country groups, motivates the use of generalised forecast error variance decomposition in our impulse response analysis below (for more details, please refer to the next section).
In particular, concentrating on the first column of Table 5 we are able to extract infor-mation relating to the effect of each type of energy consumption on economic growth. We notice that EC causes growth only in upper-middle and high income countries. However, this result is rather generic and fails to capture specific differences in energy consumption among the different country classifications. To this end, we proceed with decomposing our results into the various types of energy consumption. In turn, we notice that ELEC causes growth only in low and lower-middle income countries. On the other hand, OILC appears to cause growth in lower and upper-middle, as well as, high income countries. What is more, we cannot find any effect of REC on growth. Apparently, GASC causes growth only in the high income group. Finally, COALC causes growth only in the lower-middle
income countries. Adding CO2 emissions to our analysis (see columns two and three of
Table 5); we notice that CO2 emissions significantly drive growth in the high income
group. Furthermore, considering CO2 emissions and energy consumption in tandem, we
ascertain that growth in both the upper-middle and the high income countries is
signif-icantly driven both by CO2 emissions and energy consumption. On the basis of these
results, we provide evidence that causality runs from energy consumption to economic growth; although, as we show later in this section, causality between the two is rather bilateral. Apparently, this evidence holds considering most types of energy consumption, as well as, most groups of countries. Nonetheless, it should be emphasized that there is no direct statistically significant impact of REC on growth for any group of countries. Despite the fact that REC is a key factor for energy security and environmental sustain-ability, apparently, it does not promote growth. In this regard, we cannot report any causality running specifically from REC to growth for any of the groups. Our findings
further indicate that CO2 emissions appear to be an integral part of the growth process.
Overall, we provide evidence of the existence of a rather monotonically increasing EKC. This is also supported by Figure 2, which presents the EKC based on a scatter plot of
1971-2011 average values between real GDP per capita and CO2 emissions per capita.
In particular, it is evident from this figure that CO2 emissions increase with the level of
development.
[Insert Figure 2 here]
Turning to the effects of growth on the various types of energy consumption, initially we concentrate on the fourth column of Table 5. Obviously, statistically significant rela-tionships suggest that growth leads to the consumption of energy in almost all groups of countries and for any type of electricity consumption, with the exception of GASC and COALC. In other words, we find that, for most types of energy consumption and groups of countries, causality runs towards energy consumption as well. If we combine this piece of information with the results presented earlier in this section we can deduce that there
is in fact a strong case for thefeedback hypothesis of causality between energy
consump-tion and growth. Nevertheless, if we concentrate on REC, then we notice that causality
only runs from growth to REC implying that it is rather theconservation hypothesis
of causality which qualifies in the case of REC. The fifth column of Table 5 shows that
CO2 emissions are conducive to energy consumption in all high income countries, with
the exception of REC. Most importantly, considering the effects of both CO2 emissions
and growth on all types of energy consumption (i.e. column 6) we show that in lower, upper-middle and high income countries energy consumption is mainly caused by these effects.
Nevertheless, the picture becomes clearer when we look at the effects of growth and
energy consumption on CO2 emissions. In columns seven, eight and nine of Table 5, we
notice that with the exception of low income countries, the process of growth and energy
consumption has a statistically significant effect on CO2 emissions. Apparently, in this
group of countries, there can be no further growth without CO2 emissions. In addition,
looking closely at columns one and eight of Table 4, we notice that (REC) is not conducive
to growth and it does not produce any CO2 emissions. At the same time though, it is
obvious that in all groups of countries it is only the polluting types of energy consumption which lead to growth.
In the section that follows, we present impulse response functions (IRFs) per group of country in order to get a more complete picture regarding the interrelation of different types of energy and growth.
4.2
Impulse response functions
In this section, we present the results of the panel generalised impulse responses functions discussed in Section 3.4. We begin with the discussion of the results based on the full sample of countries and then examine whether the results differ among subgroups of countries classified according to their level of income.
Figure 3 presents the panel generalised impulse responses functions for the full sample of countries. On general principles, we find positive and statistically significant results that
are quite similar irrespective of the type of energy source, with the exception of REC. In particular, we notice that innovations in most types of energy consumption have a positive
impact on growth. The same holds true for the effect of CO2 emissions on growth. At
the same time, both growth and CO2 emissions have a positive effect on most types of
energy consumption. Finally, results show that growth, as well as, most types of energy
consumption positively affect CO2 emissions. With regard to REC, we can only report
that growth responds positively and statistically significantly only to CO2 emissions, while
the reverse is also true. We cannot report any statistically significant evidence that growth responds in any way to consumption of renewable energy. In addition, there is not any statistically significant indication that growth exerts positive impact on REC.
[Insert Figure 3 here]
With reference to the magnitude of the relevant statistically significant IRFs we find that a positive shock in COALC has a smaller impact on growth compared to other types of energy consumption. What is more, a positive change in economic growth exerts a smaller relative effect on both GASC and COALC. It is also worth noting that a positive
change in OILC has a stronger relative impact on CO2 emissions. At the same time, a
positive shock in CO2 emissions exercises a stronger relative impact on OILC.
These findings strengthen our initial view that growth is in fact closely linked to environmental pollution. However, in order to attain a better understanding, it would be instructive at this point to investigate IRFs by group of country. First we turn to low income countries. Results relating to IRFs in low income countries are presented in Figure 4.
[Insert Figure 4 here]
We notice that as in the case of the full sample of countries all statistically significant effects are positive. What is more, we find that REC, GASC, as well as, COALC, do
not have any effects on either growth or CO2 emissions. At the same time, these three
sources of energy do not appear to influence CO2 emissions as well. On a final note it is
perhaps not surprising for this particular type of country considering the EKC hypothesis
that growth has a statistically significant impact on CO2 emissions. This is actually true
irrespective of the type of energy consumption under consideration.
Turning to the magnitude of statistically significant IRFs we notice that compared to its effects on any other type of energy consumption, a positive shock in economic growth has a very strong positive impact on OILC. Furthermore, compared to other types of
energy consumption, CO2 emissions appear to have a very strong impact on OILC, while
in the case of COALC a positive change in economic growth has a very strong relative
impact on CO2 emissions.
Next, we focus on lower-middle income countries. Results are shown in Figure 5. [Insert Figure 5 here]
Prominent among our results is the fact that COALC aside, all other types of energy consumption appear to exert positive impact on growth. Nonetheless, it should be noted that effects from both REC and GASC on growth are barely statistically significant.
It is also worth mentioning that for this specific group of countries REC also responds positively to a positive shock in growth; however this response is relatively short-lived. Finally, evidence shows that there is no significant effect of growth on GASC.
The magnitude of the statistically significant IRFs for this particular group of countries - illustrated in Figure 5 - reveals that a positive change in ELEC has a stronger relative impact on economic growth, while, at the same time, economic growth appears to have a stronger relative impact on both ELEC and OILC. We also notice that, in contrast with
all other types of energy consumption, positive changes in CO2 emissions have a stronger
impact on OILC, while the reverse is also true.
We then concentrate on upper-middle income countries. Results are displayed on Figure 6.
[Insert Figure 6 here]
Similarly to the previous group, growth does not seem to receive any significant effect from REC, GASC, as well as, COALC; although with the exception of REC, both GASC and COALC respond positively to positive changes in growth. Furthermore, for all types
of energy consumption growth appears to be conducive to CO2 emissions. Consistent
with results reported for all other groups of countries, positive changes in REC do not
trigger any responses from CO2 emissions.
As far as the magnitude of the statistically significant IRFs for this group of countries is concerned, we observe that positive changes in economic growth have a stronger relative impact on both ELEC and OILC. It should also be noted that in the case of COALC,
economic growth has a stronger relative impact on CO2 emissions. What is more, as has
already been noted for all of the previous groups of countries, positive changes in CO2
emissions have a stronger relative impact on OILC, while the reverse is also true.
Finally, we consider high income countries. The results for this group of countries are presented in Figure 7.
[Insert Figure 7 here]
As far as the effects on growth are concerned, we cannot really report any significant differences to all other cases. In particular, we notice that equally to all other groups of countries, changes in REC and COALC do not have a statistically significant effect on growth. Apparently, for high income countries, GASC is significantly affecting growth. Finally, as in all previous cases considering all different groups of countries and all types
of energy consumption, growth statistically significantly affects CO2 emissions.
With regard to the magnitude of the statistically significant IRFs of this particular group of countries we notice that a positive shock in ELEC exerts a stronger effect on economic growth compared to shocks in other types of energy consumption. As has been previously reported, in the case of COALC, economic growth has a stronger relative
im-pact on CO2 emissions. What is more, the relationship between CO2 emissions and OILC
appears to be again bidirectional and greater in magnitude compared to the relationship
between CO2 emissions and other sources of energy consumption. On a final note, positive
changes in economic growth have a relatively stronger impact on OILC.
Summarising these results we are able to draw very useful conclusions. To begin with, it is important to note that IRFs reflect positive statistically significant responses of all
the variables of the system to respective innovations. Furthermore, responses appear to be quite similar among the groups. It should be noted though, that if we consider the magnitude of these responses, we notice that there are certain differences among the
various groups of countries. In turn, we notice that growth is conducive to CO2 emissions
and this is true irrespective of the particular group of country under investigation. What is also true for all groups of countries is the fact that COALC is losing its importance as an energy source. This could be indicative of a recent trend in both developed and developing countries to produce oil and natural gas via the method of fracking as opposed to the emission-intensive source of coal (see, inter alia Howarth et al., 2011; Yang et al., 2012; Chen and Golley, 2014). A final issue that deserves mention is that focusing on the REC-growth nexus, IRFs indicate that REC does not instigate growth in any of the groups under investigation. Findings relating to REC are in line with Ocal and Aslan (2013) who report that there is negative impact of REC on economic growth. What is more, Ocal and Aslan (2013) provide evidence in support of the conservation hypothesis, while at the same time, they stress the fact that renewable energy is an expensive energy resource especially for developing countries. Re-iterating a point made in the previous section,
these results pose a criticism of the inverted U-shaped EKC. To be more explicit,
according to our results, countries cannot simply grow out of environmental pollution, as, apparently, the process of growth even at advanced stages of economic development inevitably entails the degradation of the physical environment.
Furthermore, these findings question the efficacy of government policies initiated in various countries to the effect that REC can be promoted as a substitute for non-renewable sources of energy, sufficient to promote growth. Such policies might include, among others, tax credits for the production of renewable energy, certain reimbursements for installing renewable energy systems, as well as, the establishment of a market for renewable en-ergy certificates (see Apergis and Payne, 2012, 2014). In the light of our findings, should greater use of renewable energy sources be promoted in countries who plan to sustain their current growth pace? Arguably, REC is important when the discussion revolves around the sustainability of the environment, the necessity for fewer greenhouse gas emis-sions or even the dependency of some nations on imports of energy; however, is there a case for any group of countries to adopt REC-intensive technologies when the goal is unrelenting growth? Dincer (2000) investigating the relationship between renewable en-ergy and sustainable development puts forward the argument that – although sustainable development should be predicated upon the unremitting supply of energy deriving from renewable resources – additional research and development is required to the effect that the actual economic and environmental benefits of renewable energy resources can be more accurately assessed.
In many respects, our findings manage to steer the discussion towards the very topical issue of whether societies should impose limits to growth or not. According to authors such as Galli et al. (2012), Hoekstra and Wiedmann (2014), as well as, Weinzettel et al. (2014)
the currentenvironmental footprint poses a material challenge to the capacity of the
natural environment to assimilate waste. Decomposing environmental footprint into its main elements, these authors argue that overproduction in developed societies results not only to higher greenhouse gas emissions (i.e. carbon footprint) and depletion of fresh water resources (i.e. water footprint), but also, to an over-exploitation of biologically productive
land in general (i.e. ecological footprint). In this regard, it is of cardinal importance for current generations to carefully decide upon the desired path of sustainable growth. This discussion is also closely related to the rebound effect argument, according to which even more efficient and more energy-saving technologies do not necessarily lead to reduced energy consumption and thus do not necessarily alleviate environmental concerns (see, inter alia, Bentzen, 2004; Jin, 2007; Sorrell and Dimitropoulos, 2008; Wang et al., 2014a,b). By all accounts, achieving sustainable growth appears to be a rather cumbersome task.
Thought provokingly, the answer may not even be that of sustainable growth. To be more explicit, findings give outright prominence to alternative paradigms, such as
those of degrowth and a-growth. With regard to degrowth, (Kallis, 2011, p. 874)
ex-plains that this is ‘a socially sustainable and equitable reduction of society’s throughput’. Throughput, defined by Daly (1996) as the material and energy required by contemporary societies for the production, distribution, as well as, consumption of goods and assimila-tion of waste, has to be reduced in order for environmental degradaassimila-tion to be kept within specific limits and to start decelerating (Kallis, 2011). It follows that degrowth, contrary to sustainable growth, cannot occur within a framework of rising GDP. The paradigm of a-growth, on the other hand, can be described as even more radical one, as it implies that societies should concentrate solely on rigorous environmental policies disregarding the effects this might have on the future levels of GDP (van den Bergh, 2011).
Although a thorough analysis of both degrowth and a-growth falls beyond the scope of this study, it should be noted that these concepts are particularly complex, as they involve a generalised deviation from the standard practices of the capitalist economy which qualify GDP as a suitable measure of social welfare (van den Bergh, 2011; van den Bergh and Kallis, 2012; Bauhardt, 2014; Buch-Hansen, 2014; Videira et al., 2014). Nonetheless, both paradigms should be emphasized as alternative routes to current production patterns, particularly in the absence of the inverted U-shaped EKC.
In retrospect, we provide evidence that causality between growth and energy
con-sumption runs both ways; that is, we provide evidence that the feedback hypothesis
of causality is in play. If however, we focus specifically on causality between REC and
growth we find that it is rather the conservation hypothesis which best describes the
state of this particular affair. In this respect, our findings contradict Apergis and Payne (2012) who opine that both non-renewable and renewable sources of energy are conducive to economic growth and that there is in fact a high degree of substitutability between the two types. With reference to specific types of energy we notice that OILC and GASC are significant factors of growth especially for middle and high income countries. At the same time, COALC does not appear to be a significant driver of growth in these countries. Prominent among our results though, is the fact that economic growth is closely linked to the greenhouse effect (see column seven of Table 4), strongly suggesting that we could not argue in favour of the inverted U-shaped EKC hypothesis. In this regard, countries
are faced with a ethical dilemma on whether or not they should promote REC given
that on one hand, it promotes environmental sustainability, but on the other, it does not promote growth.
5
Summary and concluding remarks
In this study, we investigate the complex and intricate linkages between economic growth,
energy consumption and CO2 emissions, for 106 countries which are classified into
dis-tinct groups in virtue of their income. In addition, energy consumption is decomposed into various types, including renewable energy consumption (REC), electricity consump-tion (ELEC), oil consumpconsump-tion (OILC), natural gas consumpconsump-tion (GASC) and coal con-sumption (COALC). We implement a PVAR approach along with panel impulse response functions in order to identify the direction of causality that characterises and explains developments in the aforementioned variables, as well as to examine the short-run and long-run effects of shocks originating in the aforementioned variables. In this regard, the main contribution of the study is the investigation of this particular nexus for different groups of countries and different types of energy consumption.
The underlying objectives of the study relate to the investigation (i) of whether our findings provide support for any of the existing hypotheses pertaining to the growth-energy consumption nexus; namely, the growth, the conservation, the feedback, as well as, the neutrality hypothesis, (ii) of whether there are any types of energy consumption which are not conducive to growth whatsoever, (iii) of the argument that REC can indeed constitute a reliable (in terms of its impact on the process of growth) substitute for non-renewable sources of energy, (iv) of the existence or not of the inverted U-shaped EKC.
Our findings suggest that the effects of the various types of energy consumption are heterogeneous on the various groups of countries. We also find that coal consumption is apparently losing its importance as an energy source. What is more, causality between economic growth and energy consumption is bidirectional, thus making a case for the feedback hypothesis. However, we cannot report any statistically significant evidence that renewable energy consumption in particular is conducive to economic growth, a fact that weakens the argument that renewable energy consumption is able to promote growth in a more efficient and environmentally sustainable way. Finally, in analysing the case for an inverted U-shaped EKC, we find that the continued process of growth aggravates the greenhouse gas emissions phenomenon. In this regard, we cannot provide any evidence that developed countries may actually grow-out of environmental pollution.
In the light of these findings, the efficacy of recent government policies in various countries to promote renewable energy consumption as a means for sustainable growth is questioned. At the same time, it is put forward the argument that perhaps decisions should be made not on the basis of how developed societies may sustain current levels of growth by employing renewable energy consumption strategies (as this might in fact be an infeasible approach in the long run), but rather, to concentrate on more communally just ways and ideas of social conduct such as the ones endorsed by the process of de-growth or a-de-growth. Put differently, there seems to be an ethical dilemma, between high economic growth rates and unsustainable environment and low or zero economic growth and environmental sustainability. Interesting avenues for future research might include the investigation of other pollutants in order to get a more complete picture of the effects of energy consumption and growth on the environment.
Acknowledgements
We would like to thank the editor (Lawrence Kazmerski) and two anonymous reviewers for very insightful comments and suggestions on a previous version of this paper. The usual disclaimer applies.
References
Abbas, F., Choudhury, N., 2013. Electricity consumption-economic growth nexus: an
aggregated and disaggregated causality analysis in India and Pakistan.Journal of Policy
Modeling 35 (4), 538–553.
Akinlo, A. E., 2009. Electricity consumption and economic growth in Nigeria: evidence
from cointegration and co-feature analysis.Journal of Policy Modeling 31 (5), 681–693.
Al-Mulali, U., Saboori, B., Ozturk, I., 2015. Investigating the environmental Kuznets
curve hypothesis in Vietnam. Energy Policy 76, 123–131.
Alam, M. J., Begum, I. A., Buysse, J., Van Huylenbroeck, G., 2012. Energy consump-tion, carbon emissions and economic growth nexus in Bangladesh: Cointegration and
dynamic causality analysis. Energy Policy 45, 217–225.
Alshehry, A. S., Belloumi, M., 2015. Energy consumption, carbon dioxide emissions and
economic growth: The case of Saudi Arabia.Renewable and Sustainable Energy Reviews
41, 237–247.
Ang, J. B., 2008. Economic development, pollutant emissions and energy consumption in
Malaysia. Journal of Policy Modeling 30 (2), 271–278.
Apergis, N., Payne, J. E., 2009a. Co2 emissions, energy usage, and output in Central
America. Energy Policy 37 (8), 3282–3286.
Apergis, N., Payne, J. E., 2009b. Energy consumption and economic growth in Central
America: evidence from a panel cointegration and error correction model. Energy
Eco-nomics 31 (2), 211–216.
Apergis, N., Payne, J. E., 2012. Renewable and non-renewable energy
consumption-growth nexus: Evidence from a panel error correction model.Energy Economics 34 (3),
733–738.
Apergis, N., Payne, J. E., 2014. Renewable energy, output, Co2 emissions, and fossil fuel prices in Central America: Evidence from a nonlinear panel smooth transition vector
error correction model. Energy Economics 42 (C), 226–232.
Apergis, N., Payne, J. E., Menyah, K., Wolde-Rufael, Y., 2010. On the causal dynamics
between emissions, nuclear energy, renewable energy, and economic growth. Ecological
Economics 69 (11), 2255–2260.
Arellano, M., Bover, O., July 1995. Another look at the instrumental variable estimation
of error-components models. Journal of Econometrics 68 (1), 29–51.
Bauhardt, C., 2014. Solutions to the crisis? The Green New Deal, Degrowth, and the Solidarity Economy: Alternatives to the capitalist growth economy from an ecofeminist
economics perspective. Ecological Economics 102, 60–68.
Begum, R. A., Sohag, K., Abdullah, S. M. S., Jaafar, M., 2015. C02 emissions, energy
consumption, economic and population growth in Malaysia.Renewable and Sustainable
Bentzen, J., 2004. Estimating the rebound effect in US manufacturing energy
consump-tion. Energy economics 26 (1), 123–134.
Bozoklu, S., Yilanci, V., 2013. Energy consumption and economic growth for selected OECD countries: Further evidence from the Granger causality test in the frequency
domain. Energy Policy 63, 877–881.
Buch-Hansen, H., 2014. Capitalist diversity and de-growth trajectories to steady-state
economies. Ecological Economics 106 (C), 167–173.
Canova, F., Ciccarelli, M., 2009. Estimating multicountry var models.International
Eco-nomic Review 50 (3), 929–959.
Canova, F., Ciccarelli, M., 2012. Clubmed? Cyclical fluctuations in the Mediterranean
basin. Journal of International Economics 88 (1), 162–175.
Canova, F., Ciccarelli, M., 2013. Panel Vector Autoregressive Models: A Survey. Ch. 12,
pp. 205–246.
Canova, F., Ciccarelli, M., Ortega, E., 2007. Similarities and convergence in G-7 cycles.
Journal of Monetary Economics 54 (3), 850–878.
Chang, C.-C., 2010. A multivariate causality test of carbon dioxide emissions, energy
consumption and economic growth in China. Applied Energy 87 (11), 3533–3537.
Chen, S., Golley, J., 2014. ‘Green’ productivity growth in China’s industrial economy.
Energy Economics 44 (C), 89–98.
Chiou-Wei, S. Z., Chen, C.-F., Zhu, Z., 2008. Economic growth and energy
consump-tion revisited–evidence from linear and nonlinear Granger causality.Energy Economics
30 (6), 3063–3076.
Chontanawat, J., Hunt, L. C., Pierse, R., 2008. Does energy consumption cause economic
growth? Evidence from a systematic study of over 100 countries. Journal of Policy
Modeling 30 (2), 209–220.
Chu, H.-P., Chang, T., 2012. Nuclear energy consumption, oil consumption and economic
growth in G–6 countries: Bootstrap panel causality test. Energy Policy 48, 762–769.
Cowan, W. N., Chang, T., Inglesi-Lotz, R., Gupta, R., 2014. The nexus of electricity
consumption, economic growth and Co2 emissions in the BRICS countries. Energy
Policy 66, 359–368.
Dagher, L., Yacoubian, T., 2012. The causal relationship between energy consumption
and economic growth in Lebanon. Energy policy 50, 795–801.
Dergiades, T., Martinopoulos, G., Tsoulfidis, L., 2013. Energy consumption and economic
growth: Parametric and non–parametric causality testing for the case of Greece.Energy
Economics 36, 686–697.
Diebold, F. X., Yilmaz, K., 2012. Better to Give than to Receive: Predictive Directional Measurement of Volatility Spillovers. International Journal of Forecasting 28 (1), 57–66.
Dincer, I., 2000. Renewable energy and sustainable development: a crucial review.
Re-newable and Sustainable Energy Reviews 4 (2), 157–175.
Dinda, S., 2004. Environmental kuznets curve hypothesis: a survey.Ecological economics
49 (4), 431–455.
Eggoh, J. C., Bangak´e, C., Rault, C., 2011. Energy consumption and economic growth
revisited in African countries. Energy Policy 39 (11), 7408–7421.
Farhani, S., Chaibi, A., Rault, C., 2014. C02 emissions, output, energy consumption, and
Furuoka, F., 2015. The Co2 emissions–development nexus revisited. Renewable and
Sus-tainable Energy Reviews 51, 1256–1275.
Galli, A., Wiedmann, T., Ercin, E., Knoblauch, D., Ewing, B., Giljum, S., 2012. Integrat-ing Ecological, Carbon and Water footprint into a “Footprint Family” of indicators:
Definition and role in tracking human pressure on the planet. Ecological Indicators 16,
100–112.
Ghosh, S., 2009. Electricity supply, employment and real gdp in India: evidence from
cointegration and granger-causality tests. Energy Policy 37 (8), 2926–2929.
Govindaraju, V. C., Tang, C. F., 2013. The dynamic links between Co2 emissions,
eco-nomic growth and coal consumption in China and India.Applied Energy 104, 310–318.
Grossman, G. M., Krueger, A. B., 1991. Environmental impacts of the North American Free Trade Agreement. Tech. rep., NBER working paper.
Grossmann, A., Love, I., Orlov, A. G., 2014. The dynamics of exchange rate volatility:
A panel VAR approach. Journal of International Financial Markets, Institutions and
Money 33 (C), 1–27.
Halicioglu, F., 2009. An econometric study of co2 emissions, energy consumption, income
and foreign trade in Turkey. Energy Policy 37 (3), 1156–1164.
Head, A., Lloyd-Ellis, H., Sun, H., 2014. Search, liquidity, and the dynamics of house
prices and construction. American Economic Review 104 (4), 1172–1210.
Heidari, H., Katircio˘glu, S. T., Saeidpour, L., 2015. Economic growth, Co2 emissions, and
energy consumption in the five ASEAN countries. International Journal of Electrical Power & Energy Systems 64, 785–791.
Hoekstra, A. Y., Wiedmann, T. O., 2014. Humanity’s unsustainable environmental
foot-print. Science 344 (6188), 1114–1117.
Holtz-Eakin, D., Newey, W., Rosen, H. S., 1988. Estimating vector autoregressions with
panel data. Econometrica 56 (6), 1371–1395.
Howarth, R. W., Ingraffea, A., Engelder, T., 2011. Natural gas: Should fracking stop?
Nature 477, 271275.
Huang, B.-N., Hwang, M.-J., Yang, C. W., 2008. Causal relationship between energy
consumption and GDP growth revisited: a dynamic panel data approach. Ecological
economics 67 (1), 41–54.
Im, K. S., Pesaran, M. H., Shin, Y., 2003. Testing for unit roots in heterogeneous panels.
Journal of Econometrics 115 (1), 53–74.
IPCC, 1995. Ipcc second assessment - climate change 1995.
URL https://www.ipcc.ch/pdf/climate-changes-1995/ipcc-2nd-assessment/
2nd-assessment-en.pdf
IPCC, 2014. Climate change 2014, synthesis report, summary for policymakers.
URL https://www.ipcc.ch/pdf/assessment-report/ar5/syr/AR5_SYR_FINAL_
SPM.pdf
Jammazi, R., Aloui, C., 2015. On the interplay between energy consumption, economic growth and CO2 emission nexus in the GCC countries: A comparative analysis through
wavelet approaches. Renewable and Sustainable Energy Reviews 51, 1737–1751.
Jayanthakumaran, K., Verma, R., Liu, Y., 2012. Co2 emissions, energy consumption,
trade and income: a comparative analysis of China and India. Energy Policy 42, 450–
Jin, S.-H., 2007. The effectiveness of energy efficiency improvement in a developing
coun-try: Rebound effect of residential electricity use in South Korea.Energy Policy 35 (11),
5622–5629.
Joyeux, R., Ripple, R. D., 2011. Energy consumption and real income: a panel
cointegra-tion multi-country study. The Energy Journal 32 (2), 107.
Kallis, G., 2011. In defence of degrowth. Ecological Economics 70 (5), 873–880.
Kijima, M., Nishide, K., Ohyama, A., 2010. Economic models for the environmental
Kuznets curve: A survey. Journal of Economic Dynamics and Control 34 (7), 1187–
1201.
Koop, G., Pesaran, M. H., Potter, S. M., 1996. Impulse Response Analysis in Nonlinear
Multivariate Models. Journal of Econometrics 74 (1), 119–147.
Kraft, J., Kraft, A., 1978. Relationship between energy and GNP.
Levin, A., Lin, C.-F., James Chu, C.-S., 2002. Unit root tests in panel data: asymptotic
and finite-sample properties. Journal of Econometrics 108 (1), 1–24.
Long, X., Naminse, E. Y., Du, J., Zhuang, J., 2015. Nonrenewable energy, renewable energy, carbon dioxide emissions and economic growth in China from 1952 to 2012.
Renewable and Sustainable Energy Reviews 52, 680–688.
Love, I., Rima, T. A., 2014. Macro-financial linkages in egypt: A panel analysis of
eco-nomic shocks and loan portfolio quality. Journal of International Financial Markets,
Institutions and Money 28 (0), 158–181.
Love, I., Zicchino, L., 2006a. Financial development and dynamic investment behavior:
Evidence from panel VAR. The Quarterly Review of Economics and Finance 46 (2),
190–210.
Love, I., Zicchino, L., 2006b. Financial development and dynamic investment behavior:
Evidence from panel VAR. The Quarterly Review of Economics and Finance 46 (2),
190–210.
Ocal, O., Aslan, A., 2013. Renewable energy consumptioneconomic growth nexus in
Turkey. Renewable and Sustainable Energy Reviews 28, 494–499.
Ozcan, B., 2013. The nexus between carbon emissions, energy consumption and economic
growth in middle east countries: A panel data analysis. Energy Policy 62, 1138–1147.
Ozturk, I., 2010. A literature survey on energy–growth nexus. Energy policy 38 (1), 340–
349.
Ozturk, I., Acaravci, A., 2010. CO2 emissions, energy consumption and economic growth
in Turkey. Renewable and Sustainable Energy Reviews 14 (9), 3220–3225.
Pao, H.-T., Tsai, C.-M., 2010. Co2 emissions, energy consumption and economic growth
in BRIC countries. Energy Policy 38 (12), 7850–7860.
Payne, J. E., 2010. A survey of the electricity consumption-growth literature. Applied
energy 87 (3), 723–731.
Pesaran, H. H., Shin, Y., 1998. Generalized Impulse Response Analysis in Linear
Multi-variate Models. Economics Letters 58 (1), 17–29.
Saboori, B., Sulaiman, J., 2013. Co2 emissions, energy consumption and economic growth in Association of Southeast Asian Nations (ASEAN) countries: a cointegration
ap-proach. Energy 55, 813–822.
Salahuddin, M., Gow, J., 2014. Economic growth, energy consumption and Co2 emissions
Salahuddin, M., Gow, J., Ozturk, I., 2015. Is the long-run relationship between economic growth, electricity consumption, carbon dioxide emissions and financial development
in Gulf Cooperation Council Countries robust? Renewable and Sustainable Energy
Reviews 51, 317–326.
Sebri, M., Ben-Salha, O., 2014. On the causal dynamics between economic growth, re-newable energy consumption, Co2 emissions and trade openness: Fresh evidence from
BRICS countries. Renewable and Sustainable Energy Reviews 39, 14–23.
Shahbaz, M., Hye, Q. M. A., Tiwari, A. K., Leito, N. C., 2013. Economic growth, en-ergy consumption, financial development, international trade and CO2 emissions in
Indonesia. Renewable and Sustainable Energy Reviews 25, 109–121.
Sorrell, S., Dimitropoulos, J., 2008. The rebound effect: Microeconomic definitions,
limi-tations and extensions. Ecological Economics 65 (3), 636–649.
Soytas, U., Sari, R., 2009. Energy consumption, economic growth, and carbon emissions:
challenges faced by an EU candidate member. Ecological economics 68 (6), 1667–1675.
Soytas, U., Sari, R., Ewing, B. T., 2007. Energy consumption, income, and carbon
emis-sions in the United States. Ecological Economics 62 (3), 482–489.
Stern, D. I., 2004. The rise and fall of the environmental Kuznets curve. World
develop-ment 32 (8), 1419–1439.
Stern, D. I., Common, M. S., 2001. Is there an environmental kuznets curve for sulfur?
Journal of Environmental Economics and Management 41 (2), 162–178.
Toman, M. A., Jemelkova, B., 2003. Energy and economie development: An assessment
of the state of knowledge. The Energy Journal, 93–112.
van den Bergh, J. C., 2011. Environment versus growth – A criticism of “degrowth” and
a plea for “a-growth”. Ecological Economics 70 (5), 881–890.
van den Bergh, J. C. J. M., Kallis, G., 2012. Growth, A-Growth or Degrowth to Stay
within Planetary Boundaries? Journal of Economic Issues 46 (4), 909–920.
Videira, N., Schneider, F., Sekulova, F., Kallis, G., 2014. Improving understanding on
degrowth pathways: An exploratory study using collaborative causal models. Futures
55, 58–77.
Wang, Z., Feng, C., 2015a. A performance evaluation of the energy, environmental, and economic efficiency and productivity in China: An application of global data
envelop-ment analysis. Applied Energy 147, 617–626.
Wang, Z., Feng, C., 2015b. Sources of production inefficiency and productivity growth in
China: a global data envelopment analysis. Energy Economics 49, 380–389.
Wang, Z., Feng, C., Zhang, B., 2014a. An empirical analysis of China’s energy efficiency
from both static and dynamic perspectives. Energy 74, 322–330.
Wang, Z., Lu, M., Wang, J.-C., 2014b. Direct rebound effect on urban residential
electric-ity use: an empirical study in China. Renewable and Sustainable Energy Reviews 30,
124–132.
Wang, Z., Wang, C., Yin, J., 2015. Strategies for addressing climate change on the indus-trial level: affecting factors to CO2 emissions of energy-intensive industries in China.
Natural Hazards 75 (2), 303–317.
Wang, Z., Yang, L., 2015. Delinking indicators on regional industry development and
carbon emissions: Beijing–Tianjin–Hebei economic band case.Ecological Indicators 48,
Wang, Z., Yin, F., Zhang, Y., Zhang, X., 2012a. An empirical research on the influencing
factors of regional CO2 emissions: evidence from Beijing city, China. Applied Energy
100, 277–284.
Wang, Z.-H., Zeng, H.-L., Wei, Y.-M., Zhang, Y.-X., 2012b. Regional total factor energy
efficiency: an empirical analysis of industrial sector in china. Applied Energy 97, 115–
123.
Weinzettel, J., Steen-Olsen, K., Hertwich, E. G., Borucke, M., Galli, A., 2014. Ecolog-ical footprint of nations: Comparison of process analysis, and standard and hybrid
multiregional inputoutput analysis. Ecological Economics 101, 115–126.
Yang, C.-J., Xuan, X., Jackson, R. B., 2012. China’s coal price disturbances:
Observa-tions, explanaObserva-tions, and implications for global energy economies.Energy Policy 51 (C),
720–727.
Yang, Z., Zhao, Y., 2014. Energy consumption, carbon emissions, and economic growth
in India: Evidence from directed acyclic graphs. Economic Modelling 38, 533–540.
Yıldırım, E., Sukruoglu, D., Aslan, A., 2014. Energy consumption and economic growth in the next 11 countries: The bootstrapped autoregressive metric causality approach.
Energy Economics 44, 14–21.
Zhang, B., Wang, Z., 2014. Inter–firm collaborations on carbon emission reduction within
industrial chains in China: practices, drivers and effects on firms’ performances.Energy
Economics 42, 115–131.
Zhang, X.-P., Cheng, X.-M., 2009. Energy consumption, carbon emissions, and economic
growth in China. Ecological Economics 68 (10), 2706–2712.
Zhang, Z., 2003. Why did the energy intensity fall in China’s industrial sector in the 1990s?
the relative importance of structural change and intensity change. Energy Economics