Master Thesis in Geographical Information Science nr 82
Daniel Assefa
2018
Department of
Physical Geography and Ecosystem Science
Centre for Geographical Information Systems
Lund University
Sölvegatan 12
S-223 62 Lund
Sweden
Developing Data Extraction and
Dynamic Data Visualization
(Styling)
Modules for Web GIS Risk
ii
Daniel Assefa (2017). Developing Data Extraction and Dynamic Data Visualization (Styling)Modules for Web GIS System Risk Assessment System (WGRAS)
Master degree thesis, 30/ credits in Master in Geographical Information Science Department of Physical Geography and Ecosystem Science, Lund University
iii
Developing Data Extraction and
Dynamic Data Visualization
(Styling) Modules for Web GIS Risk
Assessment System (WGRAS)
Daniel Assefa
Master Degree Thesis, 30 credits, for Masters in Geographical
Information Sciences (GIS)
Department of Physical Geography and Ecosystem Sciences,
Lund University
Supervisors:
Ali Mansourian, LUND University
Anton Lundkvist, LUND University
iv
Acknowledgments
First of all, I would like to thank the Almighty God for giving me strength and grace to complete this MSc. degree in GIS at LUND University. I would like to thank my supervisor Dr. Ali Mansourian for his guidance throughout the project. Without him, the project could not have been completed successfully. Equally, I would like to thank my co-supervisor Mr. Anton Lundkvist for his unreserved technical guidance and support throughout the project. I also like to thank LUND University for sustaining the distance learning program and the whole GIS Centre staff for their support and most importantly, the opportunity to be part of the program.
Very special gratitude to my lovely wife Nini for having the understanding and patience and giving me support while I pursue my studies. I have to thank Mr. Gezahagn Negash, GIS expert at UN University in Bonn, for his help in brainstorming ideas for my project and unreserved support offered throughout my study.
v
Abstract
Interactive web-GIS tools play an important role in determining disaster risk assessment which ultimately result in reduction of unexpected damages, cost and saves millions of lives. Disaster management practitioners largely benefited information at their disposal about location where possible incidents are eminent, anticipate the impact and project possible outcomes to help mitigate and organize proper response. It is also important to note that, accurate and timely information is critical for coherent coordination in response to disasters. All the above can be achieved through proper data collection combined with computer assisted modelling, analysis, production and timely dissemination of spatial information.
This Master’s thesis aims to extend features of Web GIS for Risk Assessment (WGRAS) project conducted at the Department of Physical Geography and Ecosystem Science at Lund University. The work includes development of tools for geospatial data acquisition and extraction from freely available external open non-commercial sources and dynamic, user-oriented map Visualization allowing user-defined symbolization and coloring resulting flexible visual portrayal of geospatial data in the web environment. In this regard, solutions are driven based upon open source, open data and implementation strictly complies with open web standard protocols and web services. As a result, WGRAS is furnished with easy and user driven raw geo-spatial data extracts for an area of interest from OpenStreetMap (OSM). Thus, data is automatically stored for later use for different spatial modelling and analysis. The second most important contribution of this thesis is the feature developed to solve visualization of geographic information through a map server where maps are generated with a pre-defined style that limits user’s visual needs. Visualization module enables dynamic definition of style (symbolization and coloring) data which assist non-GIS expert to produce instant and meaningful presentation of maps to the end user.
Overall, the work in this practical thesis adds value to disaster management and analysis in terms of easy provision of data and enabling clear dissection of disaster prone areas using effective visualization mechanism.
Keywords: GIS, Disaster Risk Management, web GIS, Volunteered Geographic Information VGI, Map Visualization and styling, Geospatial data extraction, OpenStreetMap (OSM).
vi
List of Acronyms and Definitions
API Application Programming Interface
DBMS Database Management Systems
DHTML Dynamic Hyper Text Markup Language
DOM Document Object Model
ESRI Environmental Systems Research Institute
FAO Food and Agriculture Organization
GDAL Geospatial Data Abstraction Library
GIS Geographic Information System
GML Geographic Mark-Up Language
HTML Hyper Text Markup Language
HTTP Hyper Text Transfer Protocol
IDE Integrated Development Environment
JSON JavaScript Object Notation
MVC Model View Controller
MVVM ModelView View Model
OOAD Object Oriented Analysis and Design
OGC Open Geospatial Consortium
OWS OGC Web Service
OSM OpenStreetMap
REST Representational State Transfer
SDI Spatial Data Infrastructure
SLD Styled Layer Descriptor
SPA Single Page Application
SQL Structured Query Language
UI User Interface
UML Unified Modelling Language
UN United Nations
UNEP United Nations Environment Programme
VGI Volunteer Geographic information
WFS Web Feature Service
WGRAS Web GIS Risk Analysis System
WHO World Health Organization
WPS Web Processing Services
vii
Figures
Figure 1. Simplest form, Client-Server web GIS Architecture
Figure 2. WGRAS Application Architectural Overview (Lundkvist, 2016)
Figure 3. SLD Created project structure outlaid using pyCharm Integrated Development Environment (IDE)
Figure 4. Sequence Diagram for Data Extraction from OpenStreetMap (OSM)
Figure 5. Sequence diagram for styling modules for WMS styling
Figure 6. Diagram for styling modules for WFS styling
Figure 7. SLD Screen to manage extraction of geospatial data from OpenStreetMaps (OSM)
Figure 8. Screen for enabling generation of SLD by passing values for (point, line and polygon) features.
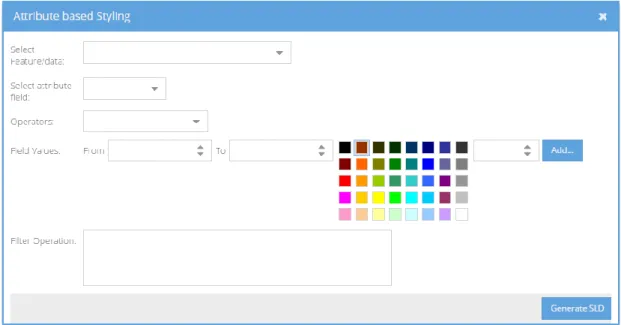
Figure 9. Screen for enabling generation of SLD (using attribute values from the geo-data)
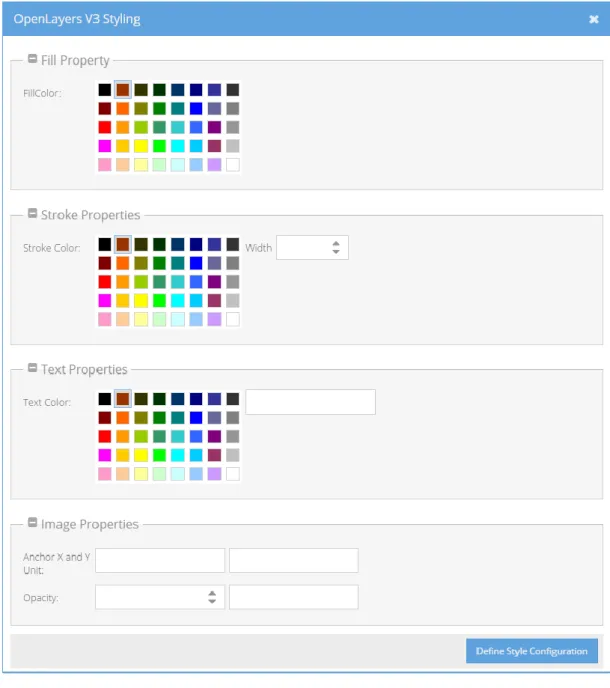
Figure 10. Screen for enabling generation of Client Side Styling for vector data (using OpenLayers V.3)
Figure 11. Sample map taken from part of Paris (Extracted using OSM Extractor Module) saved in PostGIS database and published in GeoServer. The layer then styled using user generated Styled Layer Descriptor (SLD).
Figure 12. Sample map taken from part of Paris (Extracted using OSM Extractor Module) saved in PostGIS database and published in GeoServer. The layer then styled using user generated Styled Layer Descriptor (SLD) based on data attribute values. (Attribute based styling by inspecting geospatial data properties).
Figure 13. Styled Layer Descriptor (SLD) generated using the Visualization tool. (Default styling)
Figure 14. Styled Layer Descriptor (SLD) generated using the Visualization tool. (Attribute based styling)
Figure 15. Sample map styled using user defined style configuration implemented in OpenLayers V3. (WFS complaint map rendering using OpenLayers styling)
viii
Table of Contents
Acknowledgments ... iv
Abstract ... v
List of Acronyms and Definitions ... vi
Figures ... vii
1 Introduction ... 1
1.1 Problem Statement ... 2
1.2 Proposed Solution ... 4
1.3 Goals and Objectives ... 5
1.4 Thesis structure ... 6
2 Web GIS Overview ... 7
2.1 Role of web GIS in Disaster Risk Assessment and Management ... 8
2.2 Web GIS Standards ... 10
2.2.1 OGC Web Services (OWS) ... 10
2.2.2 Styled Layer Description (SLD) ... 13
3 WGRAS Application Development ... 15
3.1 System Overview... 16
3.2 Architectural Overview ... 17
3.2.1 Client-Side Architecture and Technologies ... 18
3.2.2 Server-Side Architecture and Technologies ... 19
3.3 WGRAS Development Environment ... 20
4 Methodology ... 23 4.1 Module Requirements ... 24 4.1.1 Open Source ... 24 4.1.2 Open Data ... 24 4.1.3 Open Standards ... 24 4.2 Development Consideration ... 25
4.3 Geospatial Data Extraction and Uploading ... 25
4.4 Web GIS Standards and Styling ... 27
4.4.1 Web Mapping Service (WMS) Styling Module ... 28
4.4.2 Web Feature Services (WFS) Styling Module ... 29
5 Results: Development of Styling & Visualization Tool ... 31
5.1 Geospatial Data Extraction ... 31
ix
6 Conclusion and Recommendations... 41 References ... 43 Series from Lund University ... 47
1
1
Introduction
Disaster management is an alternative to improve resilience or reduce the impact of natural disasters (Baharian et al., 2009). The process of emergency management has several phases which involves pre-disaster planning, mitigation, response and post-disaster recovery activities. A common view is that disaster management is a continuous cycle of pre-disaster, response and post-disaster phases. Implementation of disaster management systems is vital in saving millions of lives and invaluable economic harm. In disaster management, emergency response is the most critical and difficult operation relying on availability of comprehensive and coordinated approach, reinforced with dependable information to help disaster and emergency management practitioners.
Web Geographic Information Systems (GIS) has emerged as an important tool for providing effective planning, communication and decision support capabilities by combing the analytical power of GIS and easy accessibility of spatial data inherited from internet technology. Furthermore, it enables wide range solutions to simulate disaster damages, analyze data and publish the result real time on the web. The processes of disaster risk identification, quantification and assessment are highly benefiting from the use of GIS techniques for advanced risk decision or evaluation (Peggion et al., 2008). Perspective Visualization and simultaneous access to emergency management data are among those capabilities that web GIS provides in support of informed disaster management decisions-making process (Abdalla, 2009).
Use of web GIS in conjunction with use of quality and sufficient geospatial data determines the success of an efficient and effective disaster management. Alternative freely available open-source tools and data have been widely used and become important data source, minimizing scarcity of disaster related data especially imperative in developing countries (Aye et al., 2016). Crowd sourcing, which is the use of voluntary contributors in data collection, dissemination and cartographic representation of spatial information, has brought significant change in digital world (Goodchild & Glennon, 2010). To that effect, Volunteer Geographic Information (VGI) community played significant role in support of generating large, timely and relevant data to assist disaster management (Chen et al., 2017).
2
Data Visualization is also an important component in disaster management activities. The power of Visualization rests in its ability to abstract reality (Muehrcke, 1990). Geospatial data mapping is crucial for risk assessment and communication. From disaster management perspectives, web enabled geospatial Visualization analysis captures location-specific assessment of hazards and risks in all disaster management life cycle (Erden & Coskun, 2010). Decision making has been shown to apply a profound influence on the effectiveness of information transfer and the receptiveness of the end-user through better Visualization (Alphen et al., 2009).
The main objective of this thesis is to develop modules for the on-going project on a Web GIS tool for disaster and risk management. The Web-GIS for Risk Assessment System (WGRAS) is a project initiated by Lund University and WHO/Europe. Currently the project is under research and development, focusing on simulation of geospatial scenario, building of algorithms and model hazards, identification of vulnerability and presentation of risks in suitable and user driven manner.
This work aims to complement WGRAS by extending functionalities to enhance Visualization of digital maps by user-defined cartographic representations (symbolization and coloring), geospatial data manipulation and easy styling of features (including points, lines, polygons and attributes). GIS visualization techniques are major advantage for disaster practitioners and managers. Furthermore, the study produces working module for downloading available geospatial data from open data providers and stores in usable format for later consumption by WGRAS client application.
1.1
Problem Statement
Disaster risk assessment heavily relies on identification and valuation of an inventory or assets exposed to a certain hazard. Moreover identification of elements at risk is specific to each risk assessment approach (Schelhorn, 2014). Due to the spontaneous nature of disaster, time criticalness and availability of essential data, both in quality and quantity, play significant role in identifying area at risk (Levente et al., 2016).
Although quality and availability of data limits the success of every task in disaster management (Levente et al., 2016), use of alternative data sources are indispensable to close-up the overarching data gap. VGI offers free and open data from contributor’s
3
around the globe. In this connection, the envisioned module targets a method which is capable of interfacing WGRAS with open, freely available geospatial data, avoiding data non-interoperability and integration incompatibility with WGRAS architecture and development framework.
Digital Visualization for emergency management is an important capability that web GIS can provide in support of informed decision making process (Evans, 2012). Interpretation of complex spatial data and identification of patterns of risk are highly beneficial inputs for disaster practitioners and policy makers for better informed decision making. Visualization, in the context of disasters and risk assessment offers digital visual analysis of spatial extent of devastation and even forecasts potential devastations before occurrence.
Interactive and comprehensive Visualization tool is the second highly desired feature for WGRAS, targeting maximum flexibility and user-oriented approach for symbolizing and customizing appearances of digital maps which will allow full control of map presentation. The main objective of Visualization model is to assist little or non-expert GIS disaster practitioners to define styling and instantly visualize the outputs. There are underlying difficulties of Web GIS to deliver full functionality of a typical desktop GIS for analysis and Visualization (Lathrop et al., 2014). Enabling GIS in web-environment involves manipulation of complex geospatial data structure and data model and building interoperability among different data sources. To solve the interoperability issues, the Open Geospatial Consortium (OGC) has introduced standards, i.e., Open Web Standards (OWS), for publishing and communication of maps and spatial data in the web mapping framework. OGC is a non-profit international standards organization that is leading the development of standards for geographic data related operations and services (OGC, 2016). The OGC’s objective is to define open standards in the form of interfaces and protocols for standard access to spatial information and to provide public access to these specifications for the purpose of interoperability. Currently OWS includes three standards, namely Web Map Service (WMS) standard intended to serve static image maps, Web Feature Service (WFS) intended to return actual georeferenced features as vector data and Web Coverage Service (WCS) standard intended to serve georeferenced features as raster data.
All the three mentioned OGC web services support specific set of operations and implementations with inherent client functionality of delivering maps as static image or
4
geospatial data for side rendering. Geospatial data Visualization relies on the client-side customization or is conditioned to specific pre-defined styling model schemes. The main interest of this Visualization tool ascend to close-up the differences and provide comprehensive, dynamic, user-driven and integrated styling tool regardless of the OGC standards and Web GIS technologies in use .
1.2
Proposed Solution
To address the challenges mentioned in problem statement (section 1.1), a solution that aims to provide two major fundamental functionalities is proposed. The first functionality aims to create a mechanism of acquiring geospatial data from freely available open data sources. The second functionality is an interactive visualization tool that can allow seamlessly integrate and produce custom user-oriented styling of geospatial data. High focus is put on the development of visualization and mapping tool to fulfil the goals of the thesis.
WGRAS heavily depends on use of complex geospatial data. Spatial data can be obtained through spatial vendors and open data providers. For this project, use of freely available open geo-data derived from user generated data, i.e., VGI is massively exploited. VGI is the concept of free and open geographic data. VGI is highly heterogeneous environment and obtaining data from it requires extraction and transformation of data into appropriate format which can readily be consumed by client WGRAS application. Furthermore, implementation has to rely on real time data extraction by using web services and later store extracted data to local file storage or database for data publishing.
Geospatial data visualization is one of the pillar features of WGRAS for delivering critical information for risk assessment and communication. Visual-oriented decisions influence on the effectiveness of information transfer and the receptiveness of the end-user (Alphen et al., 2009). Traditional, top-down approach of map making was in practice for long time; now there is a shift in tailoring visualization tools towards enabling end-users to generate maps. User-oriented visualization method enables direct user engagement with data, allowing to effectively using the data in the decision-making process. The same approach is desired in WGRAS to enable disaster practitioners to render spatial data using dynamic, easy to use, user-driven styling interfaces to symbolize and customize the appearance of maps. The envisioned visualization module is designed to cater for dynamic styling (vector or raster) based on data type features (point, line, polygon and raster) or data attribute
5
values. As stated in problem statement above, the main challenge lies on incorporating generic, comprehensive and client-oriented tool empowering styling of geospatial data rendered by any of the OGS complaint standards.
The proposed solution covers implementation of common visualization platform where end-users are able to navigate through published spatial data and perform styling, i.e., basic color setting or custom symbology based on data features selected (generic styling) or styling of data by investigating the attribute values. Intuitive user interface (UI) allows users to preview data attributes and apply styling (styling by geospatial data attribute). Likewise, styling can be achieved through saving style configuration using this tool. The client application then reads the style setting and applies client scripts to generate corresponding styling as per saved style configuration (client-side styling).
1.3
Goals and Objectives
The main goal of this practical thesis portion is to develop and furnish WGRAS with feasible modules to extend functionality, focusing on automatic real time geospatial data acquisition and efficient, user oriented data visualization tools.
In order to achieve the aforementioned goals, the following objectives were defined:
Develop a module which enables extracting open data (i.e., OSM),
downloading extracted data in usable data format and storing the data into the system for further data analysis and data manipulation.
Develop on the fly visualization tool which helps users generate dynamic style definition, with an emphasis on styling geo-spatial data (raster or vector) features (line colour, line width, fill colour, etc.) or styling of geo-spatial data by attribute or “feature types” (categories and quantities) based on user supplied styling preferences. This module provides generic visualization solution for (WMS and WFS) web GIS standards compliant data visualization which in turn requires two different approaches to incorporate common data visualization module.
6
1.4
Thesis structure
This thesis is structured as follows; the next section presents overview of web GIS, review of existing web GIS systems and the role of Web GIS for disaster risk assessment and management. The next chapter deals with introduction to architectural overview of WGRAS and dive into the main section where development of data extraction and styling are presented. The following two chapters discuss the results and conclude with discussion and observations concerning styling component in relation to WGRAS in general.
7
2
Web GIS Overview
In general, the process of showing data on a map over the internet is termed as “Web Mapping” or “Internet Mapping”. Web GIS is an information system that has capacity to distribute and tailor to possess GIS functionality out of the box without installing specialized software (FU and Sun, 2011). Web GIS combine web technology and GIS, which have capabilities of mapping and visualization of geographic information on a web platform. Technology advancement and expansion of web GIS provide visual interaction, multiple user data access to produce and publish maps via the internet and access them from any location. Combination of easy access and visual representation of data address some of the difficulties geoscientists faced in the past (Fu, 2015). Additional functionalities of a web GIS includes query data attributes, data collection, data dissemination, and geospatial analysis such as measuring distance, finding locations, proximity analysis, and route optimization to mention few.
The importance of web GIS stems from its accessibility to many users. There are many authorities involved in planning, decision-making, and communications during disaster management operations (Peggion et al., 2008). Desktop GIS, however, does not provide instant and effective multi-user platforms for the same project, which require distributed GIS capability. Web GIS, on the other hand, provides ease of use in terms of the technical background required from user perspective. Many decision-makers with limited or no GIS background can access geospatial information simultaneously.
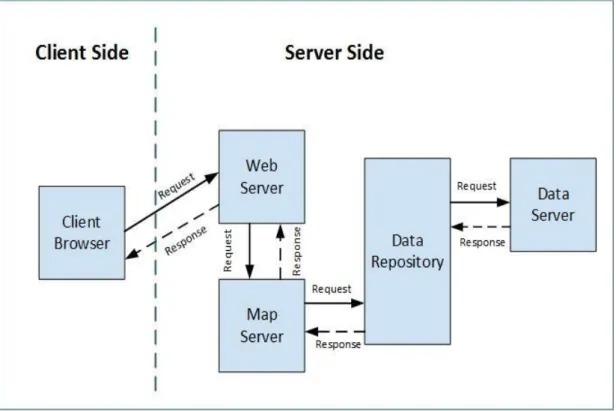
In its simplest form, web GIS is composed of interaction of client and server components. The client can be browser or device (tablet or mobile) that sends Hyper Text Transfer Protocol (HTTP) requests to the Server. The Server receives the requests from many client(s) and process requests and return results. The details of the processes are hidden from the client. The result which is transferred from server to the client can be in different data formats, such as HTML, binary image, Extensible Mark-up Language (XML) or JavaScript Object Notation (JSON) (ArcGIS Enterprise, 2017). The client-server process is achieved through web communication protocol via HTTP. Figure 1 demonstrates interaction of client and server components with request/response data acquisition process. A range of technologies are involved in each segment, especially the server component involves a number of sub components and server side technologies to achieve its objectives.
8
Figure 1. Simplest form, Client-Server web GIS Architecture
2.1
Role of web GIS in Disaster Risk Assessment and Management
Risk is the potential or likelihood of a disaster or emergency to occur. Emergency is a deviation from planned or expected behaviour or a course of an event that endangers or adversely affects people, property or environment (Johnson, 2000). Risk assessment and management involves estimation of level of risk due to emergency. It completely depends on data from various sources systematically organized, analyzed and presented logically to determine the scale of emergency and alert users to respond and take appropriate actions before, during or after the event. Pre-disaster involves identification of risk and risk assessment which aims to help bring awareness of the impact it might cause and help decision makers to establish and device actions to avert the hazard before happening. Web GIS plays significant role in terms of providing risk maps. Disasters are dynamic processes and are spatially oriented (William, 1995). Emphasis on the spatial dimension makes GIS ideal for simulating complex spatial relationships during extreme situations, while still being able to integrate other modelling tools. During disaster, real time
9
monitoring and rescue operations seek immediate attention. Web GIS plays important role to provide decision-makers with vital information which helps forecast potential disaster, determine associated risks, instigate mitigation plans to reduce vulnerability of community and create awareness to improve preparedness for the adverse effects. The post-disaster mainly deals with provision of technical and financial assistance to restore normal conditions which effectively can be coordinated using web enabled GIS systems (GeoSpatial World 2017).
Geospatial information and analysis are critical inputs to risk assessment and management. They mainly involve data acquisition, processing, analysis, distribution and finally convert the data to information products (NRCNA, 2007). Remote sensing and GIS are useful tools to complement conventional methods involved in disaster management. GIS plays central role by providing capacity in managing large volume of data needed for assessment, involving identification, quantification and evaluation processed and planning evacuation routes. It also helps organize devastation information after the event. The power of GIS combined with ease of access to critical data, including prediction of disaster and estimation of extent of devastation, plays significant importance in risk assessment and disaster management in general.
Disaster risk assessment and management should be realized when GIS data and functionalities are made available over the internet. Benefits of web GIS emanate from its simplicity. It does not require considers users to be experts of sophisticated GIS applications, since spatial functionalities are achieved through simple web browser. It can also make use of additional complementary libraries or APIs’ to support geospatial analysis functionalities. Comprehensive web GIS enabled disaster management applications are designed to incorporate the entire disaster management cycle, including planning, mitigation, preparedness, response and recovery. Moreover, it involves different thematic analysis such as emergency earthquakes, flood, plague, ice disaster and many others. In light of the abovementioned variations in phases and thematic aspects linked with the need of knowledge of professionals working in different domains depicts how difficult and expensive it is to set up comprehensive disaster management.
Most web GIS-supported disaster management projects are developed with the notion of only risk assessment focusing on risk visualization (Kamberov, 2012). On the other hand,
10
powerful and complete disaster management platform involves interactive risk analysis management framework, quantifies the risk factors, integrates real time disaster monitoring and evaluation for early mitigation, and provides analytical and geospatial support during and after disaster incident.
On the challenging side, web GIS has a significant limitation in providing powerful and sophisticated analytical modelling techniques out of the box which one can find readily available in desktop GIS tools. Moreover, data interoperability and integration are significantly challenging processes in delivering expected result in disaster and risk assessment in web GIS-enabled environment.
2.2
Web GIS Standards
By definition Web GIS is any GIS that use web technologies (Sandinska, 2016). Sharing of geospatial data is a complex and challenging task. Choosing appropriate web GIS framework is mandatory activity for practical solutions of sharing and visualizing geospatial data on the web. In relation to the web GIS standards, OGC has worked on a set of protocols and standards specialized in Web Services (OWS). The OWS standard majorly includes the Web Map Services (WMS), Web Feature Service (WFS), Web Coverage Services (WCS), Catalogue Services for web (CSW) and Web Processing Service (WPS). The abovementioned services are widely used within the web GIs community for reliable communication of maps and spatial data across the internet.
The next section briefly discusses the most commonly used OWS services and associated standard specifications involved in web GIS environment.
2.2.1 OGC Web Services (OWS)
Implementation of GIS in a web environment brought significant advantages in sharing of geospatial data across boundaries. This is realized through the use of web services working in harmony and applying consistent protocols and standards to avoid incompatibility. Web technologies use standard communication protocol HTTP and request response model. Existing web technology standards do not support distribution of geospatial data by virtue. The interoperability challenges are addressed through implementation of OGC. OGC is an international industry consortium, participating in a consensus process to develop publicly available specifications that support interoperable solutions (OGC, 2017a). OGC Web Services (OWS) are services which allow geospatial
11
functionalities, including geospatial data access, display and processing. OWS are based on HTTP. OGC has defined a number of web services for serving different purposes, including view, download, discovery and remote invocation of geospatial algorithms among others (OGC, 2017b). The next sections will briefly describe the most widely used OWS standards defined by OGC.
2.2.1.1 Web Map Service (WMS)
Web Map Service (WMS) provides uniform access by web clients to maps rendered by map servers on the internet. Thus, WMS enables dynamic construction of a map as a picture, a series of graphical elements or as a packaged set of geographic feature data. Besides, this service provides capacities for basic queries about the content of the map (Reichhardt 2003). When a WMS fulfils the WMS specifications of the OGC, it is then referred as an OGC conforming WMS. This means that requests to and responses from WMS must be done according to specific standards. Considering the technical aspects, WMS defines three operations which fall under current OGC specifications (OGC, 2017c).
GetCapacities: Retrieves metadata about the services, including supported operations and parameters and a list of available layers. (Queries the WMS’s capabilities)
GetMap: Retrieves or requests a map image for a specified area and content.
GetFeatureInfo: Retrieves the underlying data, including additional information about the layer. (Optional)
2.2.1.2 Web Feature Service (WFS)
Web Feature Service (WFS) defines operations to manipulate vector format geographical information at the feature or feature property level (points, lines, and polygons). These operations allow to execute transactions (query, create, update or delete) on spatial data through the web. WFS allows clients to retrieval or modify the data they are seeking, rather than retrieving a file that cannot be edited or spatially analyzed. The geometric descriptions of features in the web feature service specification are transferred and encoded in Geography Mark-up Language (GML), a subset of XML. WFS support the following operations (OGC, 2017d):
GetCapabilities : Generates a metadata document describing a WFS service provided by server as well as valid WFS operations and parameters.
12
DescribeFeatureType: Returns a description of feature types supported by a WFS service.
GetFeature: Returns a selection of features from a data source including geometry and attribute values.
LockFeature: Prevents a feature from being edited through a persistent feature lock.
Transaction: Edits existing feature types by creating, updating, and deleting.
2.2.1.3 Web Coverage Services (WCS)
The Web Coverage Service (WCS) supports interchange of geospatial data as “Coverages” (OGC, 2017e). WCS specifications defines a protocol that lets extraction, processing and analysis of multi-dimensional gridded “coverages” which ideally represented by sensor images or statistical data. WCS extends the WMS interface to allow access to geospatial data “coverages” raster data sets unlike WMS generated image format which is readable by browsers. WCS provides access via three operations GetCapabilities, DescribeCoverage, and GetCoverage similar to the other OGC standards.
GetCapabailities: Similar to the WMS operation, returns available list of WCS resources and operations.
DescribeCoverage: This operation returns description of “coverages”, including information about location or coordinate system, metadata and data format.
GetCoverage: This operation returns suitable data format either as original or processed data for requested resource.
2.2.1.4 Web Processing Services (WPS)
Web Processing Service (WPS) is a specification for serving and executing geospatial processing on the web. WPS services are helpful for serving and executing geospatial processing in an open and across different platforms and clients. WPS standards define how to implement geospatial data processing or define “processes” as a web service. Processes are any algorithms or models that operate on geospatially referenced data (OGC, 2017f). WPS is achieved by defining standardized interfaces that facilitate publishing, discovery and binding to the “processes” by client. The WPS defines GetCapabilities, DesscribeProcess and Execute Operations.
13
DescribeProcess: This operation return description, including the input required, allowed formats and the outputs produced during the process.
Execute: This operation enable clients to start the process at the server side using provided input parameter values and return the outputs produced.
2.2.2 Styled Layer Description (SLD)
Styled Layer Descriptor (SLD) implementation specification is an encoding that extends the Web Map Service specification to allow user-defined symbolization of feature data. SLD allows users to determine which features or layers are rendered with which colours or symbols. Likewise, SLD allows WMS client to specify custom styling during map rendering. The importance of visual portrayal of geographic data is quite high and often used for analysis and decision making. More importantly, clients have no means of defining their own styling rules which is published on server side. The “ability to define these rules requires a styling language that the client and server can both understand” (OGC 2016). It is also worth mentioning that SLD is tied to GeoServer based styling. GeoServer is an open source server software that allows users to share and edit geospatial data (GeoServer, 2016a). SLD gives the WMS client some control over the visual appearance of the map, as well as the existing control over the combination of layers and viewing of geometry. The work of this thesis focused on use of GeoServer and styling is accomplished through pre-defined SLD. Use of static pre-defined styling limits users from producing robust and flexible visual outputs. There are two basic mechanisms to style, the simplest is to color all features (points, lines and polygons). This type of styling requires no knowledge of the attributes of the underlying data. A more complicated styling is achieved through attribute based styling which involves inspection of feature types and performed style accordingly. Majority of the work in relation to visualization is achieved through manipulation of SLD.
15
3
WGRAS Application Development
WGRAS comprises two components or sub-systems for web mapping, namely, spatial analysis and systems administration. The system administration includes user management, process log management and other relevant system administration activities. The other component is the main geospatial processing and map visualization area which enables users to add data or connect to external OGC map service providers and manipulate necessary geospatial data or empower map visualization using the spatial analysis tools provided by the system.
The web mapping/spatial analysis covers functions such as:
1. Buffer: This feature is available through web service called WPS (Lundkvist, 2016). Buffer operation requires two parameters, features the operation taking place and the buffer distance it covers. The operation generate a new layer which can be added and result can be shown using visual map.
2. Query by attribute: This feature enables querying of data using the attribute values of currently opened feature or added data layers. This is possible by reading attribute values from selected feature attribute field and build appropriate filter criteria. From observation, one has to have knowledge of the data itself (vector, raster, etc.) and what each attribute fields are intended for and possible values to filter data.
3. Flooding : Calculation of flooded area/ inundated is possible by selecting elevation from existing elevation data list and providing threshold values, i.e., a rise in sea level water for calculating the affected area. This feature, in combination with other spatial data (data of population, hospitals etc.), can help in decision for evacuation plan or emergency response.
4. Point in Polygon: This feature is used to locate if a point feature is inside a polygon feature. The process is ideal to filter, count and visualize point features in certain polygon boundary.
5. Nearest Object: This is a client side feature intended to measure either the length or area of an existing object on the map by drawing a line or polygon on the map.
6. Evacuation Planning: One of the most effective response strategies available to emergency management during a disaster is evacuation (NRC, 2007). The feature is relatively complex and involves many variables including size of population and
16
definition of spatial evacuation vulnerability which involves extensive data interpolation and network analysis techniques.
3.1
System Overview
The core objective of the WGRAS is to identify and analyze risks based on provided geospatial referenced data. There are three core processes in the system, i.e., data acquisition/integration of external open data sources, geospatial data processing involving modelling of hazards and geospatial data visualization.
In terms of a high level system overview, WGRAS is implemented in three-layered architecture for optimum solution. The layered architecture comprises the UI, Application Server and the Data layers.
In view of Database layer, spatial data storage and retrieval is possible by enabling or extending the database to handle the spatial data format. The Application layer is responsible for spatial data distribution and possible interaction with end users. Additional service is required for serving spatial data and implementation covers use of standardized communication protocol using OGC web Services.
UI layer is responsible for driving the application layer requesting for interaction with application layer. This layer mainly involves spatial data rendering and client side browser technologies to handle proper data visualization.
17
3.2
Architectural Overview
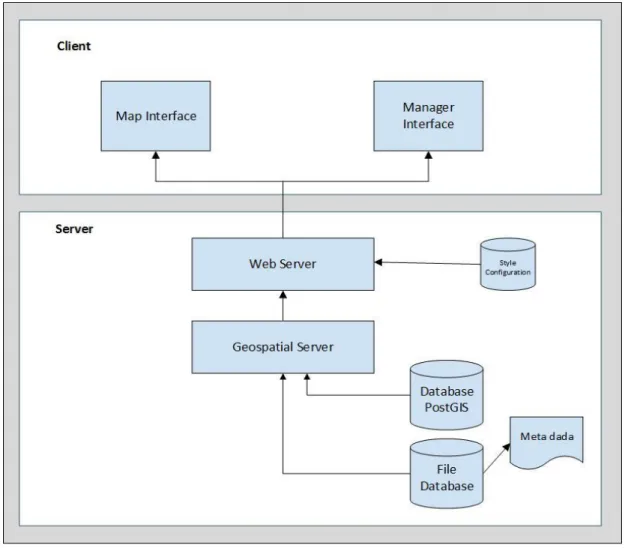
Figure 2. WGRAS Application Architectural Overview (Lundkvist, 2016)
As seen in figure 2, WGRAS follows simple client-server typical three-tier architecture. A client is web-browser. Currently the system is designed to work only on web platform but the future release will consider working with mobile/tablet devices. The server-side component consists of web server to handle user requests and send results to the client, geospatial server perform geo-spatial processing and serves map data from storage, i.e., database or from file system. User management and metadata information which describe the spatial data attributes and properties are also managed in the server-side code (Lundkvist, 2016).
The User Interface (UI)/Presentation layer is the visual component where the user of the system interacts. The interface enables to render outputs and accept user inputs to direct to the application layer. The layer can be categorized into two depending on where the
18
application performs information processing. Based on the scenario described above, the presentation layer can be of Thin or Thick client. Thin client takes place when information processing is sited in the server side while the thick (or fat) client prevails when most of information processing is taking place in client side. Part of the presentation layer involves browser technologies since data rendering and visualization is entirely impossible without using browser technologies in the case of web GIS.
The main role of Application layer is to transform or mediate information between the UI layer and the Data layer involving various technologies fused with deployment of web technology and GIS standards. Communications between the layers are performed using web standard services and protocols.
The Data layer is responsible for modelling and storing information. Web GIS takes advantage of database layer to store geospatial data in the form of structured database or file storage system. The choice entirely depends on the nature, the scope and security framework of the intended application. Preferably, analysis and design stage determine whether to store data in files or in structured database. File based data storage approach is simpler and easier to set up than structured database if the data in use are not frequently changing and are manageable in size. Databases are appropriate when the data size are big and being frequently edited. Accordingly, WGRAS is designed to use both database and file based mechanisms entirely depending on the type of spatial data. As per the adopted architecture, vector data are stored in a database while raster data are stored in file based storage.
3.2.1 Client-Side Architecture and Technologies
The client side environment used to run scripts is a browser. The process is taking place at the user end. In view of the front-end technologies and frameworks, WGRAS use pure Ext JS JavaScript application framework for building interactive cross platform web application using techniques such as AJAX, DHTML and DOM Scripting. Client-side framework follows a Single Page Application (SPA) architecture to enable updating of page as the user interacts with the application. SPA allows creating fluid and responsive application without constant page reloads. This implies much of the process happens on the client side. The core concept in SPA is building application, considering data binding
19
and routing schemes with the help of Controller (MVC) and Model-View-ViewModel (MVVM) patterns.
3.2.2 Server-Side Architecture and Technologies
The server side environment involves employing server side scripts that are executed on a web server in response to each user/client request. Server side comprises Servers (web and geospatial), database and a back-end web application. In WGRAS, the back-end server-side code is developed using a lightweight Python Flask framework. With the help of server-side script, one can store information to the database/files or retrieve data from database and send back results to clients.
The server side architecture comprises the following main components:
1. Map Server: Geospatial Map server makes it possible to access and distribute spatially enabled content and also enable querying and analysis of displayed data (Evans, 2012). WGRAS development is implemented with the help of GeoServer which work under OGC standards, specialized GIS server application for publishing OGC compliant web services responsible for mediating between the data storage and the client (GeoServer, 2016a). GeoServer generate multiple output formats using OGS protocols, including:
WMS for retrieving cartographic images;
WFS for querying and retrieving vector feature;
SLD for encoding cartographic styling rules;
KML for encoding feature collections for visualization in Google Earth; and
GML for encoding feature collections for general purpose.
2. Web Server: Web Server is the main network entry point for WGRAS client request. The main role of web server is to receive, process and return client request governed by HTTP request and response network protocol. A web server refers to the software that accepts and supervises the request. In addition to handling user’s requests and responses, web servers host web applications and web services. WGRAS uses Tomcat 8 Servlet container for handling incoming web requests.
20
3. Database Storage: Generally, WGRAS uses a mix of storage on different situations pertaining to the type and format of data involved. File based storage is used for storing raster spatial data (GeoTIFF) formats. Vector data in the form of Shapefile formats are converted to binary information and stored in database. WGRAS implement popular open source object–oriented database management system (DBMS) using PostgreSQL to store vector data. PostgreSQL is a relational database management system used to support spatial data storage with the help of PostGIS extender plugin to enable PostgreSQL to handle geographical features and spatial analysis. In addition to the file based and relational database data storage, other alternative storage is in use for handling document management associated with style configuration document-oriented storage using scalable, high performance database using MongoDB.
3.3
WGRAS Development Environment
Web application development comprises technologies for web server, the web client and their interactions (Fu and Sun, 2011). Server-side technology includes web application servers that host the websites, accept HTTP requests from clients and serve HTTP responses and codes/scripts that are executed on the web server (Fu and Sun, 2011). Client-side technologies include applications that run inside a web client, usually a browser or a mobile device.
WGRAS is designed and developed with a mix of technologies for different part of the application. The client-side presentation layer implementation is handled using Ext JS JavaScript framework. Ext JS helps to build data-intensive, cross-platform application for desktop, tablets and smartphones (Ext JS 2016a). Ext JS enables SPA technique for better user experience and code separation using model- view- controller (MVC) architecture (Ext JS, 2016a). Server-side component is built on using Python Flask micro framework (Flask, 2016). The development makes use of different libraries and APIs’. Use of Python API for easy manipulation of features of GeoServer is done using an open source GeoServer REST API called gsconfig (gsconfig, 2016). This web service provides easy manipulation of GeoServer services. The project also used few other open source libraries for geospatial data extraction, parsing and validation of SLD/XML data structure and SLD
21
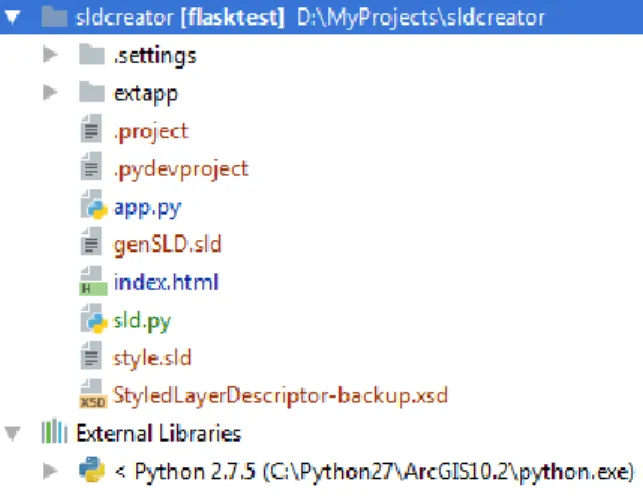
data schema. Figure 6 shows the physical project structure organized within development environment (IDE).
Figure 3. SLD Created project structure outlaid using pyCharm Integrated Development Environment (IDE)
Below are list of major libraries and APIs’ used in this project.
OpenLayers (OL3) is an open source client-side JavaScript library API for creating interactive powerful map applications on the web. It provides a way to build rich web-based geographic application such as Google Maps. This Library assumes a set of functionalities oriented to fluid web mapping client applications. OL3 implements methods for geographical data access, such as OGC WMS, OGC WFS and data formats, including GeoJSON, KML, GML and many more. The main use of this API in this particular practical thesis is to implement geospatial data styling. Client application is intended to expand the functionality using OL3 styling concept and implementation is carried out taking into account user-driven styles are collected and client-side application retrieve those style configuration and transform to proper OL3 styling features.
OSMnx is a “Python package which lets easy downloading of spatial geometries and construct, projecting, visualizing, and analyzing street networks from OpenStreetMap’s APIs. Users can download and construct walkable, drivable, or bikable urban networks with simple intuitive python code, and then easily analyze and visualize them” (OSMnx 2017). OSMnx is built on top of other python APIS or packages including geopandas, networkx, ytree and matplotlib and works with OpenStreetMap’s APIs. WGRAS only
22
takes advantage of the data extraction feature using parameters supplied as city name, bounding box, or point /address plus network distance without its great analytical and visualization capabilities (OSMnx, 2017).
Python-SLD is a python class library which has the power for reading, writing and
manipulating SLD file. This python class enables easy creation of dynamic SLD, validates against proper SLD schema and allows creation of SLD elements on demand (Python-SLD, 2016).
GeoServer REST Configuration (gsconfig) is a python library for manipulating a GeoServer instance via GeoServer REST Config API (GeoSolutions, 2016). This API operates on GeoServer configuration in terms of several variants of configuration objects, including Layers, LayerGroups, Styles, Resources, Stores and Workspaces.
23
4
Methodology
The scope of the envisioned modules is limited to the development of data extraction and custom interactive geospatial data visualization modules applicable to WGRAS. Generally, development of the modules follow Object Oriented Analysis and Design (OOAD), technical approach for analyzing and designing an application. The methodology involve different stages, from abstraction which reflects descriptions of the problem i.e. analysis phase followed by design stage where visual modelling of the system to depict interactions of objects and flow of data between processes done ahead to allow adequate planning with clear goals set before project launch. Considerable effort is spent during coding and testing the modules and finally deployment of the system independent of the WGRAS for simulation purpose. The details of the methodology phases are outlaid in the following section.
Phase 1
Initial phase in module development is to identify the problem which determine the scope of the project. During this phase planning, problem identification and needs assessment are the core activities that happen concurrently.
Phase 2
This stage is the analysis phase where functional and non-functional requirements of GIS and web components are identified. Hence, this stage allows clarify the business processes that will be supported by the modules.
Phase 3
In this phase, conceptual models are designed to provide a summarized snapshot of the modules. This is performed using UML-based sequence diagrams to show interactions and flow of logic between the objects and presented in visual manner.
Phase 4
This phase is important considering translation of the model into operational product. Compatibility issues, performance and optimization tests are the main activities performed in this stage before releasing the final version for product.
24
4.1
Module Requirements
4.1.1 Open Source
Open Source software is computer software with a source code made available with a license in which the copyright holder provides the rights to study, change, and distribute the software to anyone and for any purpose (Andrew, 2004). WGRAS project is managed through open source license and the same hold true for the envisioned modules in this technical thesis. As open source software, WGRAS is freely available and accessible for anyone to copy, edit and share which has a positive aspect in terms of maintenance or extend the functionality of the system.
The intended modules will be developed as open source and the source code will be available in public domain in Github.
4.1.2 Open Data
Open data is data that can be freely available in a convenient and modifiable form. It must be provided under terms that permit re-use and redistribution and interoperate with other datasets. Limitations, cost and re-use are the main areas which determine open data. One of the criteria for open data is to have no limitation to prevent it from being used in any particular way. Anyone should be free to use, modify, combine and share it. Availability of data can be subjected to costs related to access. Open data must be free to use but it doesn’t entirely mean free to access. Once the user has the data, usage is entirely free, including re-use and distribution to the extent of commercial purpose.
In this regards, WGRAS used open data and information that can be freely accessed and shared while still maintaining privacy protection. In this regard, data extraction module is implemented using OSM data and licensed under Open Data.
4.1.3 Open Standards
WGRAS is implemented in view of publicly available standards with proven implementation success, i.e., standards which are developed, adopted and maintained by community to enable interoperability and avoid dependency on any proprietary standard. Section 2.2 deals with web GIS standards particularly pertaining to the OGC Standards that are applicable in this thesis. Use of OGC standard depends on the nature and the requirements of the modules.
25
4.2
Development Consideration
Development of the modules is strictly focused to implement extraction of external geo-spatial data and development of comprehensive visualization of risk data which involves vector and raster formats. Accordingly, data extraction dwells on extraction of data from external sources and implementation particularly focused on OSM and extraction has to focus on specific area since the entire OSM data is huge and full extraction is practically impossible considering size and the required processing power.
The styling module should be designed to enable users to define styling to spatial data (vector and raster). Styling has to fulfil and comply with WMS and WFS client request and all the layer features should be styled with possibilities to extend attribute styling in-conjunction with dynamically generating style at run time and associated with layers.
4.3
Geospatial Data Extraction and Uploading
Data extraction is the act of process of retrieving data out of unstructured data sources for further data processing or data storage. In the process of data extraction, handling large volume data and dealing interoperability challenges are common hiccups despite web enabled data extraction endeavors. To handle these challenges, two important issues have been considered; firstly, explore efficient techniques to support data sharing and interoperate heterogeneous data among different systems and secondly, improve system performance so data can be downloaded or transferred to the client within reasonable time span.
Among various types of geospatial data formats, WGRAS mainly uses Shapefiles and GeoTIFF types as a raw data source. Shapefiles are converted to binary format and stored in database while GeoTIFF files are stored preferably in a file system. The envisioned module is developed to address the challenges of integrating external freely available data source from OGC compliant open data providers.
With regards to geospatial data availability, VGI has become instrumental source for quickly acquiring large amount from many contributors around the world. OpenSteerMap (OSM) standouts as one of the major instances of VGI system (OSM 2017). OSM is freely available and is produced by community of wider volunteers. Free availability of OSM ultimately reduces the cost of acquiring crucial data or even covers areas where it is difficult to get alternative data (Goodchild 2007).
26
OSM extraction involves identification of right extraction, i.e., to cut out the data or features from the area of your choice. There are various services and APIs’ oriented solutions and technical approaches are available by developers to implement data download and extraction from OSM (LeanOSM 2017). Overpass API, Geofabrik, Planet OSM and MapZen are few of the well-known implementations and available libraries and APIs for use.
To support implementation of the envisaged data extraction module, review of existing solutions and their compatibility in web environment was first scrutinized. Most of the libraries are intended to be executed as sub process, which means codes are executed on the server-side allowing spawning new process. This approach will cause vulnerability to code injection with malicious statement attacks executed or running on the server-side. As remedies, user inputs and code have to sanitize before executed on the server-side or expedite alternative libraries that use same Python code-base executed in the same project. Provided existence of an open source, Python implementation without execution of sub process is a preferred approach. OSMnx API provides services to download administrative boundaries and street network from OSM. One can use the API to download data by providing with bounding box, latitude-longitude addresses plus network distance in meters or using location name or list of location names (OSMnx 2017).
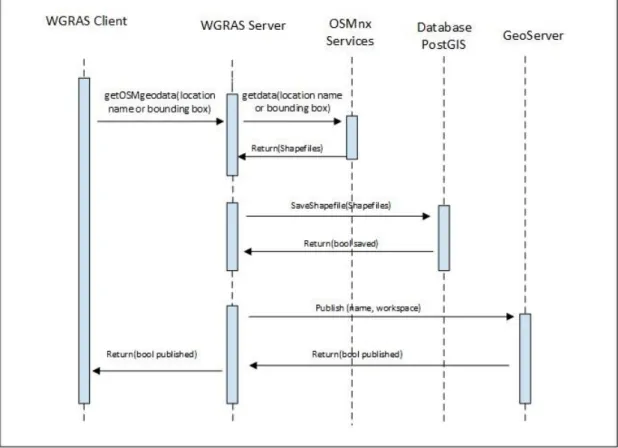
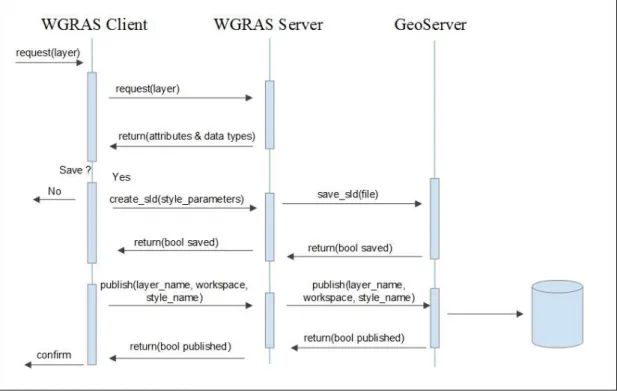
As shown in the sequence diagram in figure 4, the process of acquiring geospatial data from external data source i.e. OSM starts by WGRAS Client request to getOSMgetdata
passing location name or bounding box, i.e. latitude or longitude information. WGRAS Server parse the request and direct getdata request to the OSMnx services. The response from the OSMnxservice return Shapefile based on submitted criteria. The WGRAS Server resume the process and send request saveshapefile to persist downloaded Shapefile to PostGIS database. The publish request is finally sent from WGRAS Server to publish data to the GeoServer.
27
Figure 4. Sequence Diagram for Data Extraction from OpenStreetMap (OSM)
4.4
Web GIS Standards and Styling
By virtue, geo-spatial data (vector and raster) has no visual component (OGC eLearning 2017). Maps and data rendered on the web have to be transformed or styled in order to achieve visualization. Styling is a process that involves manipulation of attribute data to control the appearance pertinent to color, thickness and other visible attributes. WGRAS use mainly GeoTIFF and Shapefiles formats as raw data sources and data visualization component relies on two OGC standard map services.
The styling module works for styling maps produced in response to both WMS and WFS, fulfilling OGC complaint client requests. As briefly described in section 2.2.1.1, WMS allows a client to overlay map images as (JPEG, PNG, etc.) for display. It is also possible to serve from multiple WMS servers and combine them into a single view for the user on the internet (OGC, 2017c).When serving data as WMS, GeoServer applies a pre-defined style document stored internally, i.e., SLD before building the WMS tiles (in .PNG, .JPEG format) and sending it back to the client. In a similar fashion, WFS defines standards for exchanging vector data and allows a client to retrieve and update geospatial data encoded in GML and Scalable Vector Graphics (SVG) formats that includes geospatial data and
28
attribute information along with metadata. WFS uses different techniques to render geospatial data. The service offers clients with direct fine-grained access to geographic information at feature and feature property levels. The next section discusses architectural overview of the styling and techniques used in WGRAS to undertake visualization or styling of OGC complaint web map rendering.
4.4.1 Web Mapping Service (WMS) Styling Module
As discussed in section 2.2.1.1, WMS is defined as a set of interfaces for requesting map images over the internet (OGC, 2017c). WMS makes it easy for a client to request images on demand, changing parameters such as size and coordinate reference systems.
The styling module is meant to be used for styling maps produced in GeoServer as response to WMS request. The term “Map” means pictorial presentation of vector or raster data. When serving data as WMS, GeoServer applies preconfigured style to apply visual component. This preconfigured style by GeoServer uses SLD, which uses pre-defined XML document to properly portray layers and legends in a WMS (GeoServer Manual, 2016).
As shown in Figure 5, the sequence diagram depicts where in the process the styling
module will be used in WGRAS. WGRAS Client perform a request from WGRAS Server
for a specific feature data or layer published in the server, the client parse the request and process the necessary details about the attribute and the data type. WGRAS client initiates a create_sld request. If the operation succeed, then save_sld is invoked to persist SLD file into GeoServer. The WGRAS Client parse the response and send a Publish request to the WGRAS Server with necessary details to associate the style with the layer. When the data has been read by the server and attribute information has been sent back to the client, the user should be able to create a style for that layer, i.e., general color settings, thickness or data attributes. The intended WMS module will generate SLD file and stores it in GeoServer. The module also provides functionality to publish or associate created style document with the layer hosted in GeoServer.
29
Figure 5. Sequence diagram for styling modules for WMS styling
4.4.2 Web Feature Services (WFS) Styling Module
WFS is completely different from WMS as it is able to offer direct fine-grained access to the spatial data itself instead of rendering images. GeoServer supports many different WFS formats such as GML, Shapefile and JSON. WGRAS primarily uses GML format and representation is read by the client and styling is managed using external client-side tools and libraries. There are many client side tools available including Leaflet, OpenLayers, Google Maps, Map Box and many others. Currently, GeoServer styling cannot be extended and used for styling WFS-rendered data but instead the styling features have to be replaced using one of the client-side tools.
OpenLayers V3 is reliable candidate to implement client-side styling considering its rich web-based graphic applications and free, open source support. OpenLayers is a featured-packed library that supports a range of data types and GIS standards with built-in support for map projections and editing features.
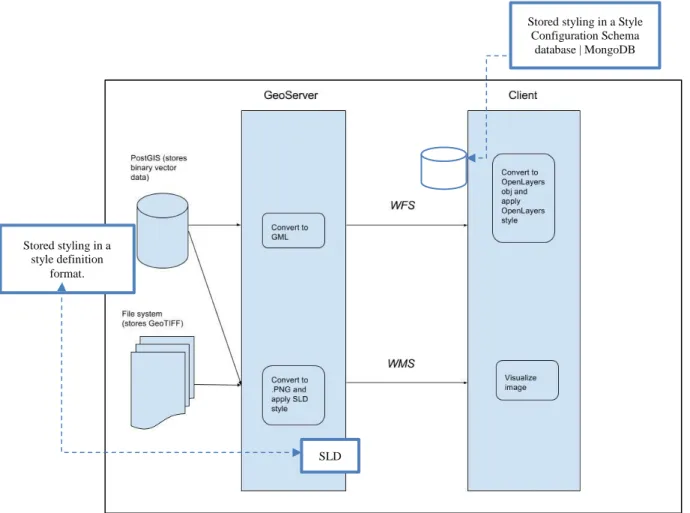
As demonstrated in Figure 6, WFS only supports vector data sources and there are no styling mechanisms enabled in GeoServer; thus, styling has to be done at the client side. To solve the above-mentioned issue, one solution was conceived to directly translate SLD
30
styling to OL3 styling schema object and apply style on the client side. Translating pre-defined SLD to OL2 was implemented using OpenLayers.Format.SLD constructor method. However, this method is obsolete in the current Openlayers version OL3. The current version is completely re-written and the architecture doesn’t support styling similar to the older version implementation.
Accordingly, the proposed solution is to create a styling module where user styling preferences are captured using configuration files and stored using temporary database (document database preferably MongoDB). And later, clients read from configuration document, i.e., style definition format and translate it into OL3 compliant style.
The proposed approach is shown in Figure 6, which illustrates use of the GeoServer styling, i.e., SLD, and creation of a module that translates SLD schema to OL3 styling. However, instead of going through the process of traversing and translating XML based style, it is better to find easier way to store user preference styling using format that is much easier for later manipulation. The client-side application easily retrieves and converts the document to appropriate OL3 style.
Figure 6. Diagram for styling modules for WFS styling Stored styling in a
style definition format.
SLD
Stored styling in a Style Configuration Schema
31
5
Results: Development of Styling & Visualization Tool
This section discusses the design, development and implementation processes carried out in this practical thesis. It is important to put into context that implementation of the modules are entirely independent from the existing original codebase or WGRAS application. However, the development of the modules entirely complies with the current WGRAS architectural framework, development technologies and web mapping and GIS standards.
5.1
Geospatial Data Extraction
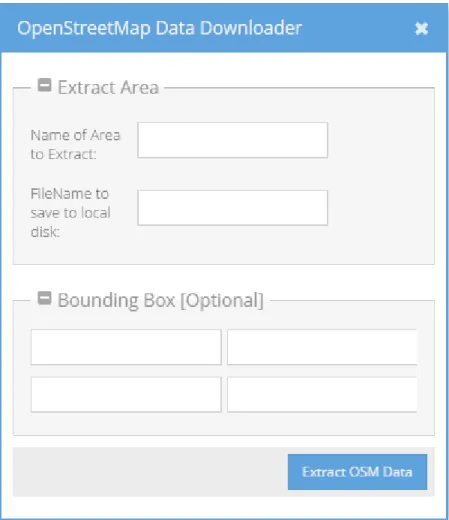
As described in section 3.3.1 above, implementation of this module is completely built on open data service providers. Implementation focused on extraction of data from OSM. Geospatial data extraction is carried out using service oriented external library OSMnx API. As shown in Figure 7, the process initially involves identification using location name(s) or bounding boxes. Then OSMnx handles extraction of the data from OSM and, if successful, returns data in Shapefile, GraphML or SVG formats.
The subsequent process is handled by the server side code to maintain and extract data stored locally on the server given the user supplies a file name. Stored geospatial data has to be transferred to WGRAS and this process overtakes and the server-side code will handle persisting data into database (PostgreSQL). The task involves inspecting fields of the Shapefile (point, linestring or polygon) and creating tables accordingly in PostgreSQL database to automatically save the data without additional process.
To summarize, OSMnx is a preferred solution to extract data from OSM. However, efficiency and performance depends entirely on the volume or extent of coverage demanded by users. If a user requests for massive volume, large area extracts or list of locations, the process of extraction may significantly be longer. The module processes large external data sets and often requires very large working sets that exceed main memory capacity. As a result, the application will take longer time to complete the process. This is the main challenge observed during development stage and the same situation might surface in production environment.
32
Figure 7. SLD Screen to manage extraction of geospatial data from OpenStreetMap (OSM)
5.2
Visualization Tool (geospatial data styling)
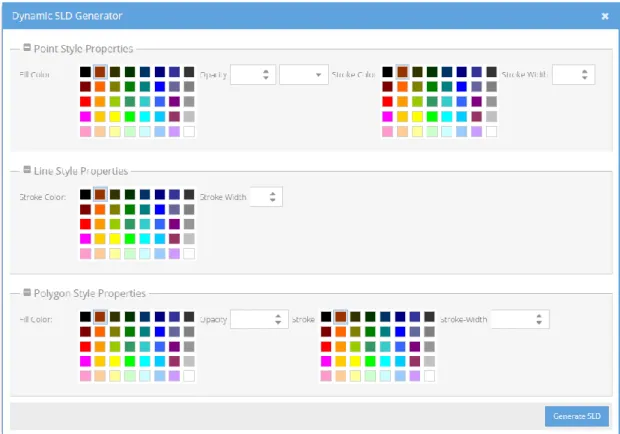
A visualization module is designed, developed and implemented to accomplish styling on geospatial data (raster and vector). Implementation involves two styling approaches. The first Visualization module is solely designed for creating interactive styling which is basically compliant to WMS as described in section 2.2.1.1. Two basic ways are followed to achieve the objective; the first method is used to generate SLD by providing user supplied values to apply the style effects to all features. Figure 8 shows the UI designed for capturing user supplies styling parameters. Server side component to generate SLD is developed using Python which allows automatic generation of SLD XML schema and attach user provided style parameter values on the fly.
33
Figure 8. Screen for enabling generation of SLD by passing values for (point, line and polygon) features.
The second method is to generate SLD using attribute fields inspected from published layers from GeoServer (i.e. attribute based styling). This process involves inspection of layer attributes and accomplished through utilizing Python library gsconfig API. The library is mainly used for manipulating instance of Geoserver via GeoServer REST Config API. As shown in figure 9, gsconfig empowers access of resources (Workspace and Stores) and further inspects attributes and properties for selected layer. Styling applies for selected attribute fields based on user supplied criteria. The same server-side implementation is applied to generate SLD. After SLD file is successfully generated and temporarily stored in the server-side, then published to GeoServer via a REST call using gsconfig API.
Figure
Related documents
The Australia and New Zealand School of Government and the State Services Authority of Victoria are collaborating on a partnership to build connections between new thinking,
The main substrate surface processes are schematically illustrated in Fig. Figure 11: Schematic illustration of the surface processes occurring during MBE growth. These
Simple summation of geometric error values (tool, workpiece, fixture and machine tool) results in the overall error vector. the final output error of comprehensive error
“ Ad full of hidden security-cam moments: Coke proudly proclaims itself Official Soft Drink Of The Security State.”. CS525 IoT Vision
We postulate that the identification of brain areas belonging to RD1 and RD2 is an empirical question that can be addressed by experiments comprising (a) specific
It is likely that, at around 8 weeks, when the average face also became attractive to the infants, they might begin to form an aver- age prototypic representation due to
At the end of the wash cycle, the machine starts a rinse cycle, and the garment load is rinsed with fresh distilled solvent from the pure solvent tank.. This pure solvent
The further development of the policy involved widespread consultation throughout NSW including Area Health Services, Non Government Organisations, representatives from the
