Larry Mugler, Denver Regional Census Office
The 2010 Census—What Your
Community Needs To Know
The Magnitude of the 2010 Census
• 309 Million People
• 134 Million Housing Units
• 236,000 Group Quarters Counted
• 3.8 Million People Recruited (in 2009 & 2010) • 494 Local Census Offices
• 223,000+ Partner Organizations
• 10,250 Complete Count Campaigns
Larry Mugler, Denver Regional Census Office
Nebraska Effort
• 1,796,619 People
• 791,863 Housing Units • 3 Local Census Offices
• 1,536 Partner Organizations
• $3 Billion in Federal Funds Distributed
Larry Mugler, Denver Regional Census Office
Questionnaire Content
• Number of inhabitants on 4/1/10 • Tenure (own or rent)
• Telephone number • Name • Age/Date of Birth • Gender • Race/Ethnicity • Household Relationship
Larry Mugler, Denver Regional Census Office
Type of Enumeration
• 90 % Mailout/Mailback • 9% Update/Leave • 1% Update/Enumerate Page 7Nebraska Type of Enumeration
Percent of Housing Units •76.8 % Mailout/Mailback •22.7% Update/Leave •0.4% Update/EnumerateLarry Mugler, Denver Regional Census Office
Participation Rate Feedback Program
Larry Mugler, Denver Regional Census Office
State/Local Participation Rates
Partnership Activities
• Todd Wiltgen
Larry Mugler, Denver Regional Census Office
2010 Census --Why It Matters
Page 13
"Just like we can’t survive without roads and bridges, the country doesn’t function
well without updated census data to distribute funds to areas that most need them and to support community decisions
about their own future.“
– – Robert M. Groves, Director of the United States Census Bureau
The Use of Census Bureau Data
is About…
• Political power • Economic power • Advocacy power
• Community development power • Funding power
Larry Mugler, Denver Regional Census Office
2010 Census Data Can Help Your
Community Answer Questions Like…
• How many people live here?
• How has the number of people changed? • How old or young are the people?
• What race and ethnicity are they? • How many families are there?
• How many single parents?
Larry Mugler, Denver Regional Census Office
Brief Data Overview
• Census Geography
• 2010 Census Data Release Schedule • Importance of Redistricting Data File • Community Profiles (DP-1)
• American FactFinder
• American Community Survey
2010 Census Geography
• Political Areas:
– States, Counties, Cities, American Indian Reservations, School Districts, Minor Civil Divisions, etc…
• Statistical Areas:
– Census Tracts, Census Blocks, Census
Larry Mugler, Denver Regional Census Office Page 19
Small Area Hierarchy
2010 Census Data Products
Release Schedule
Planned Release Date
Data Product
12/31/10 Apportionment Population Counts
2/11 – 3/11 Census Redistricting Summary File (P.L. 94-171 ) for
States
5/11 Demographic Profile
6/11 – 8/11 Summary File 1 for States
12/11 – 4/12 Summary File 2 for States
12/12 American Indian and Alaska Native Summary File
Larry Mugler, Denver Regional Census Office
2010 Census Data Release Schedule
Redistricting Data File
• Deliver DVD to redistricting officials in each state on a flow basis (2/11-3/11)
• Included:
• First release of official population counts for all levels of geography
• First race and Hispanic origin counts • Counts for 63 race combinations
• Total population and age 18+
• Housing unit counts (occupied and vacant)
• Geography:
• States to blocks
• Voting districts, state legislative districts, 111th
Larry Mugler, Denver Regional Census Office
Demographic Profile
• Released via American FactFinder- May 2011 • Includes:
• Geography:
• Nation, states, counties, places, American Indian and Alaska Native Areas
• Race and Hispanic origin • Population in Group Quarters • Households • Housing Tenure (owner/renter)
• Families • Housing Occupancy Rates
Larry Mugler, Denver Regional Census Office
Summary File 1
• Released via American FactFinder June-August 2011 • Includes: • Geography: • States to blocks Table subjects: • Households • Families • Age and Sex
• Population in Group Quarters by Type • Housing Units
By Major Race Categories:
• Black or African American alone • American Indian and Alaska Native
alone • Asian alone
• Native Hawaiian and Other Pacific Islander alone
• Some Other Race alone • Two or more races alone
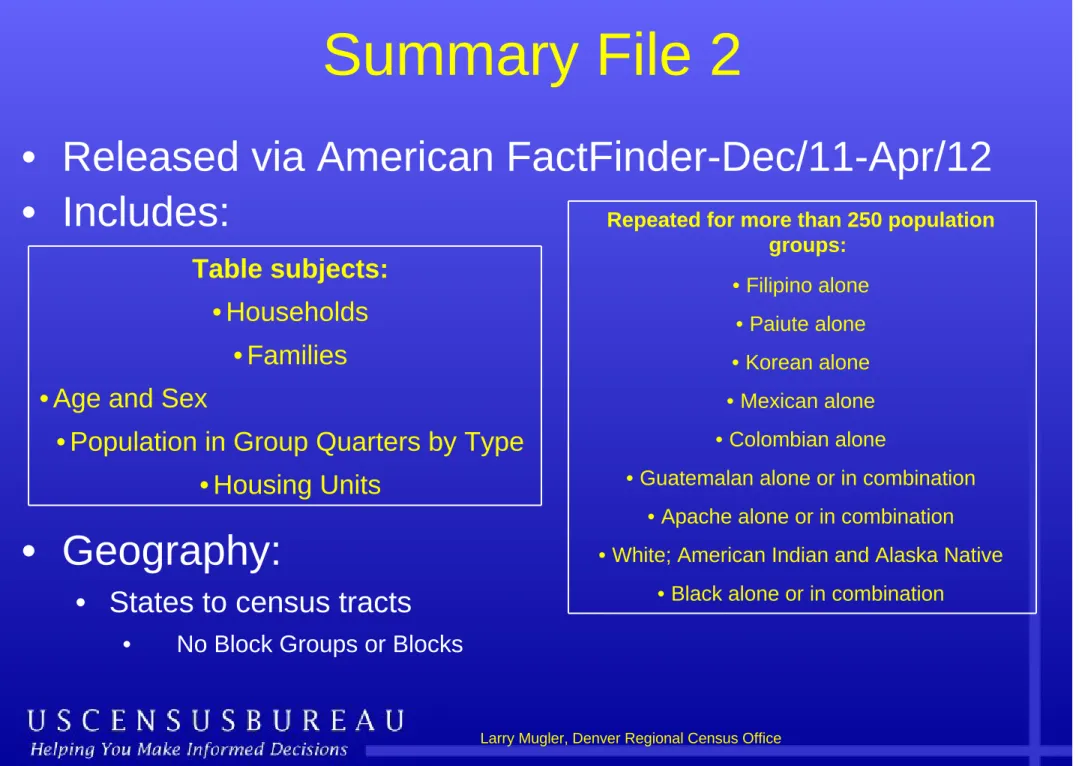
Summary File 2
• Released via American FactFinder-Dec/11-Apr/12 • Includes:
• Geography:
• States to census tracts
• No Block Groups or Blocks
Table subjects: • Households
• Families • Age and Sex
• Population in Group Quarters by Type • Housing Units
Repeated for more than 250 population groups: • Filipino alone • Paiute alone • Korean alone • Mexican alone • Colombian alone
• Guatemalan alone or in combination • Apache alone or in combination • White; American Indian and Alaska Native
Larry Mugler, Denver Regional Census Office
American Factfinder Data
Retrieval System
• An integrated Census Bureau web site • Access to data from:
– 2010 Census
– Economic Censuses
– American Community Survey Data – Surveys and Estimates
How do I get to the American FactFinder?
Larry Mugler, Denver Regional Census Office
ACS and 2010 Census
American Community Survey:
What is it?
• A large, continuous survey
Key component of the 2010 census program.
Replaces census sample questionnaire (long form).
Produces characteristics, not a population count.
More current information:annual data rather than once every 10 years.
Produces information for small areas including tracts, block groups and population subgroups.
Larry Mugler, Denver Regional Census Office
ACS Characteristics
Social Economic Housing
Education Income Own/rent
Marital status Benefits Occupancy
Grandparent caregivers Employment status Structure
Fertility Occupation Housing value
Veterans Industry Taxes
Disability status Commuting Insurance
Place of birth Place of work Utilities
Citizenship Mortgage/rent
Year of entry
Language spoken at home Ancestry/tribal affiliation
ACS Data Products
• ACS includes a wealth of data
• ACS produces 1-year and multi-year estimates
• ACS data products put these data at the fingertips of those who need them:
• http://factfinder.census.gov
• Data Profiles • Narrative Profiles
• Selected Population Profiles • Ranking Tables
• Subject Tables • Detailed Tables
• Geographic Comparison Tables • Thematic Maps
• Custom Tables • Summary File
Larry Mugler, Denver Regional Census Office
ACS—DP 2, 3 and 4
Compass Products—How Can I
Access ACS Data
• General Data Users
• Business Community
• High School Teachers
• Media
• Congress
• State and Local Governments
• Federal Agencies
• Researchers
• Users of Data for Rural Areas
Larry Mugler, Denver Regional Census Office
Nebraska Places, 2009
Ten largest Ten smallest
Major Surveys Conducted
by the Census Bureau
• American Community Survey
• Current Population Survey
• Consumer Expenditure Survey
• Survey of Income and Program Participation
• National Crime Victimization Survey
• National Health Interview Survey
Larry Mugler, Denver Regional Census Office
How the Data are used
Many federal, state, local and tribal
governments use census data to:
• Decide the location of new housing and public facilities,
• Examine the demographic characteristics of communities, states, and the USA,
• Plan transportation systems and roadways, • Determine quotas and creation of police and
fire precincts,
• Create localized areas for elections, schools, utilities, etc.
Larry Mugler, Denver Regional Census Office
Civil Rights
• federal agencies and private litigants use data on race, ethnicity, national origin, sex, age, and disability to monitor compliance with civil rights laws and to determine where
Local government
• Resource needs • Facility planning
Larry Mugler, Denver Regional Census Office
Percent moving in 5 years by ZIP
Transportation planning
• Model validation
• Household travel surveys • Mode shares
• Key household characteristics
• Workers in HH
Larry Mugler, Denver Regional Census Office
Bike/Walk modeling
• Employment density
• Share of multi-family dwelling units of total units
• Local workers/job balance • Distance to college campus
Larry Mugler, Denver Regional Census Office
Estimating travel characteristics
Income Quartile Median Distance Mean Distance Median
Time Mean Time
< $25000 5.87 9.50 14.8 18.0 $25000 -$45000 7.71 11.57 16.8 20.2 $45000 -$75000 9.33 13.13 18.2 21.8 > $75000 9.94 13.46 18.9 22.5 TOTAL 8.58 12.37 17.6 21.1 Source: 1990 Census
School districts
• School locations
• Attendance area boundaries • Enrollment versus population • Student performance
Larry Mugler, Denver Regional Census Office
Percent of Children Under 18 Years Below Poverty Level in the Past 12 Months
Geographic area
Percent Margin of Error (+/-)
Nebraska 14.2 0.7
SCHOOL DISTRICT, UNIFIED
BELLEVUE PUBLIC SCHOOLS 11.6 5.6
COLUMBUS PUBLIC SCHOOLS 6.9 5.0
ELKHORN PUBLIC SCHOOLS 4.9 4.5
FREMONT PUBLIC SCHOOLS 20.0 5.8
GRAND ISLAND PUBLIC SCHOOLS 17.8 4.9
HASTINGS PUBLIC SCHOOLS 15.2 6.2
KEARNEY PUBLIC SCHOOLS 14.4 5.5
LINCOLN PUBLIC SCHOOLS 13.4 1.7
MILLARD PUBLIC SCHOOLS 2.6 1.1
NORFOLK PUBLIC SCHOOLS 14.1 5.2
NORTH PLATTE PUBLIC SCHOOLS 11.7 6.0
OMAHA PUBLIC SCHOOLS 22.5 1.9
PAPILLION-LA VISTA PUBLIC SCHOOLS 7.2 2.6
RALSTON PUBLIC SCHOOLS 12.5 6.4
Grand Island Public Schools,
School Enrollment: 2006-08
Subject Total
Enrolled population
In public school In private school Population 3 years and over
enrolled in school 10874 9864 1010 Nursery school, preschool 582 367 215 Kindergarten to 12th grade 8938 8285 663
Kindergarten 982 982 0
Elementary: grade 1 to grade 4 2845 2786 59 Elementary: grade 5 to grade 8 2171 1952 219 High school: grade 9 to grade
12 2940 2565 375
Source: American Community Survey, 2008
Larry Mugler, Denver Regional Census Office
Faith-Based
• Understand the neighborhood • Determine community needs • Plant new congregations
Larry Mugler, Denver Regional Census Office
Community organizations
• Locate facilities
• Identify social service needs • Find volunteers
Percent over 25 with college
degree by Zip
TM-P042. Percent of Persons 25 Years and Over with Bachelor's Degree or Higher: 2000 Universe: Population 25 years and over
Data Set: Census 2000 Summary File 3 (SF 3) - Sample Data Lincoln, NE MSA by 5-Digit ZIP Code Tabulation Area
NOTE: Data based on a sample except in P3, P4, H3, and H4. For inf ormation on conf identiality protection, sampling error, nonsampling error, def initions, and count corrections see http://f actf inder.census.gov/home/en/datanotes/expsf 3.htm.
Source: U.S. Census Bureau, Census 2000 Summary File 3, Matrix P37.
Source: 2000 Census
Larry Mugler, Denver Regional Census Office
Noise pollution
• “Low-income families have clearly been targeted in this study.” Sound Pollution.org used census data to lobby San Francisco to reduce noise from electric buses. Go to the petition site and read the census data cited to help augment their case
Environmental justice
• “This data shows that Phillips has a higher number of both elderly and children under the age of 5 within its
boundaries.” A neighborhood in Minneapolis used census data to push for further
examination of the environmental and
physiological impact of a proposed energy
facility. Read the actual petition that was filed in court
Larry Mugler, Denver Regional Census Office
Growth impacts
• “Florida is rapidly being developed,
increasing the threats to wildlife” Save the Manatee Club petitions Florida Fish and
Wildlife Conservation Commission to step up protection of Florida’s at-risk species using census data. Go to the official press release
Business – Gauge the
Competition
• Manufacturer compared statistics for his
company with industry-wide figures in census reports. Census figures helped him convince the company's Board of Directors to reduce administrative staff and take other measures to increase productivity and profitability.
Larry Mugler, Denver Regional Census Office
Business – Market Share
• A restaurant supply wholesaler calculated that it had roughly an 11-percent market
share--its own sales divided by state totals for similar businesses-- in its primary sales
region in the northern mountain states. The wholesaler used that figure as a target when it expanded into Arizona and New Mexico.
Business – Site Location
• A major food store chain uses retail census data and population figures to estimate
potential weekly food store sales in the trade area for each of its stores. These estimates allow the company to calculate market share for each existing store, and to evaluate
Larry Mugler, Denver Regional Census Office
Workers in UN-O zipcode
Source: Local Employment Dynamics, 2009
Business – Site Location
• Developer of nursing homes uses census data to locate areas with senior populations
Larry Mugler, Denver Regional Census Office
Percent over 65 with disability by
block group
TM-P047. Percent of Persons 65 Years and Over With a Disability: 2000 Universe: Civilian noninstitutionalized population 65 years and over Data Set: Census 2000 Summary File 3 (SF 3) - Sample Data Omaha, NE--IA MSA by Block Group
NOTE: Data based on a sample except in P3, P4, H3, and H4. For inf ormation on conf identiality protection, sampling error, nonsampling error, def initions, and count corrections see http://f actf inder.census.gov/home/en/datanotes/expsf 3.htm.
Source: U.S. Census Bureau, Census 2000 Summary File 3, Matrix P42.
Source: 2000 Census
Business – Labor force
• labor force skills necessary for a specific industry.
Larry Mugler, Denver Regional Census Office
Percent of workers in Production,
Transportation and Material Moving by
block group
Source: 2000 Census
Transportation
industry
average
monthly
wages,
1999-2009
Trends in Average Monthly Earnings
State=Nebraska, Metro (Nebraska part only) = Lincoln, NE, Industry=48-49 Transportation and Warehousing
Private Firms Only
(Only Nebraska part of Lincoln, NE metro is included in report)
Source: U.S. Census Bureau, Local Employment Dynamics Source: Local
Employment Dynamics
Larry Mugler, Denver Regional Census Office
Partnership and Data Services
Program