Madi, Elissa and Garibaldi, Jonathan M. and Wagner,
Christian (2015) A comparison between two types of
Fuzzy TOPSIS method. In: 2015 IEEE International
Conference on Systems, Man, and Cybernetics (SMC),
9-12 Oct 2015, Kowloon, Hong Kong.
Access from the University of Nottingham repository:
http://eprints.nottingham.ac.uk/34645/1/camera%20ready%20n%20latest%20version.pdf
Copyright and reuse:
The Nottingham ePrints service makes this work by researchers of the University of
Nottingham available open access under the following conditions.
This article is made available under the University of Nottingham End User licence and may
be reused according to the conditions of the licence. For more details see:
http://eprints.nottingham.ac.uk/end_user_agreement.pdf
A note on versions:
The version presented here may differ from the published version or from the version of
record. If you wish to cite this item you are advised to consult the publisher’s version. Please
see the repository url above for details on accessing the published version and note that
access may require a subscription.
A comparison between two types of
Fuzzy TOPSIS Method
Elissa Nadia Madi, Jonathan M Garibaldi, Christian Wagner
IMA Research GroupSchool of Computer Science University of Nottingham,UK
{elissa.madi,jon.garibaldi,christian.wagner}@nottingham.ac.uk
Abstract—Multi Criteria Decision Making methods have been developed to solve complex real-world decision problems. The Technique for Order Preference by Similarity to Ideal Solution (TOPSIS) is currently one of the most popular methods and has been shown to provide helpful outputs in various application areas. In recent years, a variety of extensions, including fuzzy extensions of TOPSIS have been proposed. One challenge that has arisen is that it is not straightforward to differentiate between the multiple variants of TOPSIS existing today. Thus, in this paper, a comparison between the classical Fuzzy TOPSIS method proposed by Chen in 2000 and the recently Fuzzy TOPSIS proposed extension by Yuen in 2014 is made. The purpose of this comparative study is to show the difference between both methods and to provide context for their respective strengths and limitations both in complexity of application, and expressiveness of results. A detailed synthetic numeric example and comparison of both methods are provided.
Index Terms—Fuzzy Set Theory, Multi Criteria Decision
Making, TOPSIS
I. INTRODUCTION
Multi-Criteria Decision Making (MCDM) methods have gained much interest from researchers and practitioners in assessing, evaluating, and ranking alternatives across diverse industries [1]. There are numerous MCDM methods developed to solve real-world decision problems, however Technique for Order Preference by Similarity to Ideal Solution (TOPSIS) is currently one of the most popular methods and worked satisfactorily in various application areas (e.g., [2], [3], [4], [5] and [6]). This method was first developed by Hwang and Yoon [7] for solving MCDM problems with the basic principle to choose alternative which has the shortest distance from the positive ideal solution (best) and the farthest distance from negative-ideal solution (worst).
Later, Chen [8] extended the TOPSIS method to a fuzzy environment using triangular fuzzy numbers to replace the numeric linguistic scales for rating and weighting. After that, a number of papers proposed extensions of the Fuzzy TOPSIS method by Chen [8]. Tsaur, Chang and Yen [9] first changed a fuzzy MCDM problem into a crisp problem using centroid defuzzification and then solved the non-fuzzy MCDM problem based on the classical TOPSIS method.
Wang and Elhag [10] proposed a Fuzzy TOPSIS method based on alpha level sets to analyse the preferences given
by decision makers. Then, Wang and Lee [11] generalised TOPSIS for fuzzy multiple-criteria group decision-making by introducing a new operator to determine the ideal solution point in the Fuzzy TOPSIS method. Ashtiani et al. [12] and Chen and Tsao [13] extended the TOPSIS method to interval-valued fuzzy numbers. Boran [14] introduced an intuitionistic fuzzy TOPSIS method for the supplier selection problem. Behzadian et. al. [1] summarised and reviewed the research on TOPSIS applications and methodologies. Most recently, Yuen [15] proposed a new Fuzzy TOPSIS method based on the introduction of a ”two-dimensional” scale to overcome the dynamic phenomenon which may exist among Decision Makers (DMs) in rating processes. This scale is different compared to the scale in classical Fuzzy TOPSIS method proposed by Chen [8] in order to allow the capture of ad-ditional information from DMs. However, DMs preferences are often vague and decision-relevant information is imperfect as it is based on perceptions [16]. There exist variations in decision making among DMs and that variation can be model using fuzzy sets [17]. Our literature review shows that except for Yuen’s Fuzzy TOPSIS method [15], the other approaches focus mainly on the type of information involved in the rating or weighting processes (e.g.,triangular fuzzy number, interval-valued number and intuitionistic fuzzy valued) and the improvement of the step for the definition of the ideal (best) and negative ideal (worst) alternatives in the Fuzzy TOPSIS method. However, there is little work focussing on the quality of input (preferences) given by DMs in the first, rating step.
Usually, in TOPSIS, DMs use an ordinary scale (e.g., Likert scale) to represent their preferences. Later, in Chen’s work, [8], a new scale was introduced based on triangular fuzzy numbers (TFN) which was subsequently used in Fuzzy TOPSIS methods proposed by other researchers in the last 15 years. However, a question remains as to whether this scale can be applied to every question in MCDM problems. Yuen [15] developed a new scale to be used in the Fuzzy TOPSIS method, requiring two-fold rating and additional algorithms, increasing both data collection and computational complexity. Thus, the question arises as to how this method by Yuen differs from the original, simpler approach by Chen, if both methods provide comparable results with comparable inputs and what 978-1-4799-8697-2/15/$31.00 c2015 IEEE
the effect of the secondary scale in Yuen’s method is. To date, there has been no comparative study that shown the strength and limitations of both methods.
In this paper, for the sake of simplicity, we refer to the classical Fuzzy TOPSIS method as Chen’s Fuzzy TOPSIS method and the recently introduced method as Yuen’s Fuzzy TOPSIS method. We compare both approaches theoretically as well as in an applied example to show the differences and similarities between these two methods. In particular, we show that both methods can provide comparable results under specific circumstances. In this numerical example, we use synthetic data to show the implementation and enable the comparison of both methods. Through the example we show the different steps involved to solve the same MCDM problems in both approaches. Note that the synthetic example used in this paper only focuses on rating of alternatives activity. The importance weight of criteria used in this paper is taken from Chen [8] and applied in both approaches. The details on this matter will be discussed in the Section IV.
The paper is structured as follows: Section II briefly revises the fundamental concepts of Fuzzy set theory and the Fuzzy TOPSIS method. Section III presents comparisons between two Fuzzy TOPSIS methods. Section IV presents a numerical example implementing both methods. Section V provides a discussion of both Fuzzy TOPSIS methods in the comparison context. Finally, Section VI gives conclusions with suggestions of future work.
II. PRELIMINARIES A. Fuzzy Sets and Fuzzy Numbers
Definition 1: A fuzzy setA inX is defined by:
A={x, µA(x)}, x∈X (1)
in whichµA(x) :X →[0,1]is the membership function ofA
andµA(x)is the degree of membership of xinA. If µA(x)
equals 1, x completely belongs to fuzzy set A. Unlike in classical set theory, µA(x)may be a value between zero and
one, capturing partial membership ofxin the fuzzy setA[18]. Definition 2: A fuzzy numberM is a convex normal fuzzy setM of the real lineR such that [19]: There exists exactly onex0∈RwithµM(x0) = 1(x0is called mean value ofM)
andµM(x)is piecewise continuous.
There are different types of fuzzy numbers based on ap-plications or situations. The triangular fuzzy number (TFN) is most widely used in decision making because of its intuitive membership functions and computational simplicity [20] [21]. In this study, TFNs are adopted in both of the fuzzy TOPSIS methods. Triangular fuzzy number can be defined as a triplet
(l, m, u). The parametersl,mandu, respectively, specify the smallest possible value, the peak value and the largest possible value of the membership function.
B. The Fuzzy TOPSIS method
In this section, we succinctly review the general Fuzzy TOPSIS method as commonly used in the last 15 years in the
MCDM field [8]. Let the decision makers,Dr, r∈ {1,· · ·, k}
use a set of linguistic variables to assess the ratings of alternatives and the weight of the criteria. Decision maker r supplies the weight(Wj
r)of jth criterion,Cj(j= 1,· · ·, m).
Similarly, the decision maker gives the rating (xr
ij), of ith
alternative, Ai(i = 1,· · · , n), with respect to criterion j.
An example of alternatives may include alternative actions, actions, acts, strategies, candidates, locations. For criteria, it may includes states of nature or conditions on which the results of any alternative action depends. For example, in the problem of staff selection, the criteria may include ”communication skills” and ”past experience”. The overall method comprises the following steps [21]:
1) The decision maker gives a subjective evaluation on rating of alternatives and a subjective evaluation on importance weight of criteria.
2) Get the average weights of criteria and ratings of alter-natives given bykdecision makers, as shown in (2) and (3): ˜ wj = 1 k[ ˜w 1 j + ˜w 2 j +· · ·+ ˜wjk] (2) ˜ xj = 1 k[˜x 1 j+ ˜x 2 j+· · ·+ ˜xkj] (3)
where w˜j andx˜j are the importance weight of criteria
and the rating of alternative given by Kth decision maker.
3) Construct the fuzzy decision matrix of the alternatives
(D), to show all the subjective ratings given by a set of decision makers according to (4).
D= ˜ x11 x˜12 · · · x˜1j x˜1m .. . ... ... ... ... ˜ xn1 x˜n2 · · · x˜nj x˜nm (4)
where x˜ij , j = 1,2,· · · , m are linguistic variables.
This linguistic variables are described by triangular fuzzy numbers, x˜ij = (aij, bij, cij).
4) Construct the normalized fuzzy decision matrix of the al-ternative ratings in(D)using linear scale transformation to transform the various criteria scales into comparable scales. The normalized fuzzy decision matrix is obtained by: ˜ rij = ( aij c+j , bij c+j , cij c+j ), c +
j =maxicij (Benefit criteria)
(5) ˜ rij= ( a− j cij ,a − j bij ,a − j aij
), a+j =miniaij (Cost criteria)
(6) 5) Calculate the weighted normalized decision matrix, v˜ij
by multiplying the weight of the criteria, w˜j, by the
elements ˜rij of the normalized fuzzy decision matrix:
˜
TABLE I
COMPARISON OF CHEN’S FTOPSIS AND YUEN’S FTOPSIS
Steps Chen’s FTOPSIS Yuen’s FTOPSIS
1. Scale Assign a triangular fuzzy number to each linguistic term. One-dimensional scale (no hedges) as in Table II.
Assign a triangular fuzzy number to each linguistic term. Developed scale based on Fuzzy Normal Distribution. It is a two-dimensional scale as in Table III. 2. Rating/Weighting Process Single rating process Double rating process
3. Aggregation Used weighted arithmetic mean. Same as Chen’s method 4. Normalization Normalized value decision matrix to get the
value within range [0,1]
Same as Chen’s method.
5. Weighted normalized Structure weighted normalized fuzzy deci-sion matrix.
Same as Chen’s method.
6. Ideal solution Defined ideal solution as a perfect value: Positive ideal solution (PIS) = (1,1,1) and Negative ideal solution (NIS) = (0,0,0)
Defined ideal solution as a maximum value in decision matrix (for positive) and mini-mum value (for negative).
7. Distance measurement Calculate distance from ideal solution to each alternative using vertex method (based on Euclidean distance)
Same as Chen’s method.
8. Relative closeness Calculate the relative closeness / closeness coefficient of each alternative from ideal solution.
Same as Chen’s method.
9. Ranking Rank the alternatives - The highest relative closeness value, the better the alternative is.
Same as Chen’s method.
6) Determine the Fuzzy Positive Ideal Solution (FPIS,A+)
and Fuzzy Negative Ideal Solution (FNIS,A−). 7) Calculate the distances d+
i and d−i of each alternative
from FPIS and FNIS, respectively based on (8) and (9).
d+i = n X j=1 dv(˜vij,˜vj+) (8) d− i = n X j=1 dv(˜vij,˜vj−) (9)
wheredv(·,·)represent the distance between two fuzzy
numbers according to the vertex method. Let m˜ = (m1, m2, m3) and n˜ = (n1, n2, n3) be two triangular
fuzzy numbers. Distance calculation of triangular fuzzy numbers is calculated by (10): d( ˜m,n˜) = r 1 3[(m1−n1) 2 + (m2−n2) 2 + (m3−n3) 2 ] (10) 8) Determine the relative closeness or closeness coefficient,
CCi, using (11) : CCi= d− i d− i +d + i (11) 9) Determine the ranking order of the alternatives and select the best one from among a set of predetermined alternatives.
In the following section we will proceed by reviewing two of the recently establish fuzzy TOPSIS methods.
III. COMPARISON OFCHEN ANDYUENFUZZYTOPSIS The step by step comparison of both methods is summarised in Table I. The main goal is to provide context for the strengths and limitations of both methods. There are three different steps between these two methods. The differences are in the Step 1,2 and 6.
In Step 1, both methods use linguistic scales employing TFNs to express the linguistic terms. While Chen’s method only uses a one-dimensional scale, in Yuen’s method, a two-dimensional scale is used to capture the linguistic terms. An example of both scales is given in Tables II and III respectively. In Table II, the linguistic terms used contain no hedges while in Table III, Yuen’s introduced hedges are shown.
The next step which is different is in Step 2. In this step, the decision makers are asked to give a rating of each alternative with respect to each criterion based on the scale given in Step 1. Chen’s rating process is a single rating process as the scale used in this method is one-dimensional scale. The decision makers only choose one linguistic term to evaluate the alternatives.
On the other hand, Yuen’s introduces a double rating process in this step. This process requires each decision maker to choose the main term shown in the columns of Table III and choose a suitable hedge as shown in a same table. An example of main terms as in Table III are: Bad, Weak, Fair, Good and Excellent. In the second stage, the decision makers need to choose the second term which consists of hedges, e.g., Much Below, Quite Below, Little Below, Absolutely, Little Above, Quite Above and Much Above. Thus, Yuen’s method basically collects more information from decision maker than Chen’s method. Note that regardless of the scale used, an important factor in any MCDM method is to produce a consistent ranking order of alternative in a final result.
TABLE II
LINGUISTIC SCALE FOR WEIGHTING OF CRITERIA AND RATING OF ALTERNATIVES INCHEN’SFUZZYTOPSISMETHOD
(a) Linguistic scale for weight of criteria Low (L) Medium Low (ML) Medium (M) Medium High (MH) High (H) (0,0.1,0.3) (0.1,0.3,0.5) (0.3,0.5,0.7) (0.5,0.7,0.9) (0.7,0.9,1.0)
(b) Linguistic scale for rating of alternatives Poor (P) Medium Poor (MP) Fair (F) Medium Good (MG) Good (G) (0,1,3) (1,3,5) (3,5,7) (5,7,9) (7,9,10)
The last different step in both approaches to Fuzzy TOPSIS is the definition of an ideal solution in Step 6. In Chen’s method, the author defines the ideal solution and negative ideal solution as a perfect value on criteria where the values are always (1,1,1) and(0,0,0) respectively. On the other hand, Yuen defines the ideal solution as a maximum of the decision matrix value and the negative ideal solution as a minimum of the decision matrix value. The definition of the positive ideal solution,(r+) in Yuen’s method is shown in (12) and of the
negative ideal solution(r−)is shown in (13):
r+= (r+jl, rj+m, rj+u) =argmax(rlij, rijm, ruij) (12) r−= (r−l j , r− m j , r− u j ) =argmax(r l ij, rmij, ruij) (13) where(rl
j, rmj , ruj)is a triangular fuzzy number in the decision
matrix.
The other steps are the same for both methods, starting from Step 3 (Aggregation), Step 4 (Normalization), Step 5 (Weighted normalized decision matrix), Step 7 (Distance mea-surement), Step 8 (Relative closeness) and Step 9 (Ranking). For Step 3, both methods use (2) and (3) to get an average value of rating of alternatives from the DMs. Next, the normal-ization step in Step 4 is used (5) and (6) to get the normalized value of decision matrix. Then, Step 5 uses (7) to get the weighted normalized decision matrix value. Steps 7 and 8 use (10) and (11) respectively to get the distance measurement and the relative closeness. Then both methods use the same ranking step where the higher the relative closeness value, the better the alternative is. In the next section, a same MCDM problem
with synthetic data is used to show the implementation of both methods.
IV. NUMERICALEXAMPLE
In this section, an example will be used to demonstrate the implementation of both methods. This example was designed using synthetic data to enable the systematic comparison of the methods using the same MCDM problem. The goal for both methods is to get the ranking order of alternatives. Specifically, we focus on comparing the following aspects:
1) The scale used in both methods (Section IV-A); 2) Decision maker rating aggregation and normalization
(Section IV-B);
3) The definition of ideal solution (Section IV-C);
For each case, a comparison for both methods based on the synthetic MCDM problem is provided.
A. The scale used in both methods
In Chen’s method, the scale used to represent the linguistic variable for weighting of criteria and rating of alternatives are shown in Table II (a) and (b) respectively. Chen assigns a value based on intuitive and logical sense without a complex design process. We simulate the case of three decision makers being asked to rate the alternatives and to provide importance weights for the criteria. In this example, we use three benefit criteria, (C1, C2, C3) and three alternatives (A1, A2, A3). The weights of the criteria are shown in Table II (a) and the rating of alternatives in Table II (b). The “collected” rating of alternatives is shown in Table IV (a) together with importance weights of the criteria.
It is worth noting that in this step, Yuen’s method collects more information as each DM is required to give two-fold ratings. Firstly, as shown in Table III, the DMs need to choose one of the main linguistic terms (e.g., Poor, Fair and etc.) and secondly, the DMs need to choose the hedges (e.g., Much Below, Quite Below, etc.). In contrast, in Chen’s method, it is a direct rating process, and following Table II, the DMs only need to choose one linguistic term (e.g., Poor, Fair and etc).
For our numerical example, we generate comparable data as could realistically be collected for the same problem (as explored above for Chen’s method) from the same DMs. Using the same number of DMs, alternatives and criteria as in Chen’s example in the previous part, we simulate the case of DMs being asked on rating of alternatives. For the weights of the TABLE III
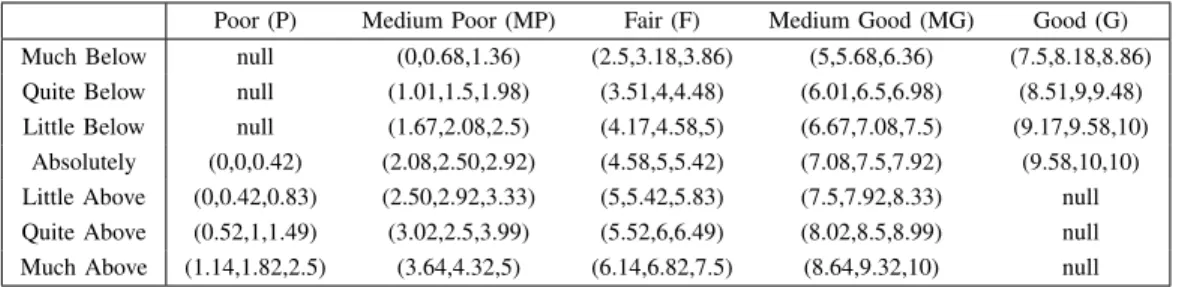
LINGUISTIC SCALE FOR RATING OF ALTERNATIVES INYUEN’SFUZZYTOPSISMETHOD
Poor (P) Medium Poor (MP) Fair (F) Medium Good (MG) Good (G) Much Below null (0,0.68,1.36) (2.5,3.18,3.86) (5,5.68,6.36) (7.5,8.18,8.86) Quite Below null (1.01,1.5,1.98) (3.51,4,4.48) (6.01,6.5,6.98) (8.51,9,9.48) Little Below null (1.67,2.08,2.5) (4.17,4.58,5) (6.67,7.08,7.5) (9.17,9.58,10)
Absolutely (0,0,0.42) (2.08,2.50,2.92) (4.58,5,5.42) (7.08,7.5,7.92) (9.58,10,10) Little Above (0,0.42,0.83) (2.50,2.92,3.33) (5,5.42,5.83) (7.5,7.92,8.33) null Quite Above (0.52,1,1.49) (3.02,2.5,3.99) (5.52,6,6.49) (8.02,8.5,8.99) null Much Above (1.14,1.82,2.5) (3.64,4.32,5) (6.14,6.82,7.5) (8.64,9.32,10) null
TABLE IV
LINGUISTIC RATING OF ALTERNATIVES AND IMPORTANCE WEIGHT OF CRITERIA- CHEN’S ANDYUEN’S METHOD
(a) Chen’s rating (b) Yuen’s rating Crit. Alts. D1 D2 D3 D1 D2 D3
C1 A1 MG G MG Ab-MG Ab-G Ab-MG A2 G G MG Ab-G Ab-G Ab-MG A3 MG MG F Ab-MG Ab-MG Ab-F
Weight H VH MH H VH MH
C2 A1 G MG F Ab-G Ab-MG Ab-F A2 G G G Ab-G Ab-G Ab-G A3 MG G G Ab-MG Ab-G Ab-G
Weight VH VH VH VH VH VH
C3 A1 F MG MG Ab-F Ab-MG Ab-MG A2 G G MG Ab-G Ab-G Ab-MG
A3 G MG MG Ab-G Ab-MG Ab-MG
Weight VH H H VH H H
criteria, we use the same values as in Chen’s example. For the rating of alternatives, Yuen’s method uses the scale in Table III. For comparison purposes, the synthetic ratings of alternatives is the same as in Chen’s method shown in Table IV except for the addition of hedges. In this paper, we purposefully seek to compare both methods using an example with data that is as similar as possible. Clearly however, Yuen’s approach draws its main benefits from the additional degrees of freedom imparted by the hedges and thus in future work we will explore the impact of specific variations of hedges on the overall decision output. Since there are no hedges in Chen’s method, we adopt the “Absolutely” hedge throughout in order to establish a reasonable basis for the comparison of both approaches. The result is a rating of alternatives of Yuen’s method as shown in Table IV (b).
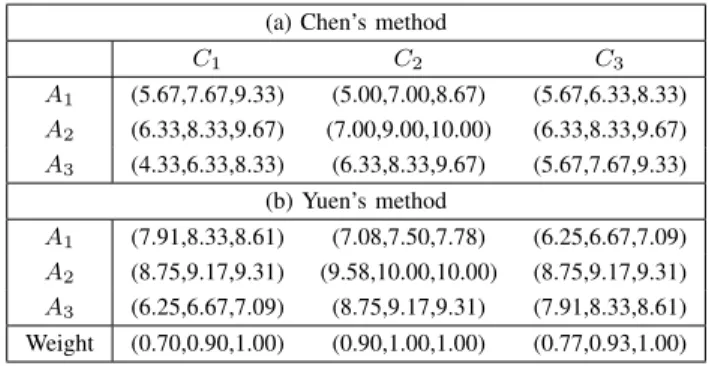
B. Decision maker rating aggregation and normalization Following rating, for both methods, the next step is to aggregate all the preferences values to form a fuzzy decision matrix using (2) and (3) explained in Section II. For our example, the results of this process for Chen’s method are shown in Table V (a) and for Yuen’s method, in Table V (b). The table show an average of all DMs’ preferences given in Tables IV (a) for Chen’s method and Table IV (b) for Yuen’s method. Post aggregation, a normalization step is applied, where both methods use the same technique where (5) is for the benefit criteria and (6) is for the cost criteria as described in Section II. This step is taken to facilitate the computational
TABLE V
FUZZY DECISION MATRIX- CHEN’S ANDYUEN’S METHOD
(a) Chen’s method
C1 C2 C3 A1 (5.67,7.67,9.33) (5.00,7.00,8.67) (5.67,6.33,8.33) A2 (6.33,8.33,9.67) (7.00,9.00,10.00) (6.33,8.33,9.67) A3 (4.33,6.33,8.33) (6.33,8.33,9.67) (5.67,7.67,9.33) (b) Yuen’s method A1 (7.91,8.33,8.61) (7.08,7.50,7.78) (6.25,6.67,7.09) A2 (8.75,9.17,9.31) (9.58,10.00,10.00) (8.75,9.17,9.31) A3 (6.25,6.67,7.09) (8.75,9.17,9.31) (7.91,8.33,8.61) Weight (0.70,0.90,1.00) (0.90,1.00,1.00) (0.77,0.93,1.00) TABLE VI
WEIGHTED NORMALIZED DECISION MATRIX- CHEN’S ANDYUEN’S METHOD
(a) Chen’s method
C1 C2 C3 A1 (0.41,0.71,0.97) (0.45,0.70,0.87) (0.45,0.61,0.86) A2 (0.46,0.77,0.10) (0.63,0.90,1.00) (0.50,0.80,1.00) A3 (0.31,0.59,0.86) (0.57,0.83,0.97) (0.45,0.74,0.97) (b) Yuen’s method A1 (0.60,0.81,0.93) (0.64,0.75,0.78) (0.52,0.67,0.76) A2 (0.66,0.89,1.00) (0.86,1.00,1.00) (0.72,0.92,1.00) A3 (0.47,0.64,0.76) (0.79,0.92,0.93) (0.65,0.83,0.93)
problems inherent to the presence of the different units in the decision matrix and aims at obtaining comparable scales. In this example, both methods use all the benefit criteria. Then, for the overall weighted normalized decision matrix, both methods use the same technique shown in (7) as described in Section II. In this step, each value from the previous normalized matrix is multiplied by its associated weight as shown in Table V(a). The result of the weighted normalized decision making for Chen’s and Yuen’s method are presented in Table VI. The next step is the definition of the ideal solution which will be discussed in the next section.
C. The definition of the ideal solution
In Chen’s Fuzzy TOPSIS method, the perfect value is used. For our numerical example, the Fuzzy Positive Ideal Solution (FPIS) is defined as in (14) while the Fuzzy Negative Ideal Solution (FNIS) as in (15):
A+
= [(1,1,1),(1,1,1),(1,1,1)] (14) A+
= [(0,0,0),(0,0,0),(0,0,0)] (15) On the other hand, in Yuen’s method, the definition of FPIS and FNIS are established as shown in (12) and (13) respectively. In this example, the values of FPIS and FNIS are shown in (16) and (17) respectively:
r+
= [(0.66,0.89,1.00),(0.86,1.00,1.00),(0.72,0.92,1.00)]
TABLE VII
DISTANCE MEASUREMENTS,THE CLOSENESS COEFFICIENT AND THE RANK OF ALTERNATIVES- CHEN’S ANDYUEN’SFUZZYTOPSIS
(a) Chen’s method (b) Yuen’s method dist+i dist−
i CCi Rank dist
+
i dist−i CCi Rank A1 1.15 2.09 0.65 3 0.54 0.15 0 3
A2 0.87 2.43 0.74 1 0 0.69 0.92 1 A3 1.09 2.19 0.67 2 0.34 0.38 0.31 2
r−= [(0.47,0.64,0.76),(0.64,0.75,0.78),(0.52,0.67,0.76)] (17) These values, arising from Table VI (b) by which the definition of this ideal solution is the maximum value for each column that is associated to each criteria. For example, to get the ideal solution for Criteria 1 as(0.66,0.89,1.00)shown in (16), one must refer to the weighted normalised decision table shown in Table VI (b). The first column is associated withC1. Then, one finds the maximum value (peak) to get the ideal solution forC1. Argument Max in (12) results the maximum value as (0.66,0.89,1.00) associated with Alternative A2 in
Table VI (b). The next step is to find the distance between the ideal solution and each of the alternatives. Both methods use the same technique as shown in (10) to establish this distance. For Chen’s method, the distance of each alternative in our example is shown in Table VII (a) together with the relative closeness or closeness coefficient (CCi) value and
ranking of alternatives. The (CCi) value for both methods also
uses the same technique shown in (11). Finally, the ranking of alternatives was determined using the same concept. In Chen’s method, alternativeA2is the best one followed byA3andA1. From Table VII (b), the ranking of alternatives based on Yuen’s method is the same as in Chen’s method where Alternative 2 (A2) is the best one followed by Alternative 3 (A3) and Alternative 1 (A1).
V. DISCUSSION
For the overall ranking, both methods give the same ranking order as expected based on the synthetic data. Table VII (a) shows that Chen’s closeness coefficient (CCi) values are
close to each other, while Table VII (b) shows Yuen’s CCi
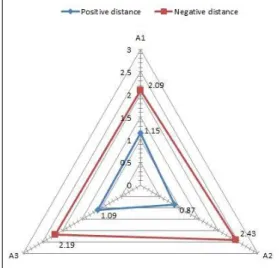
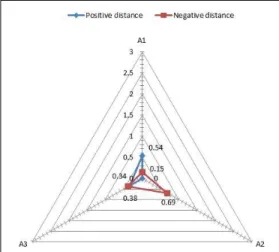
values have a large gap - differentiating them. Figs. 1 and 2 show the distance measurement of both methods. Each corner, e.g. A1, in both figures represents each alternative in both simulated case studies. There are Alternative 1 (A1), Alternative 2 (A2) and Alternative 3 (A3). The red square points represent the distance measurement between FNIS with each alternative while the blue square points indicate the distance measurements between FPIS with each alternative. For example, in Fig. 1, A1 has a distance measurement of 2.09 for FNIS and has 1.15 distance measurement for FPIS. Table VII provides all these values.
VI. CONCLUSION
In this paper, a comparison was made between two Fuzzy TOPSIS methods: classical Fuzzy TOPSIS method (Chen’s
Fig. 1. Graphical representation of distance measurement - Chen’s method
method) [8] and the recent Fuzzy TOPSIS method by Yuen [15]. The implementation of both methods was demonstrated in detail using a synthetic numerical example. The synthetic data in this example was specifically designed to enable a direct comparison between both methods, i.e. the secondary scale employed by Yuen’s method was largely neutralised by using only the neutral ”Absolute” hedge. This approach was taken to allow us to focus on the difference in mechanisms in both approaches, rather than on the presence of additional information gathered from decision makers in Yuen’s method. Based on the resulting comparison, the differences in the steps implemented by these two Fuzzy TOPSIS methods were highlighted throughout the worked example, where they arise in the Scale, Rating and Ideal Solution definition steps. As was intuitively expected, the final ranking order of alternatives shows the same result for both methods. Thus, for future work, we will focus on exploring the effect of varying individual hedges in Yuen’s method and showing how the additional information captured in these hedges provides different outputs compared to Chen’s approach. Clearly, as Yuen’s approach is significantly more work-intensive, computationally, but more significantly - in terms of expert time, it is important to establish what value the additional effort can provide and in which situations it is warranted. Finally, we will explore the potential of using alternative fuzzy set design methods such as in [22].
ACKNOWLEDGMENT
Elissa Nadia Madi acknowledges the financial support of the Malaysian Government.
REFERENCES
[1] M. Behzadian, S. Khanmohammadi Otaghsara, M. Yazdani, and J. Ignatius, “A state-of the-art survey of TOPSIS applications,” Expert Syst. Appl., vol. 39, pp. 13 051–13 069, Dec. 2012. [Online]. Available: http://linkinghub.elsevier.com/retrieve/pii/S0957417412007725 [2] L. Dymova, P. Sevastjanov, and A. Tikhonenko, “A direct interval
extension of TOPSIS method,”Expert Syst. Appl., vol. 40, no. 12, pp. 4841–4847, Sep. 2013. [Online]. Available: http://linkinghub.elsevier. com/retrieve/pii/S0957417413001383
Fig. 2. Graphical representation of distance measurement - Yuen’s method
[3] D. Aloini, R. Dulmin, and V. Mininno, “A peer IF-TOPSIS based decision support system for packaging machine selection,” Expert Syst. Appl., vol. 41, pp. 2157–2165, Apr. 2014. [Online]. Available: http://linkinghub.elsevier.com/retrieve/pii/S0957417413007458 [4] C. Bai, D. Dhavale, and J. Sarkis, “Integrating Fuzzy C-Means and
TOPSIS for performance evaluation: An application and comparative analysis,” Expert Syst. Appl., vol. 41, no. 9, pp. 4186–4196, Jul. 2014. [Online]. Available: http://linkinghub.elsevier.com/retrieve/pii/ S0957417413010257
[5] B. D. Rouyendegh (Babek Erdebilli) and T. E. Saputro, “Supplier Selection Using Integrated Fuzzy TOPSIS and MCGP: A Case Study,” Procedia - Soc. Behav. Sci., vol. 116, pp. 3957–3970, Feb. 2014. [Online]. Available: http://linkinghub.elsevier.com/retrieve/ pii/S187704281400891X
[6] E. Bas, “The integrated framework for analysis of electricity supply chain using an integrated SWOT-fuzzy TOPSIS methodology combined with AHP: The case of Turkey,” pp. 897–907, 2013.
[7] C.-L. Hwang and K. Yoon, Multiple Attribute Decision Making : Methods and Application- A State of the Art Survey, lecture no ed., M. Beckmann and H. P. Kunzi, Eds. Springer Berlin Heidelberg New York, 1981.
[8] C.-T. Chen, “Extensions of the TOPSIS for group decision-making under fuzzy environment,”Fuzzy Sets Syst., vol. 114, no. 1, pp. 1–9, Aug. 2000. [Online]. Available: http://linkinghub.elsevier.com/retrieve/ pii/S0165011497003771
[9] S.-H. Tsaur, T.-Y. Chang, and C.-H. Yen, “The evaluation of airline service quality by fuzzy MCDM,”Tour. Manag., vol. 23, pp. 107–115, 2002.
[10] Y.-M. Wang and T. M. Elhag, “Fuzzy TOPSIS method based on alpha level sets with an application to bridge risk assessment,” Expert Syst. Appl., vol. 31, no. 2, pp. 309–319, Aug. 2006. [Online]. Available: http://linkinghub.elsevier.com/retrieve/pii/S0957417405002174 [11] Y.-J. Wang and H.-S. Lee, “Generalizing TOPSIS for fuzzy
multiple-criteria group decision-making,” Comput. Math. with Appl., vol. 53, no. 11, pp. 1762–1772, Jun. 2007. [Online]. Available: http: //linkinghub.elsevier.com/retrieve/pii/S0898122107001514
[12] B. Ashtiani, F. Haghighirad, A. Makui, and G. A. Montazer, “Extension of fuzzy TOPSIS method based on interval-valued fuzzy sets,” Appl. Soft Comput., vol. 9, no. 2, pp. 457–461, Mar. 2009. [Online]. Available: http://linkinghub.elsevier.com/retrieve/pii/S1568494608000951 [13] T. Y. Chen and C. Y. Tsao, “The interval-valued fuzzy TOPSIS method
and experimental analysis,”Fuzzy Sets Syst., vol. 159, pp. 1410–1428, 2008.
[14] F. E. Boran, S. Genc¸, M. Kurt, and D. Akay, “A multi-criteria intuitionistic fuzzy group decision making for supplier selection with TOPSIS method,” Expert Syst. Appl., vol. 36, no. 8, pp. 11 363–11 368, Oct. 2009. [Online]. Available: http: //linkinghub.elsevier.com/retrieve/pii/S0957417409002772
[15] K. K. F. Yuen, “Combining compound linguistic ordinal scale and cognitive pairwise comparison in the rectified fuzzy TOPSIS method for group decision making,” Fuzzy Optim. Decis. Mak.,
vol. 13, no. 1, pp. 105–130, Jul. 2014. [Online]. Available: http://link.springer.com/10.1007/s10700-013-9168-7
[16] R. Aliev, W. Pedrycz, B. Fazlollahi, O. H. Huseynov, A. V. Alizadeh, and B. G. Guirimov, “Fuzzy logic-based generalized decision theory with imperfect information,”Inf. Sci. (Ny)., vol. 189, pp. 18–42, 2012. [17] C. Wagner, S. Miller, J. M. Garibaldi, D. T. Anderson, and T. C. Havens,
“From Interval-Valued Data to General Type-2 Fuzzy Sets,”IEEE Trans. Fuzzy Syst., vol. 23, no. 2, pp. 248–269, 2014. [Online]. Available: http: //ieeexplore.ieee.org/lpdocs/epic03/wrapper.htm?arnumber=6762925 [18] L. Zadeh, “Fuzzy Sets,”Inf. Control, vol. 8, pp. 338–353, 1965. [19] H.-J. Zimmermann,Fuzzy Set Theory - and its applications. Kluwer
Academic Publishers, 1992.
[20] r. Erturul and N. Karakaolu, “Comparison of fuzzy AHP and fuzzy TOPSIS methods for facility location selection,” Int. J. Adv. Manuf. Technol., vol. 39, pp. 783–795, Oct. 2007. [Online]. Available: http://link.springer.com/10.1007/s00170-007-1249-8
[21] F. R. Lima Junior, L. Osiro, and L. C. R. Carpinetti, “A comparison between Fuzzy AHP and Fuzzy TOPSIS methods to supplier selection,”
Appl. Soft Comput., vol. 21, pp. 194–209, Aug. 2014. [Online]. Available: http://linkinghub.elsevier.com/retrieve/pii/S1568494614001203 [22] C. Wagner and H. Hagras, “Employing zSlices based general type-2
fuzzy sets to model multi level agreement,” inIEEE SSCI 2011 Symp. Ser. Comput. Intell. - T2FUZZ 2011 2011 IEEE Symp. Adv. Type-2 Fuzzy Log. Syst., 2011, pp. 50–57.