Contents lists available atScienceDirect
Future Generation Computer Systems
journal homepage:www.elsevier.com/locate/fgcsA framework for risk assessment, management and evaluation:
Economic tool for quantifying risks in supply chain
Mohamed Abdel-Basset
a,∗,
M. Gunasekaran
b,
Mai Mohamed
a,
Naveen Chilamkurti
caDepartment of Operations Research, Faculty of Computers and Informatics, Zagazig University, Sharqiyah, Egypt bUniversity of California, Davis, United States
cDepartment of Computer Science and Computer Engineering, LaTrobe University, Melbourne, Australia
h i g h l i g h t s
• Nowadays risks are a critical part in our life and are engaged in everything we make. • Risk analysis, mitigation and control are the basic keys for making perfect decisions. • An integrated N-AHP approach is presented for supply chain.
• A case study is presented to illustrate the effectiveness of the proposed method.
a r t i c l e i n f o
Article history: Received 18 May 2018
Received in revised form 26 July 2018 Accepted 19 August 2018
Available online 23 August 2018 Keywords:
Supply chain risk management (SCRM) Cognitive map
Multi-criteria decision making (MCDM) Neutrosophic AHP
TOPSIS
a b s t r a c t
Nowadays risks become a critical part in our life since they are involved in everything we do and participate. Some people do not want to do anything which associated with risk and others flourish on risk. In both types of people, they must relieve their risk through utilizing safety measures such as flame retardant suits and helmets for race car drivers, and safety ropes for rock climbers. All risks can be minimized to a manageable level by employing the proper mitigation strategy. In supply chain, the decisionmaking process contains risks which can be influential on the company’s progress in introducing a new product, expanding in various markets, and outsourcing manufacturing operations. Companies will be likely to perform well via considering risks in their decisions and employing the proper mitigation strategy for responding to the unexpected events The subjectivity, uncertainty and vagueness which exist in reality are the key factors to make risks difficult to handle Hence, risk analysis, mitigation and control provide recommendations for making suitable decisions. In order to quantify risks in supply chain, an integrated method with a neutrosophic analytical hierarchy process (N-AHP) and neutrosophic technique has been demonstrated for this purpose. It is aimed for matching similarity to the ideal solution (N-TOPSIS) by order preference. The neutrosophic values in our research can deal effectively and efficiently with vague, uncertain and in incomplete information which has a significant impact on risk management. For illustrating the suggested methodology, a real case study is illustrated.
©2018 Elsevier B.V. All rights reserved.
1. Introduction
All processes and decisions in business environment are apt to uncertainty. The wrong estimations and misjudgments are the result of uncertainty. We should monitor and manage uncertainty continuously since it has critical impacts when exposed late. Due to increased uncertainty, the significance considerations of risk have grown. We have noted this term being applied in various fields such as marketing [1], management [2], health care [3], decision theory [4], finance [5] and emergency planning [6]. We
∗
Corresponding author.
E-mail addresses:[email protected](M. Abdel-Basset),
[email protected](M. Gunasekaran),[email protected]
(M. Mohamed),[email protected](N. Chilamkurti).
can determine risk as ‘‘Something occurs as a result of not knowing future’s events accurately". The risk increases due to increasing uncertainties and these uncertainties creates a gap among what happens and what a company has planned.
The identification and estimation process of risk is the key elements for managing it. The risk management process includes understanding the reasons that give rise to probable problem, and then estimating probability and destructive impact of such problems. The output of risk management process will include the summary of analysis concerning situational risks. This information will be used in making strategic decisions.
The uncertain, unplanned and seedy events causes supply chain disruptions when connected with the supply chain of organization. The supply chain disruptions are the unexpected and unplanned https://doi.org/10.1016/j.future.2018.08.035
events which may occurs in supply chain and impact the pre-dictable flow of components and materials. These disruptions can be either internal or external to the organization, but internal to the supply chain network and external to the environment are observed as supply chain risks. Many problems are due to supply chain risks such as increasing production cost, cause losses to the organization, stock out, long lead-times, and disability to meet customer demand. Then, the estimation process of supply chain risks has become the necessity of the hour.
Since uncertainties are the major barriers in analyzing risks then we need to use theories for handling it. Neutrosophic theory is a very important theory for handling uncertain, incomplete and vague information Neutrosophic theory was introduced by
Smarandache in 1995 [7]. It was expanded and developed from
classic, fuzzy, and intuitionistic fuzzy theory, etc. A single-valued
neutrosophic set (SVNS) was proposed in [8], in order to make
the application process of neutrosophic sets easy to use Three membership degrees include the truth, indeterminacy and falsity degrees are the main parts of neutrosophic set.
For quantifying risks in supply chain, we combined the analytic hierarchy process (AHP) and the technique for order preference by matching similarity to the ideal solution (TOPSIS) using neu-trosophic set. The proposed method will help in making precise decisions and deal effectively with risks analysis and management So the main contribution of our research is to review all defini-tions of risk and the evaluation methods. We also reviewed existing definitions of supply chain risks and then make understanding it very clear and simple. Also for measuring risks in supply chain we proposed a model which integrates AHP and TOPSIS tech-niques using neutrosophic set. The proposed model enables us to manage and analyze risks efficiently and effectively via handling uncertainty by deeming all sides of decision making process: truth, indeterminacy and falsity degrees. We can apply the proposed model in various fields such as finance, marketing, etc. We are the first to integrate AHP and TOPSIS in neutrosophic environment for quantifying risks in supply chain. By quantifying risks in supply chain, we presented how to achieve the customer value which drives by ‘‘perfect order’’, in our case study.
The residue part of this research is as follows: Section 2
re-views existing literatures about supply chain risks and utilized
techniques for measuring it. Section3provides a detailed
expla-nation of supply chain risks, its characteristics and types. Section
4introduces the proposed method for quantifying supply chain
risks. Section 5 presents a real application of proposed model
for measuring supply chain risks. Comparison with other existing
methods appears in Section6. Section7concludes the paper and
illustrates future trends. 2. Literature review
Supply chain problems such as unexpected changes in flow of materials due to delays or disruptions are the result of supply chain risks [9]. The disruptions are difficult to determine and it is very harmful to organizations. The disruption can be short or long term, extending from minor to major, and has a damaging impact on organization. The mismatch among supply and demand defined as supply chain risks.
The supply chain risks and its management procedure increased in the last period in several surveys, practitioner conferences and consultancy reports [10]. Most research seeks to make the supply chain more robust, efficient in dealing with disruptions. Authors in [11] noted that there exist an increase in the volume and pos-sibility of disruptions. The IBM believed that the supply chain risk management (SCRM) is the second most significant matter for them [12]. Authors in [13] noted that the better SCRM is
re-quired by 46%. The authors in [14] noted also that the SCRM is
very important in modern industrial and economic environment. The supply chain risk management’s information is qualitative in almost research topics, but recently several quantitative methods have been adopted as in [15–18]. We quantify supply chain risks in our research paper by integrating cognitive map with neutrosophic AHP and neutrosophic TOPSIS for the first time.
The AHP and TOPSIS techniques are multi-criteria decision making techniques. They can be used for solving both qualita-tive and quantitaqualita-tive problems, and able to obtain the superior alternative relevant to given criteria and sub-criteria. The AHP has been used to assess and manage supply chain risks in various research topics as in [19–22]. In order to handle vague information, fuzzy AHP has been used in handling supply chain risks as in [23]. Because fuzzy theory deems only truth-membership degree and fails to consider indeterminacy and falsity degrees, neutrosophic AHP introduced in many research topics as in [24,25] to overcome fuzzy drawbacks.
The most widely MCDM technique is the TOPSIS technique for its capability to find both ideal and not ideal solution, and its computation simplicity [26,27]. Various multi-attribute decision making problems have been solved by TOPSIS technique. The TOP-SIS technique has been used for managing supply chain risks by several authors as in [28,29]. The TOPSIS technique introduced in neutrosophic environment in several research topics as in [30,31]. The AHP integrated with TOPSIS technique using fuzzy theory for measuring supply chain risks as in [29]. In order to overcome the drawbacks of fuzzy set we are the first to integrate AHP with TOPSIS in neutrosophic environment for quantifying supply chain risks.
3. Supply chain risks
The European concept of risk returns to the term rhizikon which is a Greek navigation expression means ‘‘avoiding difficulties at the sea’’ [32]. Risk became notable in mathematics at the beginning of the 17th century, when Blaise Pascal and Pierre de Fermat began to size uncertainty in gambling [33]. The probability theory has evolved as a result of their work and still controls the new concept of risk [34]. According to Schoenherr et al. [35] the risk is the probability of occurrence of realized hazard and volume of the occurrence. Risk is also defined as the probability of alteration in the occurrence of an event that has either positive or negative impacts. Risk also defined as a set of uncertain events which affect on achieving objectives. It also defined as a probable event which could cause damage, or loss, or affect the achievement of objec-tives. Risk also defined as the negative outcomes due to uncertain situations.
Supply chain risk (SCR) is defined as the ‘‘divergence in the distribution of potential outcomes of supply chain, their prob-ability and their subjective values" [36]. The authors in [37,38] defined SCR as the appearance of an accident with the disability of the influenced firms to deal with consequences. Also the authors
in [39] defined SCR as the potential and influence of mismatch
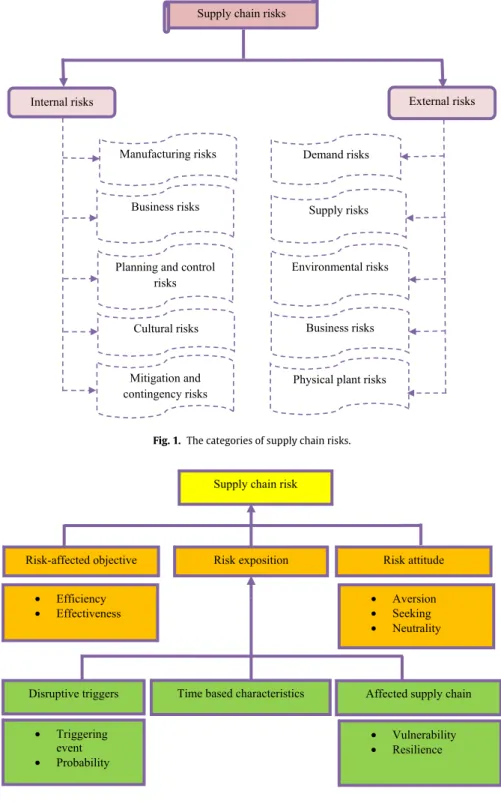
among supply and demand. It is also defined as anything which disrupts the information, materials or the flow of product from original suppliers to end users [40]. The classification of SCR re-turns to various perspectives, for example as from financial risk agenda, or corporate governance, or multi-level complex system. The first classification of supply chain risks is the internal and external risks. The external risks such as natural disasters, and internal risks such as quality problems of supplier. The supply chain risks also classified to strategic, tactical and operational risks. The comprehensive classification of supply chain risks is presented inFig. 1.
InFig. 1, supply chain risks are classified to internal risks (man-aged risks) and external risks (uncontrolled risks) summed up as follows:
1. Manufacturing risks: occurs due to disturbance of inside operations.
2. Business risks: occurs due to alterations in key structures. 3. Planning and control risks: occurs due to inappropriate
esti-mation and planning, which reach ineffective management. 4. Mitigation and contingency risks: occurs because contin-gencies or alternative solutions are not placed when wrong things occur.
5. Cultural risks: occurs because business cultural tends to stow or retard negative information.
There exist five types of external risks which are as follows: 1. Demand risks: occurs due to unexpected customer demand. 2. Supply risks: occurs due to obstruction of product flow,
whether by materials or parts of the supply chain.
3. Environmental risks: usually relevant to governmental, eco-nomic, social and climate factors.
4. Business risks: occurs due to many factors including the stability of a supplier’s finance or management, or purchase and sale of supplier companies.
5. Physical plant risks: occurs by the condition of a supplier’s physical facility and regulatory compliance.
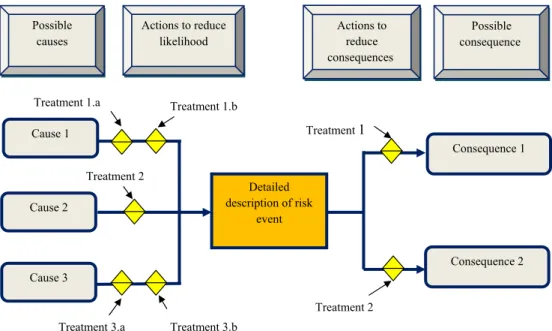
The main characteristics of SCR as inFig. 2.
Fig. 2, represents the main characteristics which lead nowadays to understand supply chain risks: the estimation of SCR is tightly concerning with the objectives to be achieved by the organizations in their supply chain. The expositions of uncertain and unexpected events in supply chain are the degree for achieving objectives. The disruptive triggers, ability of supply chain to deal with de-mands, and time based aspects which align the appearance of the disruptive triggers to the actual status of the supply chain. The importance of probable and non-accomplished objectives can be estimated by quantifying the risk attitude of the decision makers
The efficient planning, monitoring, and controlling of com-pany’s capital resources are the aim of ‘‘objective driven risk’’. The objectives can be achieved efficiently or effectively. Efficiency means achieving objectives with minimum spending of resources. Effectiveness means achieving desired objectives whatever the circumstances.
The exposition of risk is determined by the following two fac-tors. First, it is the appearance of triggering events determined by the probability of occurrence and its impact in supply chain. Second, it is the supply chain characteristics determined by vul-nerability or resilience concepts. The scope in which supply chain is volatile to a specified or unspecified risk event is the supply chain vulnerability. The capability to conquer vulnerability is supply chain resilience.
Additionally, when pointing to disruptive triggers and the readiness of the influenced supply chain, the time aspects need to be considered. Disruptive trigger is determined by using the concepts of probability and events.
The attitude of decision maker toward risk is the key method for specifying risk. The risk seeking risk neutral and risk averse are the three groups for specifying subjective perception and the significance of risks
Since supply chain risk management (SCRM) is often vague, uncertain and ill-defined, so that we need to measure, manage and predict all triggering events via representing them in mathematical models. The SCRM is defined as the application of strategies to manage both every day and extraordinary risks in the supply chain. It is based on continued risk estimation, aiming to minimize vulnerability and guarantee continuity [42]. The SCRM means that risk management process tools are used to evaluate and deal with risks and uncertainties. The managing process of risk presented in Fig. 3. The first step begins with identifying internal and external
environment of enterprise. Then, the enterprise should prioritize and address its risk effectively. For prioritizing and addressing risks, enterprises will need to determine criteria for identifying what may cause a risk to its operations. After identifying risks, the enterprise should perform a risk assessment process which contains risk identification, risk analysis, and risk evaluation. The risks which should be involved in risk management process and those which should not must be distinguished in risk assessment process. Risk identification may require using a list of external risks and internal risks.
Risk analysis means the estimation process of the likelihood and consequence of risks which face the enterprise and prioritizing them for treatment. For understanding the nature of the risk and rating the likelihood and consequence of inherent risk and residual risk, the enterprise should use advanced methods such as the
bow-tie method. An example of the bow-bow-tie method appears inFig. 4.
By using the bow-tie method we can distinguish clearly among causes and consequences, determine actions that minimize the likelihood that a risk will occur, and determine actions that min-imize the magnitude of consequences if a risk occurs. An example of cause and consequence analysis is the bow-tie risk analysis method, and it obviously connect treatment actions against each extent of a risk event.
The assessment process of the probability and consequence of enterprise’s risks should be performed before and after the treatment for evaluating residual risk levels against acceptable risk levels, which names ‘‘risk tolerance". If a residual risk is greater than the enterprise’s risk tolerance, then we need to provide fur-ther risk treatments for reducing the residual risk. The enterprise can estimate its risk tolerance via a risk ‘‘frontier’’ graph as inFig. 5. If the value of likelihood or consequence is large, then we need to reduce or eliminate risks via using various buffering such as multiple suppliers or safety stocks. Each organization and supply chain has a unique level of acceptable risk. These levels may differ according to goods, service, or time. Various risk-tolerance levels may be set for various levels of the enterprise.
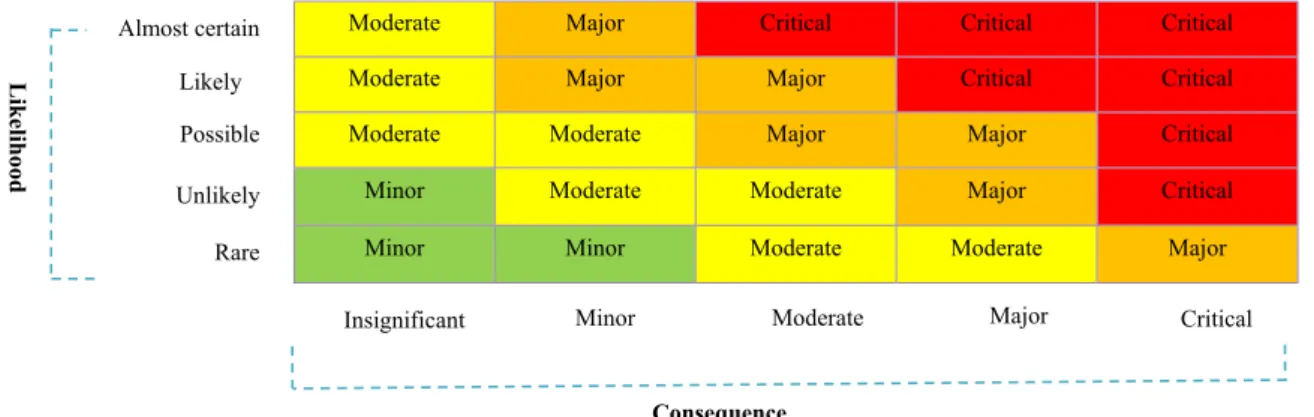
Another way to evaluate risk is by using a ‘‘heat-map’’ that shows risk-events on a matrix determining probability and conse-quence levels. This method enables managers to define the relative likelihood and consequence of various risks. For using this tech-nique effectively we should prioritize risk by the matrix of likeli-hood and consequence, just like the heat-map method appears in Fig. 6. This allows the stakeholders to easily spot the urgency and importance of different risks.
After understanding supply chain of enterprise and analyzing its potential risks, we can execute an efficient program for supply chain risk management. This program should provide three things: protection of supply chain, reacting to events, and keeping busi-ness operations while regaining from events.
The persistent communication and consultation as well as mon-itoring and review during this process must be undertaken by the enterprise. The monitoring and review process includes assessing the impacts of risk treatment and maintaining a plan for respond-ing to changes which affect elements of the supply chain.
We can categorize various decisions of risk management pro-cess as follows:
1. Avoidance: a simple means of risk management process is avoiding risk.
2. Acceptance: it is approved to accept risks as they are in some cases. Its efficient decision for very trivial risks.
3. Compensation: its means taking on risk to substitute an-other. It is a popular method in finance for minimizing exposure.
4. Transferring: it means transferring risk to another party via insurances or by contracting with non-insurance party. 5. Reduction: it means reducing the probability of an
Fig. 1. The categories of supply chain risks.
Fig. 2.The main characteristics of supply chain risks [41].
4. Motivation for this research
Since the classical qualitative and quantitative risk analysis methods have some drawbacks such as:
1. The quantitative methods depend on the range and accuracy of knows measurement scale,
2. The results of risk analysis process may be not accurate and even confusing,
3. The classical methods must be reinforced in qualitative char-acterization,
4. The analysis which obtained with application of those meth-ods is expensive, requiring more experience and preceding tools,
5. Also the quantitative methods of analyzing risks uses the probability distributions to depict the risk’s probability and the classical theory of probability fails to consider indeter-minacy, for example, if we toss a regular dice on a patch surface that has cracks, then it is probable to obtain the die stuck on one of its edges or vertices in a crack (indeterminate outcome). So the space is in this case: { 1, 2, 3, 4, 5, 6, inde-terminacy} , then we can conclude that classical probability fails to deal with indeterminacy which exists usually in real world.
Fig. 3.The management process of risk [43].
The qualitative methods have also drawbacks such as:
1. The qualitative methods of analyzing risk does not analyze it mathematically for identifying the probability and distri-bution,
2. Based on expert judgment which are usually vague, incon-sistent, uncertain in nature,
Since the main obstruction in risk analysis comes from the fact that there exist some subjectivity, and the input from experts judgments are subjective estimations, and for dealing with this subjectivity many theories have used such as fuzzy theory and grey analysis theory. Since fuzzy theory fails to consider indeterminacy which exists usually in real applications, then it fails to handle vague, inconsistent and uncertain information effectively.
Fig. 5. The risk ‘‘frontier’’ [43].
For dealing with vague, uncertain information effectively and efficiently, neutrosophic theory has been introduced by Smaran-dache in 1995. The key membership degrees in neutrosophic are the truth; indeterminacy and falsity degrees which simulates the natural process of decision making. Two common methods used in our research which are neutrosophic AHP and TOPSIS. We com-bined the benefits of neutrosophic theory with MCDM techniques which are AHP and TOPSIS. Since neutrosophic theory considers indeterminacy, and then it can handle uncertainty and help in making precise decisions.
5. Methodology
In this section we propose a methodology to quantify risks in a supply chain by combining neutrosophic theory with AHP and TOPSIS techniques
5.1. Cognitive maps
For brainstorming and obtaining the estimation criteria by de-cision makers, the cognitive maps have been used in operation
research studies [44]. In decision making process the decision
makers uses certain mental models for estimation.
In this phase we invite the experts in the supply chain field and ask them to determine all possible risks. The experts should then discuss and compile all supply chain risks criteria. This phase took around 2 h to complete. We used the online questionnaire and personal interviews for obtaining information from supply chain experts and make a representation of cognitive map.
Fig. 6. The heat map for prioritizing risks by likelihood and consequence.
5.2. Neutrosophic AHP-TOPSIS technique
The AHP is a multi-criteria decision-making technique
pro-posed by Saaty [45] in 1970s. It is a widespread technique for
making decisions in today world. It is also indispensable method for managers to make decisions on a broad domain of complex problems which involve technology choice, designing and plan-ning of products, forecasting, and modeling risks and opportuni-ties. In AHP technique the complex problem is composed into sub-problems for simplifying it. The pair-wise comparison judgments of AHP technique are used to calculate weight of each criterion in the problem. The neutrosophic AHP technique expands Saaty AHP by integrating it with neutrosophic set theory. In neutrosophic AHP, neutrosophic ratio scales are utilized for indicating the rela-tive significance of the factors of the corresponding criteria. The neutrosophic numbers are used for indicating the relative impor-tance of criteria and alternatives and a score function is utilized to convert neutrosophic numbers to its crisp values [46].
Developed in 1981s by Hwang and Yoon, the TOPSIS technique was to solve multi-criteria decision making (MCDM) problems. The selected alternative is the one with the shortest distance to the ideal positive solution and with the longest distance from the ideal negative solution. The TOPSIS technique applied in several applications such as supplier selection, location selection, ranking of carrier alternatives, and company evaluation [47]. In neutro-sophic TOPSIS, the values are neutroneutro-sophic values and the process includes neutrosophic mathematical techniques.
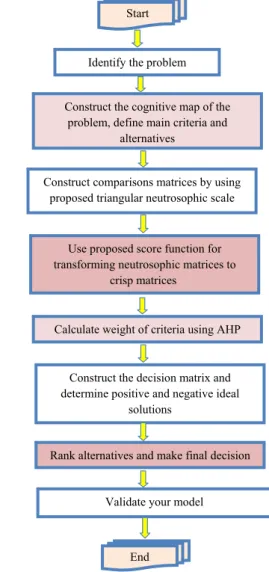
The detailed steps for the suggested methodology are as fol-lows:
Step 1:Determine the objective of your study, and identify criteria and sub-criteria for constructing decision hierarchy.
Step 2:Use the neutrosophic scale which was provided inTable 1 to construct comparison matrices of criteria and sub-criteria. In de-cision maker judgments if ‘‘first criterion is slightly important than second criterion’’, then we put in comparison matrix this triangular neutrosophic scale
⟨(2
,
3,
4)⟩. Contrariwise, the comparison of sec-ond criterion to first criterion will take the triangular neutrosophic scale as⟨(
121314)⟩, not only this we should concatenate each trian-gular neutrosophic number with the sureness degree (i.e. the truth degree, indeterminacy degree, and falsity degree) for considering it in our calculations. The sureness degree returns to decision makers opinions. Then as example, the previous judgment in the compar-ison matrix has the following form⟨
(
2,
3,
4)
;
0.
9,
0.
3,
0.
1⟩. The value(
2,
3,
4)
is a triangular neutrosophic scale since 2 is the lower bound of triangular number, 3 is the median value and 4 is the upper value,(
0.
9,
0.
3,
0.
1)
is the sureness degree and determined according to decision maker opinion. We should also note that the components of sureness degree (truth, indeterminacy, and falsity degree) are independent.Table 1
The triangular neutrosophic scale of neutrosophic AHP. Saaty scale Explanation Neutrosophic triangular scale 1 equally significant 1˜= ⟨(1,1,1)⟩ 3 slightly significant 3˜= ⟨(2,3,4)⟩ 5 strongly significant 5˜= ⟨(4,5,6)⟩
7 very strongly significant 7˜= ⟨(6,7,8)⟩
9 absolutely significant 9˜= ⟨(9,9,9)⟩
sporadic values among two close scales
˜
2= ⟨(1,2,3)⟩
4 4˜= ⟨(3,4,5)⟩
6 6˜= ⟨(5,6,7)⟩
8 8˜= ⟨(7,8,9)⟩
Step 3:Use the following score function to transform neutrosophic matrix to crisp matrix:
If we have triangular neutrosophic number as follows aij
=
⟨(L
aij+
Maij+
Uaij);Taij,
Iaij,
Faij⟩, where
L,
M,
U are the lower,median and upper bound of triangular number, andT
,
I,
Fare the truth, indeterminacy and falsity degree of triangular neutrosophic number. Then the score function ofaijis as follows:S(aij)
=
(
Laij+
Maij+
Uaij)
3+
(Taij−
Iaij−
Faij) (1) S(aji)=
1 s(aij)=
1/
((
Laij+
Maij+
Uaij)
3+
(
Taij−
Iaij−
Faij)
) (2)If we have more than on decision maker in the evaluation pro-cess then, we should aggregate all decision makers’ opinions to obtain the final comprehensive preference values through taking the mean values of all decision makers’ preferences.
Step 4:Check consistency of decision maker’s judgments. To measure consistency rate divide the consistency index (CI) by a random consistency index (RI). The consistency value (CR) should not exceed 0.1.
The detailed steps for calculating CR presented in [48].
Step 5:Calculate weight of criteria from comparison matrices.
Step 6:For assessing risks apply TOPSIS technique:
– Construct the decision matrix by comparing the probable risks relative to each criterion, via utilizing the triangular
neutrosophic scale which presented inTable 1. If you have
more than decision maker (expert) in your problem then aggregate the decision matrices for obtaining the final deci-sion matrix regarding to experts committee. Thereafter use the score function to transform neutrosophic matrix to crisp matrix by using Eqs.(1)and(2).
– After Constructing decision matrix which composed ofm
for obtaining the normalized decision matrix should be per-formed. Since the crossing of each alternative and criteria denoted asxijand then we will obtain (xij)m∗nmatrix.
The normalized decision matrix obtains by using the following Equation: rij
=
xij√
∑
m i=1x2ij;
i=
1,
2, . . . ,
m; andj=
1,
2, . . . ,
n (3)– Structure the weighted matrix through multiplying criteria’s
weights
w
j, which obtained from AHP by the normalizeddecision matrixrijas follows:
v
ij=
w
j∗
rij (4)– Calculate the positiveA+
and negative ideal solutionA− using the following: A+
=
{
A∗1,
A∗2, . . . ,
A∗n}
= {(max
v
ij|j
∈
J + ),
(minv
ij|j
∈
J − ),
(i=
1,
2, . . . ,
m)} (5) A−=
{
A∗1,
A∗2, . . . ,
A∗n}
= {(min
v
ij|j
∈
J + ),
(maxv
ij|j
∈
J − ),
(i=
1,
2, . . . ,
m)} (6) whereJ+associated with the criteria which have a beneficial influence andJ−
associated with the criteria which have a non-beneficial influence.
– Calculate the Euclidean distance among positive (d+i ) and
negative ideal solution (d−i ) as follows:
d+i
=
√
n∑
j=1 (v
ij−
v
j+) 2,
i=
1,
2, . . .
m (7) d−i=
√
n∑
j=1 (v
ij−
v
− j ) 2,
i=
1,
2, . . .
m (8)– Calculate the relative closeness to the ideal solution and make the final ranking of alternatives.
ci
=
d−i
d+i
+
d−i;
i=
1,
2, . . .
m.
(9)Based on the largestcivalue, begin to rank alternatives.
Step 7: According to your rank of alternatives, take your final decision.
Step 8:Validate your proposed model.
The graphical representation of the proposed integrated methodology presented inFig. 7.
6. Numerical illustration
For achieving the purpose of our research and quantifying risks in supply chain, the supply chain’s risks was divided into 5 parts which involve processes and flows of the supply chain both inner and outer the focal firm. These parts are as follows
1. Distribution /transport, 2. Manufacturing,
Fig. 7. Proposed steps of integrated methodology.
3. Order cycle, 4. Warehousing, and 5. Procurement.
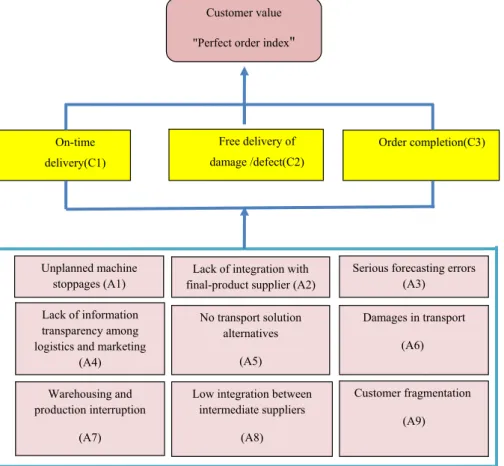
The main objective of supply-chain in our case study is achieving the customer value which drives by ‘‘perfect order’’.
At various production or selling phases, several risk factors exist and affect on achieving goal of supply chain ‘‘customer value’’ through making ‘‘perfect order’’.
We tested the theoretical model in an enterprise which sold non-perishable goods, in other words, items of food with long shelf lives. They did not require any type of refrigeration and did not spoil with time. The fir’s supply chain could have the following tasks: (1) guarantee a high level of service (wanted by the customers) and (2) deal with fragmented few ones (that were of large value with periodic product enhancements) and orders. The desired agility of the firm could suffice the theoretical case of the model. Additionally, the enterprise had many signals of a minimum/maximum value. This could lead to the case that the maximum/ minimum on account of the robust correlation impact between factors. A careful estimation of risk factors should there-fore be appropriate for this case.
By using the proposed methodology for solving this case study the steps will be as follows:
Table 2
The final comparison matrix of criteria according to objective with respect to manager’s opinions.
Objective C1 C2 C3
C1 ⟨(1,1,1);0.50,0.50,0.50⟩ ⟨(1,2,3);0.40,0.65,0.60⟩ ⟨(5,6,7);0.70,0.25,0.30⟩
C2 ⟨(1,1,1);0.50,0.50,0.50⟩ ⟨(3,4,5);0.60,0.35,0.40⟩
C3 ⟨(1,1,1);0.50,0.50,0.50⟩
Step 1:Construct the cognitive map:
In this phase we invited four experts who are: 1. Logistics manager,
2. Warehousing manager, 3. Customer-care director, 4. Purchasing manager.
Our goal in the case study is to achieve customer value which driven from ‘‘perfect order’’.
In order to identify criteria which required for achieving case study objective, we prepared a questionnaire.
A sample of questionnaire which prepared to gather informa-tion about goal’s criteria and the probable risks of supply chain illustrated in Appendix.
The key criteria for achieving objective of our case study accord-ing to experts opinions are as follows:
1. On-time delivery, 2. Order completion,
3. Free delivery of damage/defect.
In order to achieve supply chain goal we should firstly determine all probable risks which surely affect goal, and to do this we asked managers to determine risk factors and problems which could influence their job-objectives. We used the online questionnaire and personal interviews for obtaining information from supply chain experts and make a representation of cognitive map.
The risks which affect the objectives according to expert’s opin-ions were as follows:
1. Unplanned machine stoppages,
2. Lack of integration with final-product supplier, 3. Serious forecasting errors,
4. Lack of information transparency among logistics and mar-keting,
5. No transport solution alternatives, 6. Damages in transport,
7. Warehousing and production interruption, 8. Low integration between intermediate suppliers, 9. Customer fragmentation,
The cognitive map for estimating risks which affect customer value presented inFig. 8.
Step 2:Use the neutrosophic scale which provided inTable 1to construct comparison matrices of criteria which here considered objectives to achieve ‘‘customer value’’. For prioritizing the criteria, the individual estimations of managers from various areas were taken into account. Since we have four experts (managers) in our case study then, we construct the comparison matrix according to each manager’s opinion and aggregate all matrices to obtain final comparison matrix of criteria.
The final comparison matrix of criteria presented inTable 2
Step 3: Use the score function which represented by Eq.(1) to transform neutrosophic matrix to crisp matrix as inTable 3.
Step 4:Check consistency of decision maker’s judgments. By checking consistency of the previous matrix using super decision software, we noted that the matrix is consistent with consistency ratio (CR)
=
1%.Step 5:Calculate weight of criteria from comparison matrices: we used super decision software for calculating weight and presented it inTable 3.
Table 3
The crisp comparison matrix of criteria according to objective with respect to manager’s opinions. Objective C1 C2 C3 Weight C1 1 2 6 0.6 C2 0.5 1 4 0.3 C3 0.17 0.25 1 0.1 Table 4
The normalized decision matrix.
C1 C2 C3 A1 0.8 0.3 0.5 A2 0.5 0.8 0.4 A3 0.3 0.4 0.7 A4 0.6 0.2 0.3 A5 0.4 0.6 0.2 A6 0.3 0.4 0.8 A7 0.7 0.5 0.1 A8 0.1 0.7 0.4 A9 0.2 0.2 0.6
According to sub-objective, on-time delivery is the most sig-nificant sub-objective for achieving overall objective ‘‘customer value’’. It followed by free delivery of damage/defect of required products, and order completion. These three sub-objectives are the key for achieving general objective ‘‘customer value’’.
Since the quantifying process of risks is helpful in fulfilling the objective then, we will measure the weight of each risk for managing and controlling them. In order to measure the probable
risks in our case study which appeared inFig. 8, we will apply
TOPSIS technique.
Step 6: Construct the decision matrix by comparing the prob-able risks relative to each criterion, via utilizing the triangular
neutrosophic scale which presented inTable 1. If you have more
than decision maker (expert) in your problem then aggregates the decision matrices for obtaining the final decision matrix regarding to experts committee. Then use the score function to transform neutrosophic matrix to crisp matrix using Eqs.(1)and(2).
After Constructing the decision matrix which composed ofm
probable risks andn criteria, then a normalization process for
obtaining the normalized decision matrix should be performed. Since the crossing of each alternative and criteria denoted asxijand
then we will obtain (xij)m∗nmatrix.
The normalized decision matrix obtains by using Eq.(3) and
presented inTable 4
Step 7:Structure the weighted matrix through multiplying
cri-teria’s weights
w
j, which obtained from AHP by the normalizeddecision matrixrij.
The weighted matrix presented inTable 5.
Step 8:Calculate the positiveA+and negative ideal solutionA− using Eqs.(5),(6).
A+
= {0
.
48,
0.
24,
0.
08} A−= {0
.
06,
0.
06,
0.
01}Step 9:Calculate the Euclidean distance among positive (d+i ) and negative ideal solution (d−i ) using Eqs.(7),(8).
d+1
= {0
.
53},
d+2= {0
.
18},
d+3= {0
.
48},
d+4= {0
.
22},
d+5= {0
.
25},Fig. 8. The cognitive map for achieving customer value via assessing probable risks. Table 5
The weighted decision matrix.
C1 C2 C3 A1 0.48 0.09 0.05 A2 0.30 0.24 0.04 A3 0.18 0.12 0.07 A4 0.36 0.06 0.03 A5 0.24 0.18 0.02 A6 0.3 0.12 0.08 A7 0.18 0.15 0.01 A8 0.06 0.21 0.04 A9 0.12 0.06 0.06 d+6
= {0
.
21},
d+7= {0
.
32},
d+8= {0
.
42},
d+9= {0
.
40} d−1= {0
.
42},
d−2= {0
.
30},
d−3= {0
.
26},
d−4= {0
.
30} d−5= {0
.
22},
d−6= {0
.
25},
d−7= {0
.
47},
d−8= {0
.
15},
d−9= {0
.
07}Step 10:Calculate the relative closeness to the ideal solution by using Eq.(4), and make the final ranking of alternatives.
c1
=
0.
44,
c2=
0.
62,
c3=
0.
27,
c4=
0.
57,
c5=
0.
46,
c6=
0.
54,
c7
=
0.
95,
c8=
0.
26,
c9=
0.
14.
The rank of risks for showing their harmful impact presented in Table 6.
So, the very harmful risks which affect the achievement of the company goal are presented inFig. 9.
After understanding supply chain of firm and quantifying its potential risks, we can execute an efficient program for supply chain risk management. This program should provide three things: protection of supply chain, reacting to events, and keeping busi-ness operations while regaining from events.
Since the warehousing and production interruption is the most harmful risk on achieving customer value, then the firm must
Table 6
The ranking of probable risks according to its harmful degree. d+ i d − i ci Rank A1 0.53 0.42 0.44 6 A2 0.18 0.30 0.62 2 A3 0.48 0.26 0.27 7 A4 0.22 0.30 0.57 3 A5 0.25 0.22 0.46 5 A6 0.21 0.25 0.54 4 A7 0.32 0.47 0.95 1 A8 0.42 0.15 0.26 8 A9 0.40 0.07 0.14 9
propose a treatment plan to overcome this risk. According to firm’s experts, the interruptions would be at the most danger level when we permit it to impact us long enough after restoring to our premier task.
In order to avoid this risk we should do the following:
•
Plan effectively to ward interruptions,•
Attack procrastination to structure insistence with amputatedeadlines,
•
Limit inputs,•
Batch outputs,•
Communicate warehousing and production schedule tooth-ers,
•
Begin with the main point.•
Split warehousing and product phases into targets.6.1. Comparing proposed work with other existing methods
The proposed methodology which depends on the AHP and the TOPSIS integrated with neutrosophic theory for quantifying risks
Fig. 9. The ranking of risks that affect the achievement of company’s goal.
in a supply chain. It has been estimated and compared with other existent approaches in this section:
The integrated method presented in this research can be ef-fective to quantify risks by following our recommended steps. However, this approach has some drawbacks such as:
•
Their method did not take into account the indeterminacydegree that usually exist in real world and then, the obtained results are not accurate.
•
They considered only the truth membership function, andthis does not represent the natural process of decision mak-ing.
•
They did not provide in their research the detailed steps ofmanaging risks.
•
Their failure to address the vagueness and uncertaintyeffec-tively made their taken decision inaccurate.
Also the analytic hierarchy process has been applied by Gaudenzi
and Antonio [49] for managing risks in supply chain, but their
method has drawbacks:
•
The judgments of decision makers for constructingcompari-son matrices of criteria and alternatives are crisp values.
•
The information given to the decision makers can beincom-plete, vague, and inconsistent in nature, then crisp value was not the right choice.
•
Their methods exactly failed to deal with incomplete, vagueand uncertain information.
•
The obtained results are not accurate, and then the takendecision was not precise.
The author in [50], also managed risks by using qualitative method and also it have drawbacks:
•
The results of qualitative estimation are generally descrip-tive and do not offer an accurate measurement of risk.•
It also requires a great support form quantitative methods.•
The success of the estimation process is determined by themanner it is documented and summarizing the data for processing.
•
The risk management decisions in qualitative methods arenot exactly accurate.
7. Conclusions and future work
Due to the highly vehement environments which supply chains face current and enduring emphasis on growing efficiency, the risks in the supply chain are increased. A supply chain extends over many countries and brings various types of risks. All these types of risks made us try to measure and manage it. The risk is intangible parameters and hard to measure, and almost research topics used qualitative estimation which are generally descriptive and do not offer an accurate measurement of risk.
Some researchers used quantitative methods for measuring risks in supply chain but they failed to consider indeterminacy which exists usually in real world. So, their results were not ac-curate and also their risk management decisions.
In this research we integrated AHP with TOPSIS technique using neutrosophic set for better dealing with uncertainty, vagueness and inconsistency of information. The proposed method could be used in quantifying risks of supply chain, since it was applied to a real case study for validation.
The evaluation process of supply chain risks is presented by using triangular neutrosophic numbers in comparison matrices. For transforming triangular neutrosophic number to its equivalent crisp value we utilized a score function
The suggested methodology has accomplished many advan-tages for transacting with vague and uncertain and inconsistent information that usually exist in estimation process of supply chain risks.
In the future, we will quantify risks in a supply chain by using various MCDM techniques and compare among their results.
Limitation of proposed researchMore involvements from more companies will make our research better.
Competing interests
The authors announce that there is no discrepancy of interests concerning the publication of this research.
Appendix
For determining the most significant criteria to achieve ‘‘customer value’’, we consulted four experts as we illustrated previously in our case study. The prepared questionnaire was as follows:
References
[1] M. Vaziri, K. Tomsovic, T. Gönen, Distribution expansion problem revisited. Part 1 categorical analysis and future directions, Math. Program. 13 (2000) 26.
[2] J.G. March, Z. Shapira, Managerial perspectives on risk and risk taking, Manag. Sci. 33 (1987) 1404–1418.
[3] A.-M. Kuhn, B.J. Youngberg, The need for risk management to evolve to assure a culture of safety, BMJ Qual. Saf. 11 (2002) 158–162.
[4] J. Rosenhead, M. Elton, S.K. Gupta, Robustness and optimality as criteria for strategic decisions, J. Oper. Res. Soc. 23 (1972) 413–431.
[5] A.A. Rampini, S. Viswanathan, G. Vuillemey, Risk management in financial institutions, 2017.
[6] L.K. Comfort, Crisis management in hindsight: Cognition, communication, coordination, and control, Public Adm. Rev. 67 (2007) 189–197.
[7] F. Smarandache Neutrosophic Probability Neutrosophy, Set, and Logic, Amer. Res. Press, Rehoboth, USA, 1998.
[8] P. Liu, Y. Wang, Multiple attribute decision-making method based on single-valued neutrosophic normalized weighted Bonferroni mean, Neural Comput. Appl. 25 (2014) 2001–2010.
[9] S. Chopra, M.S. Sodhi, Managing risk to avoid supply-chain breakdown, MIT Sloan Manag. Rev. 46 (2004) 53.
[10] M.S. Sodhi, B.G. Son, C.S. Tang, Researchers’ perspectives on supply chain risk management, Prod. Oper. Manag. 21 (2012) 1–13.
[11] B. Tomlin, On the value of mitigation and contingency strategies for managing supply chain disruption risks, Manage. Sci. 52 (2006) 639–657.
[12] IBM, Supply chain risk management: a delicate balancing act, White paper, IBM Global Business services, New York, 2008.
[13] M. Hillman, H. Keltz, Managing risk in the supply chain: a quantitative study, AMR Res. (2007) 1–24.
[14] O. Lavastre, A. Gunasekaran, A. Spalanzani, Supply chain risk management in French companies, Decis. Support Syst. 52 (2012) 828–838.
[15] P. Embrechts, R. Frey, A. McNeil, Quantitative methods for risk management, in: Book manuscript, ETH Zürich, 2003.
[16] J.-H. Thun, D. Hoenig, An empirical analysis of supply chain risk management in the German automotive industry, Internat. J. Prod. Econ. 131 (2011) 242– 249.
[17] E. Simangunsong, L.C. Hendry, M. Stevenson, Supply-chain uncertainty: a review and theoretical foundation for future research, Int. J. Prod. Res. 50 (2012) 4493–4523.
[18] A. Diabat, K. Govindan, V.V. Panicker, Supply chain risk management and its mitigation in a food industry, Int. J. Prod. Res. 50 (2012) 3039–3050.
[19] B. Gaudenzi, A. Borghesi, Managing risks in the supply chain using the AHP method, Internat. J. Logist. Manag. 17 (2006) 114–136.
[20] T. Schoenherr, V.R. Tummala, T.P. Harrison, Assessing supply chain risks with the analytic hierarchy process: Providing decision support for the offshoring decision by a US manufacturing company, J. Purch. Supply Manage. 14 (2008) 100–111.
[21] K.S. Bhutta, F. Huq, Supplier selection problem: a comparison of the total cost of ownership and analytic hierarchy process approaches, Supply Chain Manag. Internat. J. 7 (2002) 126–135.
[22] S.H. Huan, S.K. Sheoran, G. Wang, A review and analysis of supply chain operations reference (SCOR) model, Supply Chain Manag. Internat. J. 9 (2004) 23–29.
[23] G. Radivojević, V. Gajović, Supply chain risk modeling by AHP and Fuzzy AHP methods, J. Risk Res. 17 (2014) 337–352.
[24] M. Abdel-Basset, M. Mohamed, F. Smarandache, An extension of neutrosophic AHP–SWOT analysis for strategic planning and decision-making, Symmetry 10 (2018) 116.
[25] M. Abdel-Basset, M. Mohamed, A.K. Sangaiah, Neutrosophic AHP-Delphi Group decision making model based on trapezoidal neutrosophic numbers, J. Ambient Intell. Humanized Comput. (2017) 1–17.
[26] D.M. Lambert, M.C. Cooper, J.D. Pagh, Supply chain management: implemen-tation issues and research opportunities, Internat. J. Logist. Manag. 9 (1998) 1–20.
[27] M. Behzadian, S.K. Otaghsara, M. Yazdani, J. Ignatius, A state-of the-art survey of TOPSIS applications, Expert Syst. Appl. 39 (2012) 13051–13069.
[28] R. Rostamzadeh, M.K. Ghorabaee, K. Govindan, A. Esmaeili, H.B.K. Nobar, Evaluation of sustainable supply chain risk management using an integrated fuzzy TOPSIS-CRITIC approach, J. Cleaner Prod. 175 (2018) 651–669.
[29] A. Samvedi, V. Jain, F.T. Chan, Quantifying risks in a supply chain through integration of fuzzy AHP and fuzzy TOPSIS, Int. J. Prod. Res. 51 (2013) 2433– 2442.
[30] R. Şahin, M. Yiğider, A Multi-criteria neutrosophic group decision making metod based TOPSIS for supplier selection, 2014. ArXiv preprintarXiv:1412. 5077.
[31] P. Chi, P. Liu, An extended TOPSIS method for the multiple attribute decision making problems based on interval neutrosophic set, Neutrosophic Sets Syst. 1 (2013) 63–70.
[32] H. Azizpour, BBN Model with Quantitative Inputs for Risk Analysis of Uncon-trolled Fire in Machinery Space, NTNU, 2016.
[33] S. Frosdick, The techniques of risk analysis are insufficient in themselves, Disaster Prevention Manag. Internat. J. 6 (1997) 165–177.
[34] P.L. Bernstein, Against The Gods: The Remarkable Story of Risk, John Wiley & Sons, Inc. New York, 1998.
[35] R. Tummala, T. Schoenherr, Assessing and managing risks using the supply chain risk management process (SCRMP), Supply Chain Manag. Internat. J. 16 (2011) 474–483.
[36] J.G. March, Z. Shapira, Managerial perspectives on risk and risk taking, Manag. Sci. 33 (1987) 1404–1418.
[37] M. Goh, J.Y. Lim, F. Meng, A stochastic model for risk management in global supply chain networks, European J. Oper. Res. 182 (2007) 164–173.
[38] T. Kull, D. Closs, The risk of second-tier supplier failures in serial supply chains: Implications for order policies and distributor autonomy, European J. Oper. Res. 186 (2008) 1158–1174.
[39] U. Jüttner, H. Peck, M. Christopher, Supply chain risk management: outlining an agenda for future research, Internat. J. Logist. Res. Appl. 6 (2003) 197–210.
[40] H. Peck, Reconciling supply chain vulnerability, risk and supply chain man-agement, Internat. J. Logist. Res. Appl. 9 (2006) 127–142.
[41] I. Heckmann, T. Comes, S. Nickel, A critical review on supply chain risk– Definition, measure and modeling, Omega 52 (2015) 119–132.
[42] G.L. Schlegel, R.J. Trent, Supply Chain Risk Management: An Emerging Disci-pline, Crc Press, 2016.
[43] S.C.R.L. Council, SCRLC emerging risks in the supply chain, Unpublished doc-ument, 2013. Onlinehttp://www.scrlc.com/articles/Emerging_Risks_2013_ feb_v10.pdf.
[44] M.S. Khan, M. Quaddus, Group decision support using fuzzy cognitive maps for causal reasoning, Group Decis. Negot. 13 (2004) 463–480.
[45] T.L. Saaty, L.G. Vargas, Estimating technological coefficients by the analytic hierarchy process, Socio-Econ. Plan. Sci. 13 (1979) 333–336.
[46] M. Abdel-Basset, M. Mohamed, V. Chang, NMCDA: A framework for evaluating cloud computing services, Future Gener. Comput. Syst. 86 (2018) 12–29.
[47] K. Yoon, C. Hwang, TOPSIS (Technique for Order Preference By Similarity to Ideal Solution)–A Multiple Attribute Decision Making, W: Multiple At-tribute Decision Making–Methods and Applications, a State-of-the-At Survey, Springer Verlag, Berlin, 1981.
[48] M. Abdel-Basset, M. Mohamed, Y. Zhou, I. Hezam, Multi-criteria group deci-sion making based on neutrosophic analytic hierarchy process, J. Intell. Fuzzy Syst. 33 (2017) 4055–4066.
[49] B. Gaudenzi, A. Borghesi, Managing risks in the supply chain using the AHP method, Internat. J. Logist. Manag. 17 (2006) 114–136.
[50] V.-S. I.A.C.O.B., Risk management and evaluation and qualitative method within the projects, Ecoforum J. 3 (2014) 10.
Mohamed Abdel-BassetReceived his B.Sc., M.Sc and the Ph.D in operations research from Faculty of Computers and Informatics, Zagazig University, Egypt. He is a head of department of operations research and decision support , Faculty of Computers and Informatics, Zagazig University. His current research interests are Optimization, Opera-tions Research, Data Mining, Computational Intelligence, Applied Statistics Decision support systems , Robust Opti-mization, Engineering OptiOpti-mization, Multi-objective Op-timization, Swarm Intelligence, Evolutionary Algorithms, and Artificial Neural Networks. He is working on the application of multi-objective and robust meta-heuristic optimization techniques. He is also an/a Editor/reviewer in different international journals and conferences. He has published more than 100 articles in international journals and conference proceedings.
M. Gunasekaranis currently working as a big data sci-entist in University of California, United States. He re-ceived his Ph.D. from the Vellore Institute of Technology University, India. He received his Bachelor of Engineer-ing and Master of Technology from Anna University and Vellore Institute of Technology University respectively. He has worked as a Research Assistant for a project on spatial data mining funded by Indian Council of Medi-cal Research, Government of India. His current research interests include data mining, big data analytics and soft computing. He is the author/co-author of papers in conferences, book chapters and journals. He got an award for young investigator from India and Southeast Asia by Bill and Melinda Gates Foundation. He is a member of International Society for Infectious Diseases and Machine Intelligence Research labs.
Mai MohamedReceived her BS degree and master degree from Zagazig University, faculty of computers and infor-matics, Egypt. She is currently research interest is com-putation intelligence, neural networks, and Neutrosophic logic.
Naveen Chilamkurtiis currently working as a Senior Lec-turer at Department of Computer Science and Computer Engineering, La Trobe University, Australia. He received his Ph.D. from La Trobe University. He is also the Inau-gural Editor-in-Chief for International Journal of Wireless Networks and Broadband Technologies launched in July 2011. He has published about 125 journal and confer-ence papers. His current research areas include intelli-gent transport systems (ITS), wireless multimedia, wire-less sensor networks, vehicle to infrastructure, vehicle to vehicle communications, health informatics, mobile communications, WiMAX, mobile security, mobile handover, and RFID. He currently serves on editorial boards of several international journals. He is a senior member of IEEE. He is also an Associate Editor for Wiley IJCS, SCN, Interscience JETWI, and IJIPT.