Resource
Enhanced CLIP Uncovers IMP Protein-RNA Targets
in Human Pluripotent Stem Cells Important for Cell
Adhesion and Survival
Graphical Abstract
Highlights
d
Enhanced CLIP identifies thousands of reproducible IMP1,
IMP2, and IMP3 binding sites
d
IMP1 and IMP2 binding sites are highly correlated in 3
0UTRs
of coding genes
d
Integrins represent a key mechanism for IMP1 modulation of
cell adhesion in hESCs
d
Apoptosis of hESCs resulting from depletion of IMP1 is
mediated by IMP1 target
BCL2
Authors
Anne E. Conway, Eric L. Van Nostrand,
Gabriel A. Pratt, ..., Christopher B. Burge,
D. Leanne Jones, Gene W. Yeo
Correspondence
leannejones@ucla.edu (D.L.J.),
geneyeo@ucsd.edu (G.W.Y.)
In Brief
Using transcriptome-wide mapping with
eCLIP, Conway et al. identify thousands
of IMP1, IMP2, and IMP3 RNA binding
sites in human stem cells, identifying both
overlapping and distinct targets among
IMP proteins. Two IMP1 targets,
ITGB5
and
BCL2
, help mediate IMP1 roles in cell
adhesion and survival.
Accession Numbers
GSE78509
Conway et al., 2016, Cell Reports15, 666–679 April 19, 2016ª2016 The Authors
Cell Reports
Resource
Enhanced CLIP Uncovers IMP Protein-RNA Targets
in Human Pluripotent Stem Cells Important
for Cell Adhesion and Survival
Anne E. Conway,1,2,3,10Eric L. Van Nostrand,1,2,10Gabriel A. Pratt,1,2,4Stefan Aigner,1,2Melissa L. Wilbert,1,2
Balaji Sundararaman,1,2Peter Freese,5Nicole J. Lambert,5Shashank Sathe,1,2Tiffany Y. Liang,1,2Anthony Essex,3
Severine Landais,3Christopher B. Burge,5D. Leanne Jones,3,6,7,*and Gene W. Yeo1,2,8,9,*
1Department of Cellular and Molecular Medicine, University of California at San Diego, La Jolla, CA 92037, USA 2Stem Cell Program and Institute for Genomic Medicine, University of California at San Diego, La Jolla, CA 92037, USA 3Laboratory of Genetics, Salk Institute for Biological Studies, La Jolla, CA 92037, USA
4Department of Bioinformatics and Systems Biology, University of California at San Diego, La Jolla, CA 92093, USA 5Department of Biology, Massachusetts Institute of Technology, Cambridge, MA 02142, USA
6Department of Molecular, Cellular and Developmental Biology, University of California at Los Angeles, Los Angeles, CA 90095, USA 7Eli and Edythe Broad Center of Regenerative Medicine and Stem Cell Research, University of California at Los Angeles, Los Angeles,
CA 90095, USA
8Molecular Engineering Laboratory, A*STAR, Singapore 1190777, Singapore
9Department of Physiology, Yong Loo Lin School of Medicine, National University of Singapore, Singapore 1190777, Singapore 10Co-first author
*Correspondence:leannejones@ucla.edu(D.L.J.),geneyeo@ucsd.edu(G.W.Y.)
http://dx.doi.org/10.1016/j.celrep.2016.03.052
SUMMARY
Human pluripotent stem cells (hPSCs) require precise
control of post-transcriptional RNA networks to
maintain proliferation and survival. Using enhanced
UV crosslinking and immunoprecipitation (eCLIP),
we identify RNA targets of the IMP/IGF2BP family
of RNA-binding proteins in hPSCs. At the broad
re-gion and binding site levels, IMP1 and IMP2 show
reproducible binding to a large and overlapping set
of 3
0UTR-enriched targets. RNA Bind-N-seq applied
to recombinant full-length IMP1 and IMP2 reveals
CA-rich motifs that are enriched in eCLIP-defined
binding sites. We observe that IMP1 loss in hPSCs
re-capitulates IMP1 phenotypes, including a reduction
in cell adhesion and increase in cell death. For cell
adhesion, we find IMP1 maintains levels of integrin
mRNA specifically regulating RNA stability of
ITGB5
in hPSCs. Additionally, we show that IMP1 can be
linked to hPSC survival via direct target
BCL2
. Thus,
transcriptome-wide binding profiles identify hPSC
targets modulating well-characterized IMP1 roles.
INTRODUCTION
Human embryonic stem cells (hESCs) are an invaluable model system to address mechanisms of early human development due to the ability to self-renew and differentiate into the majority of cell types in the mammalian embryo. Recent studies profiling RNA regulatory networks controlled by RNA binding proteins (RBPs), including RBFOX2, LIN28A, and MBNL, have
demon-strated that RBPs play key roles in maintenance of pluripotency through regulating diverse aspects of RNA processing (Han et al., 2013; Wilbert et al., 2012; Yeo et al., 2009).
The IGF2 mRNA binding proteins (IMPs/IGF2BPs) are a highly homologous family of RBPs that are conserved from insects to mammals (Hansen et al., 2004; Nielsen et al., 1999). Humans and mice have three IMPs (IMP1-3/IGF2BP1-3), which are ex-pressed broadly during early development. Protein expression generally decreases in most tissues post-natally, with the excep-tion of sustained expression in the germline in adults (Hammer et al., 2005; Hansen et al., 2004). IMP2 mRNA, however, remains expressed in adult murine tissues (Bell et al., 2013). IMP1 is necessary for proper embryogenesis (Hansen et al., 2004), and IMPs are upregulated in many different types of cancer including lung, liver, breast, and colon, with expression being tightly corre-lated with poor patient prognosis (Dimitriadis et al., 2007; Ross et al., 2001).
Molecular mechanisms of how IMP proteins bind and regulate their target RNAs have been studied predominantly in vitro. Molecules of IMP1 protein bind RNA cooperatively and sequen-tially, dimerizing to form a stable complex with bound RNA via the hnRNP K homology (KH) domains 1–4 (Nielsen et al., 2004). All four KH domains contribute to RNA binding and are important for localization of IMP (Nielsen et al., 2002). Furthermore, both IMP2 and IMP3 are able to heterodimerize on a target RNA with IMP1 via the four KH domains (Nielsen et al., 2004). Identification of IMP1 RNA targets in vivo revealed IMP1 modulates develop-ment and differentiation by regulating various stages of RNA pro-cessing. The namesake target of the IMP family,IGF2, is primarily regulated at the level of translation, but IMP1 can either promote or repress translation of IGF2 depending on cellular context (Dai et al., 2013; Nielsen et al., 1999). IMP1 also controls the localization and translation of neuron-specificTaumRNA in a
differentiation-dependent manner (Atlas et al., 2007) and controls stability ofMYCRNA (Bernstein et al., 1992).
Although these studies in cell lines and model organisms have provided clues into IMP regulation of a small number of RNAs, our understanding of how the IMP-RNA target orchestra is conducted transcriptome-wide in human development is incom-plete. In HEK293 cells,Hafner et al. (2010) surveyed the genome-wide binding preferences of all three IMPs overexpressed with photoactivatable-ribonucleoside-enhanced crosslinking and immunoprecipitation (PAR-CLIP) andJønson et al. (2007) surveyed the RNAs in IMP1 RNP complexes using RNA immu-noprecipitation followed by microarray (RIP-ChIP). However, whether overexpression recapitulates endogenous binding is al-ways a concern with RBPs, and indeed it was recently shown that exogenous expression of IMP1 results in aberrant sedimen-tation in polysomal gradient centrifugation when compared with endogenous protein (Bell et al., 2013). Therefore, to study the normal roles of endogenous IMP proteins in hESCs, we inte-grated two recently developed approaches: enhanced UV cross-linking and immunoprecipitation followed by high-throughput sequencing (eCLIP) to identify the endogenous RNA targets of IMP1, IMP2, and IMP3 in vivo, and RNA Bind-n-seq (RBNS) to uncover the in vitro binding preferences of full-length IMP1 and IMP2 proteins. These approaches revealed highly overlapping binding for IMP1 and IMP2 that was distinct from IMP3, suggest-ing the IMP family plays both redundant and distinct functions in hPSCs. Further, loss of IMP1 leads to defects in cell survival and adhesion in hPSCs that can be partially explained through its
ef-fects on direct targets BCL2 and ITGB5, respectively. Thus, profiling of endogenous IMP1 targets in hPSCs reveals insight into the pathways through which well-characterized IMP1 func-tions are achieved in stem cells.
RESULTS
Enhanced CLIP Identifies Targets of IMP1, IMP2, and IMP3 Proteins in Human Embryonic Stem Cells
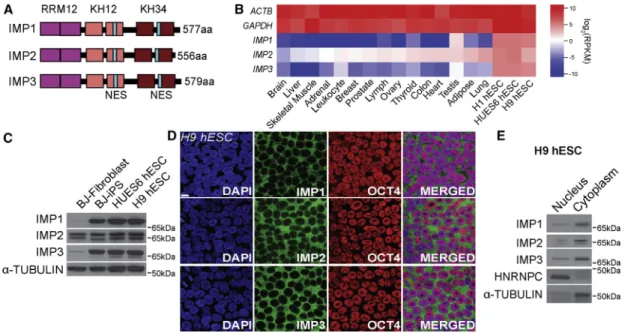
The human IMP family of RNA binding proteins (RBPs) consists of three members (IMP1, IMP2, and IMP3) that contain two RNA recognition motifs (RRMs) and four KH domains each ( Fig-ure 1A). Previous reports have observed significant expression of all three IMP proteins in pluripotent and cancer cell lines, with expression in differentiated tissues mostly limited to IMP2 (Bell et al., 2013). Analyzing public RNA sequencing (RNA-seq) datasets (Marchetto et al., 2013), we confirmed that all three members are highly expressed at the mRNA level in PSCs rela-tive to differentiated tissues (Figure 1B). At the protein level, we validated that IMP1, IMP2, and IMP3 are all expressed in undif-ferentiated human ESC lines H9 and HUES6 and an induced pluripotent stem cell (iPSC) line, whereas IMP2 is also expressed in the parental fibroblasts from which the iPSC line was gener-ated (Figure 1C). Further, immunohistochemical staining ( Fig-ure 1D) and subcellular fractionation (Figure 1E) in H9 hESCs demonstrated dominant cytoplasmic localization of all three IMP proteins. Thus, we selected H9 hESC to identify the RNA tar-gets of IMP proteins in pluripotent stem cells.
Figure 1. Expression Patterns of IMP1, IMP2, and IMP3 RNA Binding Proteins
(A) Domain structure of IMP protein family members, with RNA-recognition motif (RRM) 1-2, hnRNPK-homology (KH) 1-2 and 3-4 domains, and nuclear export signal (NES).
(B) Illumina Bodymap tissue RNA-seq data ofIMP1-3,GAPDH, andACTBmRNA expression (RPKM) in comparison to H1, H9, and HUES6 human embryonic stem cells (hESCs).
(C) IMP protein expression in human fibroblasts, induced pluripotent (iPS), and hESCs by western blot analysis. (D) Immunofluorescence displaying IMP localization in hESCs. Scale bar, 10mm.
To uncover molecular pathways in PSCs regulated by IMP proteins, we utilized an enhanced iCLIP (eCLIP) protocol to iden-tify transcriptome-wide RNA targets of the IMP proteins (Konig et al., 2011; Van Nostrand et al., 2016). Briefly, H9 hESCs were subjected to UV-mediated crosslinking, lysis, and treatment with limiting amount of RNase, followed by immunoprecipitation (IP) of protein-RNA complexes using commercially available antibodies that specifically recognize IMP1, IMP2, or IMP3 ( Fig-ures 2A and S1A). RNA fragments protected from RNase digestion by IMP protein occupancy were subjected to 30RNA linker ligation, reverse-transcription, and 30 DNA linker ligation to generate eCLIP libraries for high-throughput Illumina sequencing. eCLIP improves these ligations to >70% efficiency,
significantly increasing the number of non-PCR duplicate reads that can be obtained after high-throughput sequencing (Van Nostrand et al., 2016). Specificity of the antibodies was evalu-ated by western blotting with recombinant human IMP1, IMP2, and IMP3 proteins (Figure S1A). Co-immunoprecipitation experiments in H1 hESCs demonstrate that the IMP1 and IMP2 antibodies do not enrich any of the other family members, while IMP3 appears to slightly co-immunoprecipitate IMP1 (Figure S1B).
We generated biological replicate eCLIP libraries for IMP1 and IMP2 and single replicates for IMP3, a negative control (IgG-only IP) and an unrelated RBP (RBFOX2) (Figures S1C and S1D). The improved efficiency of eCLIP enabled us to Figure 2. Identification of RNA Binding Targets of IMP1, IMP2, and IMP3 in hESCs by eCLIP
(A) Schematic of enhanced CLIP protocol. In brief, H9 hESCs were subjected to UV-mediated crosslinking, lysis, and treatment with limiting amount of RNase, followed by immunoprecipitation (IP) of protein-RNA complexes. RNA fragments protected from RNase digestion were subjected to 30RNA linker ligation, reverse-transcription and 30DNA linker ligation to generate eCLIP libraries for high-throughput Illumina sequencing. In addition, a size-matched input (SMInput) library was generated for each IMP protein (see theExperimental Proceduresfor further details).
(B) Identification of IMP1-bound regions. For each gene in Gencode v19, read density was counted separately for 30UTR (blue), CDS (red), or introns (teal). Scatterplot indicates fold enrichment for each region in IMP1 eCLIP relative to paired SMInput (y axis), plotted against read density in SMInput (x axis). Open circles indicate significant enrichment (p%105
andR4-fold) in eCLIP relative to SMInput.
(C–F) Scatter plots indicate correlation between region-based fold enrichment in eCLIP for (C) IMP1 biological replicates, (D) IMP1 versus RBFOX2, (E) IMP1 versus IMP2, and (F) IMP1 versus IMP3. For each, regions from all genes meeting a minimal read depth criteria are shown, with least-squares regression line indicated by the dotted line.
(G) Histogram of region-based fold enrichment for IMP family members IMP1, IMP2, and IMP3, unrelated splicing regulator RBFOX2, and an IgG negative control (each compared to its paired SMInput).
generate a size-matched input (SMInput) library for each biolog-ical sample, in which 2% of the pre-immunoprecipitation sample was subjected to identical library generation steps including ribonuclear protein complex size-selection on nitrocellulose membranes. In total, ten eCLIP (including SMInput) libraries were sequenced to15 million reads, of which70% mapped uniquely to the human genome, and58%–93% of the uniquely mapped reads are distinct after accounting for PCR duplicates (Table S1).
Enrichment of IMP1 and IMP2 Binding to 30UTRs
To identify which annotated gene regions are preferentially bound by the IMP proteins, we first evaluated the biological reproducibility of eCLIP (including SMInput) data. Read density within full-length annotated gene regions, namely coding exons (CDS), introns, and 30UTRs, were highly correlated across repli-cates for the IMP proteins (R2values of0.9;Figures S2A and S2B), as well as between IMP proteins and their individually paired SMInput (R2values of0.7; an example IMP1 replicate
is shown inFigure S2C) and IgG (R2values of0.5; example IMP1 replicate shown inFigure S2D). These high correlations were expected due to intrinsic biological biases in gene expres-sion and shared technical variations in shearing and amplifica-tion. Therefore, as a more accurate measure of enrichment (signal) over background, we computed the fold enrichment in the IP in comparison to the paired SMInput within each region (Figures 2B andS2E–S2H;Table S2). Biological replicates of IMP1 and IMP2 showed significant correlation in fold enrichment (R2> 0.46) (Figures 2C andS2I). In contrast, neither IMP1 nor IMP2 showed correlation of binding signal at CDS or 30 UTRs with either IgG or unrelated RBP RBFOX2 (all R2< 0.04;Figures 2D andS2J–S2L).
The region fold enrichments between the paralogs IMP1 and IMP2 were also highly correlated (R2 > 0.37; Figures 2E and
S2M). Unexpectedly, despite having the same domain architec-ture and cytoplasmic localization as IMP1 and IMP2, IMP3 binding within coding exon regions was not correlated with either IMP1 or IMP2 (R2%0.03;Figures 2F andS2N). Further-more, we observed that rather than interacting with a specific limited set of RNA substrates, there was widespread enrich-ment in binding to particular regions within genes, as 30 UTRs were enriched for IMP1 and IMP2 binding by 2.7- to 4.4-fold (median values) above SMInput IP (Figures 2B, 2G, andS2E). This was notably higher than coding exons, which were enriched by only 1.2- to 1.7-fold. Analysis of IMP3 binding re-vealed an opposite trend, as coding exons were 2.9-fold-enriched while 30 UTRs were only 2.3-fold-enriched (Figures 2G and S2F). Consistent with their cytoplasmic localization, depletion of intronic signal globally across all introns was observed for all three IMP family members (depleted 1.9- and 2.3-fold for IMP1, 1.8- and 2.1-fold for IMP2, and 1.7-fold for IMP3, respectively) (Figures 2B, 2G, and S2E–S2H). These global enrichments for coding exons (depleted in both) or 30 UTRs were not observed for IgG or RBFOX2 (1.3-fold-en-riched in IgG, depleted in RBFOX2). We conclude that the IMP1 and IMP2 proteins exhibit remarkably similar binding preferences to 30 UTRs of mature mRNAs, and IMP3 binding is enriched for coding exons.
Discovery of Reproducible IMP1 and IMP2 Binding Sites by Input Normalization
Due to their similarity in 30 UTR preferences, we chose to continue evaluating IMP1 and IMP2. To identify high resolution IMP1 and IMP2 binding sites, standard CLIP-seq cluster discov-ery was performed using CLIPper (Lovci et al., 2013). We identi-fied 62,784 and 95,577 clusters for two biological replicates of IMP1 and 57,648 and 66,928 clusters for IMP2 replicates, with cluster sizes 36–40 bases on average (Figures 3A andS3A;Table S1). Next, as SMInput normalization significantly improves signal-to-noise in identifying true binding sites (Van Nostrand et al., 2016), we compared the read density in IP and SMInput within clusters to compute the enrichment of each cluster above SMInput (Figure S3B). As in the regional comparisons, fold enrichment at the cluster level exhibited high correlation across biological replicates (R values 0.54 and 0.51 for IMP1 and IMP2, respectively), whereas low correlation was observed when IMP1 (or IMP2) was compared to IgG or RBFOX2 (Figures S3C–S3F). Additionally, ranking clusters by fold enrichment makes them amenable to irreproducible discovery rate (IDR) analysis, a stan-dard metric to evaluate the reproducibility of binding sites across biological replicates (Li et al., 2011). We observed that IMP1-IMP1 or IMP2-IMP2 comparisons yielded thousands of repro-ducible clusters at a 0.01 IDR threshold (where 1% of peaks do not reproduce), whereas identical comparisons with IgG or RBFOX2 yielded less than ten reproducible clusters (Figure 3B). These orthogonal computational approaches indicate that eCLIP of IMP1 and IMP2 yield highly reproducible binding at both the cluster and read-density-within-cluster levels.
For further analysis, we identified a set of 1,884 and 7,004 high-confidence peaks in IMP1 and 1,572 and 4,494 in IMP2 that meet stringent enrichment criteria (p%105andR 8-fold-enriched versus SMInput) (Figures 3A and S3A). In contrast, IgG eCLIP identified only 142 clusters that satisfy these criteria. These stringent binding sites were highly reproducible, as over 66% of stringent clusters identified in the first biological replicate overlapped clusters in the second for both IMP1 and IMP2 ( Fig-ures 3A andS3A). Consistent with our regional analyses, IMP1 and IMP2 binding sites were generally located within the 30UTR and to a lesser extent, within coding exons (Figures 3C,
S3I, and S3J). Thus eCLIP identifies thousands of highly confi-dent and reproducible IMP1 and IMP2 binding sites.
High-Resolution IMP1 and IMP2 Binding Is Highly Correlated
As we observed substantial correlation between IMP1 and IMP2 binding at the region level, we next compared IMP1 and IMP2 at the binding site level. Pairwise comparisons indicated 2,495 and 4,301 peaks (at the 0.01 IDR threshold), on par with that observed for biological replicates (Figure 3B). We further observed high correlation of input-normalized signal intensity (R = 0.42 and 0.47 for IMP1Rep1versus IMP2Rep2and IMP1Rep2
versus IMP2Rep1, respectively), indicating that the association
of IMP1 and IMP2 is highly similar across thousands of binding sites (Figures S3G and S3H). To test whether these factors were associating to the same short regions or simply binding nearby each other, we next considered the distribution of read intensity around peak centers. Considering a window of 600-nt
centered on the midpoint of IMP1 peaks from an independent biological replicate, we observed that both IMP1 and IMP2 read density are enriched at the peak centers (Figure 3D). Thus, despite the IMP1 and IMP2 antibodies showing very little cross-immunoprecipitation (Figure S1B), analysis of our eCLIP data at both the region- and cluster-level indicates that IMP1 and IMP2 binding signals are as highly correlated as biological replicates of IMP1 or IMP2.
RNA Bind-N-Seq Identifies CA-Rich Motifs Enriched in Coding and 30UTR Binding Sites
To characterize the sequence specificity of IMP proteins, we applied RNA Bind-N-seq (RBNS) (Lambert et al., 2014) to puri-fied full-length human IMP1 and IMP2. After incubation of protein with randomized RNA pools, affinity purification, and high-throughput sequencing, we performed motif analysis to calcu-late enrichment over input (R) values (Figures 4A, S4A, and S4B). This identified two CA-rich motifs for each IMP: a primary motif exemplified by AY(A)1YA and secondary motif exemplified by Y(A)2YA (Figures 4B and 4C), with many enriched 6-mers
(52% for IMP1, 49% for IMP2) containing one of four 4-mers (CACA, UACA, AACA, CAUA), similar to previously identified IMP motifs (Alipanahi et al., 2015; Hafner et al., 2010; Ray et al., 2013). We observed a high correlation between IMP1 and IMP2 6-mer enrichments (R2= 0.788) (Figure 4D), whereas IMP1 and RBFOX2 were uncorrelated (R2= 0.018) (Figure 4E),
indicating that the RBNS assay captured IMP-specific binding signatures.
Next, we interrogated whether hESC IMP binding sites identi-fied by eCLIP were enriched for the RBNS-identiidenti-fied in vitro motifs. We found that hexamers containing the CACA core sequence were shifted toward higher IMP1 RBNS enrichments, and they also showed greater enrichments among IMP1 eCLIP 30UTR and CDS binding sites than other hexamers (Figures 4F and S4C). Other RBNS motifs (UACA, AACA, CAUA) showed more variable enrichment, suggesting a distinguishable dif-ference between in vitro and in vivo binding predif-ferences (Figures 4F–4H). The enrichment for the CACA motif was more signifi-cant when using the subset of stringent CLIP-enriched peaks, consistent with these peaks having improved signal-to-noise Figure 3. Reproducible Peaks Reveal Correlated Binding of IMP1 and IMP2
(A) Clusters of enriched read density within IMP1 eCLIP are identified for each biological replicate by CLIPper (gray). Comparison of cluster read density in eCLIP and paired SMInput identifies a subset of clusters enriched above SMInput (red/orange; also seeFigure S3B), which show high overlap between replicates (center). SeeFigure S3A for IMP2.
(B) Irreproducible discovery rate (IDR) analysis comparing peak fold enrichment across various datasets are indicated. Rep1 was used unless otherwise indicated.
(C) Pie chart indicates the distribution of significantly enriched IMP1 peak locations across the transcriptome for replicating peaks described in (A). SeeFigure S3I for all (including non-significant) IMP1-enriched clusters andFigure S3J for IMP2.
(D) Plot indicates the normalized read density for indicated eCLIP experiments (Rep2 for IMP1 and IMP2), centered around the midpoint of significantly enriched IMP1 peaks (described in A) identified from an independent biological replicate (Rep1). Read densities across each peak region were normalized within the 600 nt window, and mean (points) and SEM (error bars) were calculated across all peaks for both eCLIP and paired SMInput datasets as indicated.
Figure 4. RNA Bind-N-Seq Identifies an AC-Rich Preference for IMP1 and IMP2 Binding
(A) Schematic of RNA Bind-N-seq (RBNS) protocol.
(B and C) Motif logos with corresponding probability bar graphs made from aligning enriched 5-mers for IMP1 (B) and IMP2 (C). All 5-mers with an enrichment ZscoreR2 with two or fewer mismatches to the most-enriched 5-mer were aligned to create top logo; remaining 5-mers with enrichmentZscoreR2 were aligned to create bottom logo. Probabilities in left bar graph are proportional to the summed enrichments of all 5-mers aligned in each logo.
(D and E) Comparison of 6-mer enrichments (RBNS R values) in IMP2 (D) or RBFOX2 (E) versus IMP1. 6-mers containing one of the top four non-overlapping IMP1 4-mers are colored, and significant enrichment (ZscoreR2) is indicated by dotted lines.
(F–H) Comparison of RBNS and eCLIP k-mer enrichment. 6-mers containing a CACA 4-mer (red), TACA 4-mer (navy), AACA 4-mer (light blue), and TACA 4-mer (magenta) are highlighted. (F–G) IMP1 RBNS enrichment of all 6-mers (x axis) is plotted against (F) enrichment in all reproducible eCLIP 30UTR clusters, or (G) stringent reproducible 30UTR peaks only (as described inFigure 3A). (H) IMP2 RBNS enrichment plotted against motif enrichment in IMP2 stringent eCLIP clusters.
(Figures 4G andS4D). IMP2 showed similar enrichment for CA-rich sequences in both RBNS and eCLIP binding sites ( Fig-ure 4H). Thus, these results demonstrate that IMP1 and IMP2 interact with CA-rich sequences in vitro, and this preference can be observed for coding and 30UTR binding sites in vivo.
Integrated IMP1 eCLIP and RNA-Seq Data Implicates Integrin mRNAs in IMP1-Mediated Cell Adhesion Defects
Next, we utilized our IMP1 binding data to provide insight into the direct regulatory roles of IMP1. To evaluate if loss of IMP1 affected mRNA expression, IMP1 was depleted in H9 hESCs us-ing lentiviral transduction of independent short-hairpin RNAs (shRNAs) that specifically target IMP1 (hereafter referred to as IMP1 knockdown [IMP1KD] cells) (Figures S5A and S5B). Total RNA was extracted from three biologically independent trans-ductions of IMP1 shRNA and two transtrans-ductions of a non-target-ing shRNA to generate RNA-seq libraries, which were then sequenced (Figure S5C). Of the 17,013 expressed genes analyzed, we identified 257 decreased and 467 increased genes with significantly altered expression (R2-fold and p % 0.05 versus non-targeting control) upon IMP1 depletion (Figure S5D). When we compared global IMP1 RNA targets to genes affected by IMP1 depletion, we did not observe any meaningful correla-tion between genes that were bound and trends in gene expres-sion changes (Figure S5E).
Nevertheless, when we considered the most CLIP-enriched 30UTRs for IMP1, we observed significant enrichment for genes involved in cell-cell and cell-extracellular matrix (ECM) adhesion (Figure 5A). As IMP1 regulation of cell adhesion has been well characterized in cancer cell-lines (Gu et al., 2012; Vikesaa et al., 2006), we performed a quantitative crystal violet adher-ence assay following IMP1 depletion to determine whether loss of IMP1 affected adhesion in H9 hESCs. We found that IMP1KD cells showed significantly decreased adherence compared to control shRNA-treated cells (p < 0.05), even within the first hour after plating, indicating that cell adhesion is also affected by loss of IMP1 in hESCs (Figures 5B–5D). We also observed that the actin cytoskeleton and cytoskeletal organization ap-peared disrupted upon IMP1 depletion (Figures S5F and S5G). However, analysis of our RNA-seq data did not indicate altered RNA levels of known IMP1 targets previously shown to modulate cell adhesion, such asCTNNB1(in breast cancer cells) (Gu et al., 2008) orCD44(in adenocarcinoma cells) (Vikesaa et al., 2006). In particular, despite having enriched IMP 30 UTR binding ( Fig-ure S5H), we could observe no mRNA or protein change for CTNNB1 in IMP1KD cells (Figure S5I). Similarly, although the F-actin anchoring, cell adhesion protein vinculin (VCL) was one of the most enriched genes in our eCLIP dataset (over 20-fold-enriched relative to SMInput),VCLdid not appear to be affected at the RNA or protein level upon loss of IMP1 (Figures S5J and S5K). Thus, we observe cell adhesion defects as a consequence of IMP1 depletion in hESCs, but the phenotype cannot be ex-plained simply by regulation through previously characterized IMP1 targets.
Given that IMP1 binding alone was insufficient to predict mRNA level effects, we next focused on IMP1 target genes that harbored enriched binding sites in the 30UTR and whose
levels were also affected in the IMP1KDRNA-seq data. Surpris-ingly, we observed that multiple genes in the integrin family were bound by IMP1 and were downregulated upon depletion of IMP1 (Figures 5E and 5F). Integrins are known to have signif-icant roles in extracellular signaling and cell adhesion across various systems, with ITGB5 and ITGB1 specifically described to play key roles in human stem cell maintenance and cell adhe-sion (Braam et al., 2008). Interestingly, ITGB5 was the most downregulated of all of the integrin genes and contained regions of enriched read density within the 30UTR compared to SMInput or RBFOX2 (Figure 5G). We performed RNA immunoprecipita-tion (RIP) followed by RT-PCR in an independent hESC line (HUES6) and observed IMP1 enrichment onITGB5, withACTB mRNA as a positive control (Ross et al., 1997) (Figure 5H), validating the interaction between IMP1 and ITGB5 mRNA. Additionally, we confirmed downregulation of ITGB5 and
ITGB1mRNAs in IMP1KDcells using two independent shRNAs
(Figure 5I) and further observed significant depletion of ITGB5 protein upon IMP1 loss (Figure 5J).
Next, we considered potential mechanisms for IMP1 regula-tion of ITGB5. To test whether IMP1 affectsITGB5mRNA levels post-transcriptionally at the level of mRNA turnover, we treated hESCs with actinomycin D (ActD) to inhibit the transcription of newly transcribed RNA and collected total RNA after 60 and 120 min. Quantification of mRNA levels by qRT-PCR revealed
thatITGB5was destabilized more quickly in the IMP1KDcells
compared to cells treated with a control shRNA (Figure 5K). Interestingly, ITGB1 did not show this destabilization upon IMP1 depletion (Figure S5L), confirming specificity of this approach and indicating that IMP1 may regulate various integ-rins differently. Taken together, these results indicate that the well-characterized role of IMP1 in maintaining proper cell-cell interactions is conserved in hESCs, but that the downstream effectors in hESCs include unanticipated integrin targets like ITGB5, which is regulated at the level of mRNA turnover.
IMP1 Target BCL2 Enhances Survival of IMP1-Depleted hESCs
In addition to cytoskeletal defects, depletion of IMP1 also led to a drastic reduction in hESC colony size (Figure 6A). Embryoid bodies derived from IMP1KDcells were substantially and consis-tently smaller than those derived from controls (Figure S6A). In order to determine whether depletion of IMP1 led to a decrease in proliferation, which could explain a decrease in colony size, we performed fluorescence-activated cell sorting (FACS) analysis using the proliferation antigen KI-67. We observed only a slight, but insignificant, difference between IMP1-depleted and control cells using two independent shRNAs targeting IMP1 ( Fig-ure S6B). To further analyze a potential role for IMP1 in hESC proliferation, cell-cycle analysis was conducted by BrdU and propidium iodide (PI) staining followed by FACS. IMP1KDcells exhibited a moderate, but significant decrease in the S phase population (p < 0.01), along with an increase in the number of cells in G2 (p < 0.05) (Figure S6C). Supporting the hypothesis that a loss of IMP1 leads to an increase in cell death, we detected a statistically significant increase in Annexin V-positive IMP1KD cells compared to controls by FACS (p < 0.05) (Figure 6B).
Figure 5. IMP1 Controls Integrin RNA Stability and Cell Adhesion in hESC
(A) Gene ontology analysis of genes with significantly enriched IMP1 binding in their 30UTR in both replicates. (B) Western blot displaying levels of IMP1 depletion in the cell-adhesion assay.
(C and D) Quantification (C) and phase contrast images (D) of H9 hESCs stained with crystal violet 1 hr after plating. Scale bar represents 400mm. Data are shown as mean±SD.
(E) RNA-seq analysis of integrin RNA expression changes following loss of IMP1 in hESC. (F) eCLIP 30UTR binding (log2fold enrichment over SMInput) for the integrins shown in (E).
Additionally, we observed a significant increase in levels of cleaved-Caspase 3 upon reduction of IMP1, but not in control-treated hESCs (Figure 6C). Together, these results strongly indi-cate that IMP1 plays an important role in hPSC survival.
To determine the molecular mechanism by which IMP1 im-pacts hESC survival, we examined anti-apoptotic factors in our IMP1KD RNA-seq data as candidate targets of IMP1 and found thatBCL2(B cell lymphoma 2) was decreased by 2-fold (Table S4). This decrease in BCL2 was confirmed at the mRNA level by qRT-PCR (Figure 6D) and at the protein level by western blot analysis (Figures 6C andS6D). Interestingly, the BCL2 30 UTR contains CA-rich sequences (Figure S6E) and was >2-fold-enriched over SMInput in both IMP1 eCLIP data-sets; however, BCL2 fell below our standard significance cutoffs due to low RNA expression (Table S2). Nevertheless, we confirmed IMP1 binding by performing RIP followed by RT-PCR in HUES6 hESCs (Figure 6E). To further investigate IMP binding preferences to CA-rich sequences, as previously shown by RBNS, we performed an electrophoretic mobility shift assay (EMSA) with full-length recombinant human IMP1 protein and both wild-type (WT) and mutated versions of theBCL230UTR (88 bp segments, seeExperimental Procedures). The wild-type ACTBzipcode (IMP binding site) and a truncatedACTBzipcode were used as positive and negative controls, respectively. We were able to detect an interaction between IMP1 and the wild-type BCL2 30 UTR in vitro using 200 nM recombinant IMP1 protein (Figure 6F). Upon mutation of the CACA motif to GAGA, the binding affinity was dramatically reduced, indicating that IMP1 interacts specifically with the CA-rich motif that constitutes an IMP1 binding site withinBCL230 UTR. Finally, to evaluate whether restoring levels of BCL2 can suppress cell death as a consequence of IMP1 depletion, we utilized a doxycycline-inducible lentiviral system (Ardehali et al., 2011) to ectopically ex-press BCL2 in IMP1KDhESCs. Using the Caspase-Glo assay we measured apoptosis following a titration of BCL2 overexpression with doxycycline and found that BCL2 is able to rescue the IMP1KDcell death phenotype (Figures 6G,S6F, and S6G).
There-fore, our data indicate that one pro-survival function of IMP1 in hESCs is to maintain adequate levels of BCL2 mRNA and, consequently, maintain its anti-apoptotic activity.
DISCUSSION
Using systematic, transcriptome-wide mapping with eCLIP, we identified thousands of IMP1, IMP2, and IMP3 binding sites within RNA targets in hESCs. IMP1 and IMP3 are typically viewed as the most related family members, with greater similarity at the protein sequence level (Nielsen et al., 1999), expression patterns across
tissues and development (Bell et al., 2013) and co-immunoprecip-itation during CLIP (Figure S1B), whereas IMP2 has been associ-ated with more distinct roles, such as in metabolism (Dai et al., 2011, 2015; Janiszewska et al., 2012). Thus, hESCs (that express IMP1, IMP2, and IMP3) present a unique opportunity to observe redundant or co-regulation of RNA targets by multiple IMP family members. Surprisingly, we observed substantial overlap between IMP1 and IMP2 binding that was not observed between IMP1 and IMP3, indicating it is not simply an artifact of analyzing cyto-plasmic factors with CLIP. Despite the large number of IMP1-bound mRNAs and quite dramatic phenotypes upon knockdown of IMP1 in hESCs, we observed relatively few transcripts strongly bound by IMP1 to be altered when RNA-seq was performed in hESCs depleted of IMP1. In contrast, previous studies in HEK293 cells observed a small but significant shift toward decreased expression (presumably by decreased RNA stability) of IMP targets when all three IMP proteins were simultaneously depleted (Hafner et al., 2010). These results suggest that IMP fam-ily members may share redundant regulatory roles, particularly during development and in cancer when multiple family members are expressed at high levels. The distinct binding to CDS regions observed for IMP3 suggests that further studies may yet reveal additional regulatory roles distinct from IMP1, although the severe phenotypes observed upon individual knockdown by shRNA of IMP1 and IMP2 presents a challenge to detailed characterization of redundancy among IMP family members in hESCs.
At the region-level, we observed significant IMP1 binding to a substantial fraction of all 30 UTRs. Although such widespread binding has been described for core RNA processing factors, such as the nonsense-mediated decay regulator UPF1 (Lee et al., 2015), previous studies of IMP have largely focused on a small number of specific targets. Although the degree of wide-spread binding is unexpected, it may help to explain why detailed studies of individual IMP targets have not identified one specific mechanism or pathway of regulation; rather, IMP binding has been shown to participate in a broad range of RNA processing regulation steps, including mRNA stability (Leeds et al., 1997), mRNA localization (Atlas et al., 2007; Ross et al., 1997), both inhibition of and enhancement of translation (Dai et al., 2011; Nielsen et al., 1999), and even potentially nuclear export (H€uttelmaier et al., 2005; Wu et al., 2015). Thus, consid-ering IMPs as broad regulators may provide insight into how these factors can achieve these various roles. Future work will be needed to better characterize how different IMP targets are directed toward distinct regulatory mechanisms.
Although standard UV254crosslinking provides specificity by
requiring interacting molecules to have reactive groups within one bond length apart (Wagenmakers et al., 1980), the frequency (G) Read density tracks show read density for IMP1 (Rep2; red), RBFOX2 (blue), and paired SMInputs (gray) across the 30UTR ofITGB5. Clusters are indicated as boxes below tracks, with significantly enriched peaks indicated as darkly colored boxes.
(H) RNA immunoprecipitation forITGB5in HUES6 hESCs.ACTBis shown as a positive control.
(I) qRT-PCR validation ofITGB1andITGB5expression changes by RNA-seq, normalized toHMBS,GAPDH, and18s(error bars represent mean±SEM, n = 3). (J) ITGB1 and ITGB5 protein levels following depletion of IMP1 in H9 hESCs. An average of three independent experiments quantified by densitometry is shown on the right (replicates are normalized to the correspondingb-tubulin sample).
(K) Actinomycin D RNA stability assay. Expression ofITGB5was measured by qRT-PCR at different time points following addition of 10mM actinomycin D in H9 hESCs and normalized toPPIAandRPLP0, genes determined not to change over the given time period (error bars represent mean±SEM, n = 3; a single asterisk indicates significance of p < 0.05 by unpaired t test).
of crosslinking is substantially decreased at non-Uridine bases (Sugimoto et al., 2012), limiting the ability of IMPs to crosslink at a CA-rich motif. Thus, to complement our eCLIP profiling data, we performed RBNS to characterize the in vitro binding motif for full-length IMP1 and IMP2 proteins (each including all six RNA binding domains). This method revealed that recombi-nant IMP1 and IMP2 proteins harbor strong preferences for CA-rich motifs with a degenerate CAU within them, correlating well with the MAHWCA motifs identified for IMP2 and IMP3 using an independent in vitro method RNACompete (Ray et al., 2013) as well as the CA motif identified in DeepBind re-analysis of RNACompete data (Alipanahi et al., 2015). Profiling in vivo by
PAR-CLIP identified a similar but slightly altered motif (CAU) (Hafner et al., 2010), possibly influenced by crosslinking at 4SU nucleotides in PAR-CLIP. These motifs all share strong similarity with motifs described by detailed molecular studies of individual IMP targets (Chao et al., 2010). The CA-rich motif was signifi-cantly enriched in eCLIP peaks, providing further validation that this motif likely represents a major component of IMP1 and IMP2 binding. As IMP binding is often complex, requiring specific spacing of associated motifs to drive dimerization (potentially of multiple IMP family members) (Nielsen et al., 2004), more detailed biochemical studies should provide insight into whether the CA repeat is more critical for binding initiation or Figure 6. IMP1 Promotes Cell Survival through Regulation of BCL2
(A) Phase contrast images of H9 hESCS following depletion of IMP1. Scale bar, 1 mm.
(B) Shown is a representative image of flow cytometry analysis and quantification of Annexin V expression following depletion of IMP1 (error bars represent mean±SD, n = 3).
(C) Cleaved-caspase 3 and BCL2 protein expression following depletion of IMP1 in H9 hESCs by western blot.
(D) qRT-PCR validation ofBCL2expression following depletion of IMP1, with expression normalized to average ofHMBS,GAPDH, and18s(error bars represent mean±SEM, n = 3).
(E) RNA immunoprecipitation (RIP) forBCL2in HUES6 hESCs using antibodies that target either IMP1 or IgG.
(F) EMSA results depicting IMP1 binding preferences forACTBWT,ACTBtruncated,BCL2WT, andBCL2DRNAs. One representative experiment is shown. (G) Caspase-Glo apoptosis assay. BCL2 protein was induced with increasing amounts of doxycycline after which apoptosis was measured via luminescence using the Caspase-Glo 3/7 assay. A single asterisk indicates significance of p < 0.05, and two asterisks indicate significance of p < 0.01, determined by unpaired t test. Data are shown as mean±SD.
stabilization of IMP complexes and what role these other motifs play in directing IMP target recognition.
Given the relatively small transcriptome change observed upon IMP1 knockdown in hESCs, we were surprised to observe that loss of IMP1 led to dramatic cellular phenotypes, including increased apoptosis and a loss of cell adhesion and cytoskeletal integrity. As IMP roles in maintenance of cell adhesion have been previously described (Gu et al., 2012; Vikesaa et al., 2006), we asked whether the cell adhesion defect in hESCs could be ex-plained by known or novel targets. We observed that there was a specific enrichment for downregulation of integrin mRNAs, particularly those most strongly bound by IMP1 (Figure 5). Further analysis validated IMP regulation of the stability of ITGB5. These results indicate that in addition to known IMP1 reg-ulatory targets such asCTNNB1andCD44that play critical roles in maintenance of proper cell adhesion (Gu et al., 2012; Vikesaa et al., 2006), the integrin family represents an additional cell adhesion regulatory mechanism for IMP1. Future work to deter-mine whether integrin regulation by IMP1 is specific to hESCs or affects cell adhesion in other systems and the direct mecha-nisms (including additional co-factors) through which IMP1 bind-ing modulates stability ofITGB5will provide further insight into the cell-type-specificity of the mechanisms through which IMPs regulate cell adhesion.
Although loss of cell adhesion partially explains the dramatic hESC cell viability defect upon IMP1 knockdown, we noted that apoptotic markers were also increased. Global analyses of either eCLIP-bound or differential transcripts did not show gen-eral enrichments for apoptosis or related pathways. However, closer inspection of IMP1 bound and responsive targets
identi-fiedBCL2, which encodes a critical anti-apoptotic protein, as
another IMP1 target that decreases upon IMP1 depletion in hPSCs. Pursuing this further due to the well-characterized roles of BCL2 in mediating apoptotic signals, we found that re-expres-sion of BCL2 in hESCs partially rescued the cell death phenotype resulting from IMP1 depletion in a dose-dependent manner, con-firming the contribution of BCL2 to IMP1 knockdown pheno-types in hESCs. The linkage of IMP1 with direct regulation of BCL2 further associates IMP1 with known oncogenic pathways and may provide an interesting avenue for further studies of IMP1 in other cell types, particularly with respect to understand-ing its roles in modulatunderstand-ing tumorigenesis and metastasis. Thus, our results indicate that we are far from an exhaustive list of func-tional IMP family targets, and further elucidation of the direct and regulated targets of IMP proteins in their various cellular contexts (whether in normal or cancerous cell-types) may provide insights into the distinct and shared roles these proteins play in develop-ment and tumorigenesis.
EXPERIMENTAL PROCEDURES eCLIP-Seq Experimental Procedures
UV-crosslinked (103106
) (400 mJ/cm2
constant energy) H9ES (IMPs, IgG) or H1ES (RBFOX2) cells were lysed in iCLIP lysis buffer and sonicated (BioRuptor). Lysate was treated with RNase I (Ambion) to fragment RNA, after which IMP1 (MBL, #RN007P), IMP2 (MBL, #RN008P), IMP3 (MBL, #RN009P), RBFOX2 (Bethyl Laboratories, #A300-864A), and rabbit IgG (Life Technologies) pro-tein-RNA complexes were immunoprecipitated using the indicated antibody. In addition to the RBP-IPs a parallel size-matched input (SMInput) library was
generated; these samples were not immunoprecipitated with RBP anti-bodies but were otherwise treated identically (to aid in the removal of false pos-itives). One SMInput was used for each biological replicate grouping of all IMP proteins due to their similarity in molecular weight, with a separate SMInput generated for RBFOX2. Stringent washes were performed as described in iCLIP, during which RNA was dephosphorylated with FastAP (Fermentas) and T4 PNK (NEB). Subsequently, a 30 RNA adaptor was ligated onto the RNA with T4 RNA ligase (NEB). Protein-RNA complexes were run on an SDS-PAGE gel, transferred to nitrocellulose membranes, and RNA was isolated off the membrane identically to standard iCLIP. After precipitation, RNA was reverse transcribed with AffinityScript (Agilent), free primer was removed (ExoSap-IT, Affymetrix), and a 30DNA adaptor was ligated onto the cDNA prod-uct with T4 RNA ligase (NEB). Libraries were then amplified with Q5 PCR mix (NEB). SeeVan Nostrand et al. (2016)for further details regarding standardized eCLIP experimental workflows.
eCLIP-Seq Read Processing and Cluster Analysis
Briefly, reads were adaptor trimmed (cutadapt), mapped against repetitive elements (with repeat-mapping reads discarded), and then mapped to the hu-man genome with STAR. PCR duplicate reads were removed, and the second (paired-end) read was used to perform peak-calling with CLIPper (Lovci et al., 2013). Region-level analysis was performed by counting reads overlapping re-gions annotated in Gencode (v19). Input normalization of peaks was per-formed by counting reads mapping to CLIPper-identified peaks in eCLIP and paired SMInput datasets, with significance thresholds of p%105and fold enrichment R8. See theSupplemental Experimental Proceduresfor further details andVan Nostrand et al. (2016)for software packages used and additional description of processing steps.
hPSC Cell Culture
All hPSC lines (including H9, H1, HUES6, and iPSC) lines were grown on Ma-trigel (BD Biosciences) using mTeSR1 medium (Stem Cell Technologies). Cells were routinely passaged using Dispase (2 mg/ml) and scraping the colonies with a glass pipet. For assays requiring single-cell dissociation, Accutase (Innovative Cell Technologies) was used followed by culture medium supple-mented with 10mM Rock Inhibitor Y-26732 (Calbiochem) for 24 hr. See the
Supplemental Experimental Proceduresfor further details.
Lentiviral Vectors, Production, and hESC Infection
If not otherwise indicated, experiments were performed using pLKO lenti-virus constructs TRCN0000075149 for IMP1, TRCN0000255463 for IMP2, TRCN0000074675 for IMP3, and non-target control Sigma #SHC002 (that targets turboGFP). Two additional shRNAs were tested for IMP1, TRCN0000218079 that targeted the CDS (shRNA 2) and TRCN0000230114 that targets the IMP1 30UTR (shRNA 3). Unless otherwise noted, shRNA 3 (TRCN0000230114) was used as the second shRNA for phenotypic experi-ments. See theSupplemental Experimental Proceduresfor additional details.
Adhesion Assay
After virus transduction and puromycin selection, hES cells were plated out at 50,000 cells per well in a 96-well plate coated with Matrigel, incubated for 1 hr at 37C with 5% CO2, vortexed at 2,000 rpm for 15 s, washed three times with
0.1% BSA in DMEM/F12, and fixed with 4% paraformaldehyde for 10 min at room temperature. Following fixation, cells were washed with 0.1% BSA in DMEM/F12 and stained with crystal violet (5 mg/ml in 2% EtOH) for 10 min. Cells were then rinsed with H2O and left to completely dry for 15 min. SDS
(2%) was added for 20 min followed by absorbance reading on a plate reader. Data are represented as mean±SD, with statistical significance calculated by unpaired t test.
BCL2 Rescue Apoptosis Assay
H9 hESCs expressing control and IMP1 shRNAs were split into four biological replicates each and transduced with dox-inducible BCL2 viruses. After 24 hr, three replicates were each re-plated into four wells of a 96-well plate at a density of 20,000 cells per well. A titration of doxycycline was added for 24 hr after which apoptosis was measured by the Caspase-Glo 3/7 assay (Promega). The Caspase-Glo 3/7 assay was performed according to the
manufacturer’s instructions. The fourth replicate was collected in parallel for western blot analysis of BCL2 induction. Luminescence and fluorescence data were averaged across the four technical replicate wells and are repre-sented as mean±SD of biological replicates, with statistical significance calculated by unpaired t test.
Western Blot
Cells were washed with PBS and lysed with lysis buffer (10 mM Tris-HCl [pH 8], 150 mM NaCl, 1% Triton X-100 and complete protease inhibitor mixture [Roche]). Total protein extracts were run on 4%–12% NuPAGE Bis-Tris gels in NuPAGE MOPS running buffer (Thermo Fisher), transferred to nitrocellulose membranes (Amersham Biosciences) and analyzed using primary antibodies. Primary antibodies were incubated overnight at 4C and secondary HRP con-jugated antibodies (Jackson ImmunoResearch, 1:10,000) were incubated for 1 hr at room temperature. Thermo Pierce ECL detection reagents were used. See theSupplemental Experimental Proceduresfor full list of antibodies used.
RNA Extraction and qRT-PCR Analysis
Total RNA was isolated using Trizol Reagent (Invitrogen) according to the man-ufacturer’s recommendations, DNase treated with Turbo DNA-free kit (Am-bion), and cDNA synthesized from 2mg total RNA using the SuperScript III Reverse Transcriptase kit for qRT-PCR (Invitrogen). Both random hexamers and oligo(dT) primers were used for reverse transcription. Real-time PCR was performed using the SYBR-Green FAST qPCR Master mix (Applied Bio-systems) on a CFX384 Touch Real-Time PCR Detection System (Bio-Rad). Values of gene expression were normalized using an average of18s,GAPDH, andHMBSwith the exception of the Actionmycin D experiments (seeFigure 5K andExperimental Proceduresfor details) and are shown as fold change rela-tive to the value of the control shRNA-treated sample. All experiments were performed in technical and biological triplicates. Bars indicate mean±SEM as measured by theDDCt method. Significance was determined by unpaired t test between the control shRNA sample and IMP1 shRNA sample. See the
Supplemental Experimental Proceduresfor primer sequences used.
Actinomycin D RNA Stability Assay
H9 hESCs were treated with 10mg/ml actinomycin D (Sigma) and RNA was isolated using Trizol at time 0 (no treatment), 60 min, and 120 min after treatment. RNA decay was measured with qRT-PCR normalized to the amount of RNA at time 0 (seeRNA Extraction and qRT-PCR Analysis). Values of gene expression were normalized usingPPIAandRPLP0, genes deter-mined not to change over the given time period following addition of actino-mycin D.
RNA Immunoprecipitation Assay in hESCs
RNA immunoprecipitation (RIP) was performed with an input of203106
un-crosslinked HUES6 hES cells lysed with CLIP lysis buffer (Wilbert et al., 2012). A total of 5mg of each antibody, Rabbit IgG (Santa Cruz, #SC-2027) and IMP1 (MBL, #RN007P), were coupled to Protein G Dynabeads (Invitrogen) and incubated with pre-cleared cell lysate overnight on rotation at 4C. Immuno-precipitated RNA was isolated from beads using 1 ml Trizol according to the manufacturer’s instructions and reverse-transcribed using the SuperScript III Reverse Transcriptase kit. Endpoint RT-PCR was performed using Crimson Taq DNA Polymerase (NEB).
Electrophoretic Mobility Shift Assay
IMP1 electrophoretic mobility shift assay (EMSA) was performed based on the conditions used in Farina et al. (2003). Binding reactions contained the following: 10 mM Tris [pH 7.5], 50 mM NaCl, 1 mM MgCl2, 0.5 mM EDTA,
0.5 mM DTT, 4% glycerol, 100 ngEscherichia colitRNA (Roche), 10,000 cpm of the32
P-labeled target RNA, and increasing amounts of recombinant human IMP1 protein (Origene #TP316226) to a final volume of 20ml. Reactions were incubated for 30 min at room temperature followed by 15 min on ice. Reactions were loaded on 5% nondenaturing polyacrylamide TGE gels con-taining 5% glycerol and run at 150 V for 2 hr. Following electrophoresis, gels were dried and exposed to phosphoimager film. See theSupplemental Exper-imental Proceduresfor further details.
RNA Bind-N-Seq
RNA Bind-N-seq (RBNS) was performed on full-length GST-SBP-tagged IMP1 and IMP2 as previously described (Lambert et al., 2014). The motif fre-quency in the RBP-selected pool divided by the frefre-quency in the input RNA library was calculated for allk-mers (k= 4, 5, 6) and defined as the motif enrichment (R) value. Mean and SD of R values were calculated across all k-mers for eachk(4-mers, 5-mers, and 6-mers), with significance thresholds set atZscoreR 2. Enrichments from the protein concentration with the greatest enrichment were used for comparison with CLIP peaks, compared against same-sized regions randomly selected from the same genomic re-gion (e.g., 30UTRs or CDS). See theSupplemental Experimental Procedures
for additional details.
ACCESSION NUMBERS
The accession number for the IMP eCLIP and knockdown RNA-seq data re-ported in this paper is GEO: GSE78509. The accession numbers for the Bind-N-Seq datasets reported in this paper are ENCODE DCC (https://www. encodeproject.org): ENCSR928XOW (IMP1) and ENCSR588GYZ (IMP2).
SUPPLEMENTAL INFORMATION
Supplemental Information includes Supplemental Experimental Procedures, six figures, and four tables and can be found with this article online athttp:// dx.doi.org/10.1016/j.celrep.2016.03.052.
AUTHOR CONTRIBUTIONS
Conceptualization, A.E.C., E.L.V.N., M.L.W., D.L.J., and G.W.Y; Investigation, A.E.C., E.L.V.N., S.A., B.S., M.L.W., T.Y.L., P.F., and N.J.L.; Validation, A.E. and S.L.; Formal Analysis, A.E.C., E.L.V.N., G.A.P., and S.S.; Writing – Original Draft, A.E.C., E.L.V.N., M.L.W., D.L.J., and G.W.Y.; Writing – Review & Editing, A.E.C., E.L.V.N., D.L.J., and G.W.Y.; Funding Acquisition, C.B.B., D.L.J., and G.W.Y.; Supervision, D.L.J. and G.W.Y.
ACKNOWLEDGMENTS
We thank members of the D.L.J. and G.W.Y. labs for constructive discussions and comments on the manuscript and the Salk Institute Stem Cell Core, espe-cially Dr. Travis Berggren, Margaret Lutz, and Ken Diffenderfer for their invalu-able assistance. We thank Patrick Liu for computational analysis assistance and Reza Ardehali, Matt Inlay, and Irving Weissman for sharing BCL2 plas-mids. This work was supported by the Eli and Edythe Broad Center of Regen-erative Medicine and Stem Cell Research at the University of California, Los Angeles, and a California Institute of Regenerative Medicine (CIRM) New Fac-ulty Award (RN1-00544) to D.L.J. and by grants from the NIH (HG004659, NS075449, and U54HG007005) and CIRM (RB1-01413 and RB3-05009) to G.W.Y., and was partially supported by NIH grant HG007005 to C.B.B. A.E.C. and M.L.W. were supported in part by the University of California, San Diego, Genetics Training Program through an institutional training grant from the NIGMS, T32 GM008666. S.L. and A.E. were supported by Pioneer postdoctoral fellowship awards from the Salk Institute for Biological Studies. M.L.W. was a CIRM pre-doctoral fellow. E.L.V.N. is a Merck Fellow of the Damon Runyon Cancer Research Foundation (DRG-2172-13), and G.W.Y. was an Alfred P. Sloan Research Fellow.
Received: December 24, 2015 Revised: February 17, 2016 Accepted: March 11, 2016 Published: April 7, 2016
REFERENCES
Alipanahi, B., Delong, A., Weirauch, M.T., and Frey, B.J. (2015). Predicting the sequence specificities of DNA- and RNA-binding proteins by deep learning. Nat. Biotechnol.33, 831–838.
Ardehali, R., Inlay, M.A., Ali, S.R., Tang, C., Drukker, M., and Weissman, I.L. (2011). Overexpression of BCL2 enhances survival of human embryonic stem cells during stress and obviates the requirement for serum factors. Proc. Natl. Acad. Sci. USA108, 3282–3287.
Atlas, R., Behar, L., Sapoznik, S., and Ginzburg, I. (2007). Dynamic associ-ation with polysomes during P19 neuronal differentiassoci-ation and an untrans-lated-region-dependent translation regulation of the tau mRNA by the tau mRNA-associated proteins IMP1, HuD, and G3BP1. J. Neurosci. Res.85, 173–183.
Bell, J.L., Wa¨chter, K., M€uhleck, B., Pazaitis, N., Ko¨hn, M., Lederer, M., and H€uttelmaier, S. (2013). Insulin-like growth factor 2 mRNA-binding proteins (IGF2BPs): post-transcriptional drivers of cancer progression? Cell. Mol. Life Sci.70, 2657–2675.
Bernstein, P.L., Herrick, D.J., Prokipcak, R.D., and Ross, J. (1992). Control of c-myc mRNA half-life in vitro by a protein capable of binding to a coding region stability determinant. Genes Dev.6, 642–654.
Braam, S.R., Zeinstra, L., Litjens, S., Ward-van Oostwaard, D., van den Brink, S., van Laake, L., Lebrin, F., Kats, P., Hochstenbach, R., Passier, R., et al. (2008). Recombinant vitronectin is a functionally defined substrate that sup-ports human embryonic stem cell self-renewal via alphavbeta5 integrin. Stem Cells26, 2257–2265.
Chao, J.A., Patskovsky, Y., Patel, V., Levy, M., Almo, S.C., and Singer, R.H. (2010). ZBP1 recognition of beta-actin zipcode induces RNA looping. Genes Dev.24, 148–158.
Dai, N., Rapley, J., Angel, M., Yanik, M.F., Blower, M.D., and Avruch, J. (2011). mTOR phosphorylates IMP2 to promote IGF2 mRNA translation by internal ri-bosomal entry. Genes Dev.25, 1159–1172.
Dai, N., Christiansen, J., Nielsen, F.C., and Avruch, J. (2013). mTOR complex 2 phosphorylates IMP1 cotranslationally to promote IGF2 production and the proliferation of mouse embryonic fibroblasts. Genes Dev.27, 301–312.
Dai, N., Zhao, L., Wrighting, D., Kra¨mer, D., Majithia, A., Wang, Y., Cracan, V., Borges-Rivera, D., Mootha, V.K., Nahrendorf, M., et al. (2015). IGF2BP2/IMP2-Deficient mice resist obesity through enhanced translation of Ucp1 mRNA and Other mRNAs encoding mitochondrial proteins. Cell Metab.21, 609–621.
Dimitriadis, E., Trangas, T., Milatos, S., Foukas, P.G., Gioulbasanis, I., Courtis, N., Nielsen, F.C., Pandis, N., Dafni, U., Bardi, G., and Ioannidis, P. (2007). Expression of oncofetal RNA-binding protein CRD-BP/IMP1 predicts clinical outcome in colon cancer. Int. J. Cancer121, 486–494.
Farina, K.L., Huttelmaier, S., Musunuru, K., Darnell, R., and Singer, R.H. (2003). Two ZBP1 KH domains facilitate beta-actin mRNA localization, granule forma-tion, and cytoskeletal attachment. J. Cell Biol.160, 77–87.
Gu, W., Wells, A.L., Pan, F., and Singer, R.H. (2008). Feedback regulation be-tween zipcode binding protein 1 and beta-catenin mRNAs in breast cancer cells. Mol. Cell. Biol.28, 4963–4974.
Gu, W., Katz, Z., Wu, B., Park, H.Y., Li, D., Lin, S., Wells, A.L., and Singer, R.H. (2012). Regulation of local expression of cell adhesion and motility-related mRNAs in breast cancer cells by IMP1/ZBP1. J. Cell Sci.125, 81–91.
Hafner, M., Landthaler, M., Burger, L., Khorshid, M., Hausser, J., Berninger, P., Rothballer, A., Ascano, M., Jr., Jungkamp, A.C., Munschauer, M., et al. (2010). Transcriptome-wide identification of RNA-binding protein and microRNA target sites by PAR-CLIP. Cell141, 129–141.
Hammer, N.A., Hansen, Tv., Byskov, A.G., Rajpert-De Meyts, E., Grøndahl, M.L., Bredkjaer, H.E., Wewer, U.M., Christiansen, J., and Nielsen, F.C. (2005). Expression of IGF-II mRNA-binding proteins (IMPs) in gonads and testicular cancer. Reproduction130, 203–212.
Han, H., Irimia, M., Ross, P.J., Sung, H.K., Alipanahi, B., David, L., Golipour, A., Gabut, M., Michael, I.P., Nachman, E.N., et al. (2013). MBNL proteins repress ES-cell-specific alternative splicing and reprogramming. Nature498, 241–245.
Hansen, T.V.O., Hammer, N.A., Nielsen, J., Madsen, M., Dalbaeck, C., Wewer, U.M., Christiansen, J., and Nielsen, F.C. (2004). Dwarfism and impaired gut development in insulin-like growth factor II mRNA-binding protein 1-deficient mice. Mol. Cell. Biol.24, 4448–4464.
H€uttelmaier, S., Zenklusen, D., Lederer, M., Dictenberg, J., Lorenz, M., Meng, X., Bassell, G.J., Condeelis, J., and Singer, R.H. (2005). Spatial regulation of beta-actin translation by Src-dependent phosphorylation of ZBP1. Nature
438, 512–515.
Janiszewska, M., Suva`, M.L., Riggi, N., Houtkooper, R.H., Auwerx, J., Cle´ment-Schatlo, V., Radovanovic, I., Rheinbay, E., Provero, P., and Stamen-kovic, I. (2012). Imp2 controls oxidative phosphorylation and is crucial for pre-serving glioblastoma cancer stem cells. Genes Dev.26, 1926–1944.
Jønson, L., Vikesaa, J., Krogh, A., Nielsen, L.K., Hansen, Tv., Borup, R., John-sen, A.H., ChristianJohn-sen, J., and NielJohn-sen, F.C. (2007). Molecular composition of IMP1 ribonucleoprotein granules. Mol. Cell. Proteomics6, 798–811.
Konig, J., Zarnack, K., Rot, G., Curk, T., Kayikci, M., Zupan, B., Turner, D.J., Luscombe, N.M., and Ule, J. (2011). iCLIP–transcriptome-wide mapping of protein-RNA interactions with individual nucleotide resolution. J. Vis. Exp. (50), 2638.
Lambert, N., Robertson, A., Jangi, M., McGeary, S., Sharp, P.A., and Burge, C.B. (2014). RNA Bind-n-Seq: quantitative assessment of the sequence and structural binding specificity of RNA binding proteins. Mol. Cell54, 887–900.
Lee, S.R., Pratt, G.A., Martinez, F.J., Yeo, G.W., and Lykke-Andersen, J. (2015). Target discrimination in nonsense-mediated mRNA decay requires Upf1 ATPase activity. Mol. Cell59, 413–425.
Leeds, P., Kren, B.T., Boylan, J.M., Betz, N.A., Steer, C.J., Gruppuso, P.A., and Ross, J. (1997). Developmental regulation of CRD-BP, an RNA-binding protein that stabilizes c-myc mRNA in vitro. Oncogene14, 1279–1286.
Li, Q., Brown, J.B., Huang, H., and Bickel, P.J. (2011). Measuring reproduc-ibility of high-throughput experiments. Ann. Appl. Stat.5, 1752–1779.
Lovci, M.T., Ghanem, D., Marr, H., Arnold, J., Gee, S., Parra, M., Liang, T.Y., Stark, T.J., Gehman, L.T., Hoon, S., et al. (2013). Rbfox proteins regulate alter-native mRNA splicing through evolutionarily conserved RNA bridges. Nat. Struct. Mol. Biol.20, 1434–1442.
Marchetto, M.C., Narvaiza, I., Denli, A.M., Benner, C., Lazzarini, T.A., Nathan-son, J.L., Paquola, A.C., Desai, K.N., Herai, R.H., Weitzman, M.D., et al. (2013). Differential L1 regulation in pluripotent stem cells of humans and apes. Nature
503, 525–529.
Nielsen, J., Christiansen, J., Lykke-Andersen, J., Johnsen, A.H., Wewer, U.M., and Nielsen, F.C. (1999). A family of insulin-like growth factor II mRNA-binding proteins represses translation in late development. Mol. Cell. Biol.19, 1262– 1270.
Nielsen, F.C., Nielsen, J., Kristensen, M.A., Koch, G., and Christiansen, J. (2002). Cytoplasmic trafficking of IGF-II mRNA-binding protein by conserved KH domains. J. Cell Sci.115, 2087–2097.
Nielsen, J., Kristensen, M.A., Willemoe¨s, M., Nielsen, F.C., and Christiansen, J. (2004). Sequential dimerization of human zipcode-binding protein IMP1 on RNA: a cooperative mechanism providing RNP stability. Nucleic Acids Res.
32, 4368–4376.
Ray, D., Kazan, H., Cook, K.B., Weirauch, M.T., Najafabadi, H.S., Li, X., Guer-oussov, S., Albu, M., Zheng, H., Yang, A., et al. (2013). A compendium of RNA-binding motifs for decoding gene regulation. Nature499, 172–177.
Ross, A.F., Oleynikov, Y., Kislauskis, E.H., Taneja, K.L., and Singer, R.H. (1997). Characterization of a beta-actin mRNA zipcode-binding protein. Mol. Cell. Biol.17, 2158–2165.
Ross, J., Lemm, I., and Berberet, B. (2001). Overexpression of an mRNA-bind-ing protein in human colorectal cancer. Oncogene20, 6544–6550.
Sugimoto, Y., Ko¨nig, J., Hussain, S., Zupan, B., Curk, T., Frye, M., and Ule, J. (2012). Analysis of CLIP and iCLIP methods for nucleotide-resolution studies of protein-RNA interactions. Genome Biol.13, R67.
Van Nostrand, E.L., Pratt, G.A., Shishkin, A.A., Gelboin-Burkhart, C., Fang, M.Y., Sundararaman, B., Blue, S.M., Nguyen, T.B., Surka, C., Elkins, K., et al. (2016). Robust transcriptome-wide discovery of RNA binding protein binding sites with enhanced CLIP (eCLIP). Nat. Methods, Published online March 28, 2016.http://dx.doi.org/10.1038/nmeth.3810.
Vikesaa, J., Hansen, T.V., Jønson, L., Borup, R., Wewer, U.M., Christiansen, J., and Nielsen, F.C. (2006). RNA-binding IMPs promote cell adhesion and inva-dopodia formation. EMBO J.25, 1456–1468.
Wagenmakers, A.J., Reinders, R.J., and van Venrooij, W.J. (1980). Cross-link-ing of mRNA to proteins by irradiation of intact cells with ultraviolet light. Eur. J. Biochem.112, 323–330.
Wilbert, M.L., Huelga, S.C., Kapeli, K., Stark, T.J., Liang, T.Y., Chen, S.X., Yan, B.Y., Nathanson, J.L., Hutt, K.R., Lovci, M.T., et al. (2012). LIN28 binds
messenger RNAs at GGAGA motifs and regulates splicing factor abundance. Mol. Cell48, 195–206.
Wu, B., Buxbaum, A.R., Katz, Z.B., Yoon, Y.J., and Singer, R.H. (2015). Quan-tifying protein-mRNA interactions in single live cells. Cell162, 211–220.
Yeo, G.W., Coufal, N.G., Liang, T.Y., Peng, G.E., Fu, X.D., and Gage, F.H. (2009). An RNA code for the FOX2 splicing regulator revealed by mapping RNA-protein interactions in stem cells. Nat. Struct. Mol. Biol.