Nijmegen
The following full text is a preprint version which may differ from the publisher's version.
For additional information about this publication click this link.
http://hdl.handle.net/2066/92445
Please be advised that this information was generated on 2016-08-23 and may be subject to
change.
arXiv:1104.1053v1 [astro-ph.GA] 6 Apr 2011
The connection between radio-loudness and central surface
brightness profiles in optically-selected low-luminosity
active galaxies
A. J. Richings
1, P. Uttley
1and E. K¨
ording
21School of Physics and Astronomy, University of Southampton, Southampton, S017 1BJ, UK 2Radboud Universiteit Nijmegen, Dept. Astronomy, IMAPP, The Netherlands
7 April 2011
ABSTRACT
Recent results indicate a correlation between nuclear radio-loudness of active galaxies and their central stellar surface-brightness profiles, in that ‘core’ galaxies (with inner
logarithmic slopeγ60.3) are significantly more radio loud than ‘power-law’ galaxies
(γ > 0.5). This connection, which indicates possible links between radio-loudness
and galaxy formation history (e.g. through black hole spin) has so far only been confirmed for a radio-selected sample of galaxies. Furthermore, it has since been shown that the Nuker law, which was used to parameterise the brightness profiles in these studies, gives a poor description of the brightness profile, with its parameters varying systematically with the radial fitted extent of the profile. Here, we present an analysis
of the central surface brightness profiles of the active galaxies of Hubble TypeT 63,
that were identified by the optically-selected Palomar spectroscopic survey of nearby galaxies. We fit the brightness profiles using S´ersic, Core-S´ersic and, where necessary, Double-S´ersic models, which we fit to the semi-major axis brightness profiles extracted
from high resolution images of the galaxies from the Hubble Space Telescope (HST).
We use these fits to classify the galaxies as ‘Core’, ‘S´ersic’ or ‘Double-S´ersic’. We compare the properties of the Active Galactic Nuclei (AGNs) and their host galaxies with this classification, and we recover the already established trend for Core galaxies to be more luminous and contain a higher-mass supermassive black hole. Defining the radio-loudness of an AGN as the ratio of the nuclear radio luminosity to [Oiii] line luminosity, which allows us to include most of the AGN in our sample and prevents a bias against dim nuclei that are harder to extract from the brightness profiles, we find that AGN hosted in Core galaxies are generally more radio-loud than those hosted in S´ersic galaxies, although there is a large overlap between the two subsamples. The correlation between radio-loudness and brightness profile can partly be explained by a correlation between radio-loudness and black hole mass. Additionally, there is a significant (99 per cent confidence) partial correlation between radio-loudness and the Core/S´ersic classification of the host galaxy, which lends support to the previous results based on the radio-selected sample, although it is possible that this partial correlation arises because AGN in core galaxies tend to have a lower accretion rate as well as a higher central black hole mass.
Key words: galaxies: active – galaxies: jets – galaxies: nuclei – galaxies: photometry
– radio continuum: galaxies
1 INTRODUCTION
Before theHubble Space Telescope(HST) was launched, ob-servations of the central regions of galaxies were limited by atmospheric seeing, which prevented resolutions better than
∼1′′ from being achieved. This made it difficult to deter-mine how the brightness profiles of these galaxies behaved at small radii. However, high resolution images taken with the
HST(Crane et al. 1993; Ferrarese et al. 1994; Forbes et al. 1995) demonstrated that the surface brightness profiles of el-liptical galaxies and disk galaxy bulges continue to increase up to the resolution limit, confirming the results of ground-based observations (Kormendy 1985; Lauer 1985) that con-cluded that the profiles of most elliptical galaxies cannot
be described by models with flat, isothermal cores such as described by King (1966).
Early studies using HST suggested that the central brightness profiles can be divided into two distinct classes — in “power-law” galaxies, the logarithmic slope of the bright-ness profile remained steep towards the resolution limit of
HST, while in “core” galaxies the slope flattened signifi-cantly. To describe these brightness profiles in the central re-gions, Lauer et al. (1995) introduced a form of broken power law, the so-called “Nuker-law”, with the logarithmic slope in the inner region,γ, being flatter than in the outer region. These classes then correspond to a dichotomy in the val-ues ofγ, with power-law galaxies having γ >0.5 and core galaxies having γ 6 0.3. Faber et al. (1997) demonstrated that there were no galaxies in the range 0.3< γ <0.5, al-though subsequent studies (e.g. Ravindranath et al. 2001) have found a small number of such “intermediate” galaxies. This dichotomy in brightness profiles has been linked to global galaxy properties, for example core galaxies tend to be very luminous, slowly rotating galaxies with boxy isophotes, while power-law galaxies tend to be less luminous, rapidly rotating galaxies with disky isophotes (Jaffe et al. 1994; Faber et al. 1997). For galaxies that contain active galactic nuclei (AGNs) some of these properties of the host galaxy also correlate with properties of the AGN, for ex-ample the mass of the central supermassive black hole (SMBH) correlates strongly with the velocity dispersion of the host galaxy (Ferrarese & Merritt 2000; Gebhardt et al. 2000), suggesting that the evolution of the host galaxy and AGN are interdependent. Investigating how the brightness profiles of the central regions of these host galaxies are re-lated to the properties of the AGN is important in under-standing how they influence one another and how they form and evolve together, for example Faber et al. (1997) propose a model whereby a merger between two galaxies can pro-duce a core galaxy as their black holes sink to the centre, ejecting stars in the central region and scouring out a core, while van der Marel (1999) suggests that the cusp slopes of core and power-law galaxies can be reproduced by adiabatic growth of the black hole in an isothermal core.
More recent studies (e.g. Graham et al. 2003; Ferrarese et al. 2006a) have shown that the Nuker model does not give an accurate parameterization of galaxy surface brightness profiles. It was only intended to model the central regions and so cannot describe the brightness profiles at larger radii, where the outer power law of the Nuker model fails to properly fit the curvature of the brightness profiles in most galaxies, and Graham et al. (2003) demonstrate that the parameters of the Nuker model are sensitive to the radial extent of the profile to which it is fitted. However, the brightness profiles of “power-law” galaxies are well fitted by either a S´ersic law over their entire radial extent, or by a S´ersic law modified with the addition of a second S´ersic component, the latter meant to represent an inner compact stellar nucleus (generally below a few tenths of an arcsec). Meanwhile, “core” galaxies show a central deficit with respect to their outer S´ersic profile (Trujillo et al. 2004; Ferrarese et al. 2006b). This provides an alternative classification to the core/power law dichotomy based on inner logarithmic slope, in which galaxies can be separated into those that are well fitted by a S´ersic law at all radii, those that require an additional
inner S´ersic component to account for an inner compact stellar nucleus and those that show a central deficit from their outer S´ersic profile. The profiles of galaxies that show a central deficit can be parameterized by a “Core-S´ersic” model (introduced by Graham et al. 2003) that combines a S´ersic profile at large radii with a power law in the central regions (see e.g. Graham 2004; Cˆot´e et al. 2007).
Recently, Capetti & Balmaverde published a series of three papers (Capetti & Balmaverde 2005 & 2006 and Balmaverde & Capetti 2006) in which they investigate the core/power-law dichotomy, based on the Nuker law, in two radio-selected samples of galaxies that are likely to host an AGN, requiring a minimum radio flux of ∼ 1 mJy. Us-ing new Nuker fits to the data as well as fits from the literature, they showed that radio-loud AGNs (defined us-ing the ratio of 5 GHz to B-band luminosity densities) are hosted by core galaxies, while radio-quiet AGNs are hosted by power-law galaxies. Capetti & Balmaverde (2007) also showed that early-type galaxies hosting Seyfert nuclei show power-law type central brightness profiles. This correlation of AGN radio-loudness with brightness profile offers impor-tant clues to the origin of the radio-quiet/radio-loud di-chotomy in AGN, as well as the link between the central black hole and the host galaxy. For example, if the merger history governs whether a galaxy is core or power-law, we might speculate that core galaxies host rapidly spinning black holes resulting from a major merger, and that radio-loudness is linked to spin. Alternatively, the different stel-lar density profiles in core and power-law galaxies may be linked to different environments which may enhance or in-hibit jet production, e.g. lower or higher gas densities respec-tively, and/or different types of hot or cold accretion (e.g. Best et al. 2005). Regardless of its physical interpretation, the radio-loudness/brightness-profile connection may shed useful light on the connection between radio-loud AGN and giant elliptical hosts, since core type galaxies are almost all giant ellipticals.
The implications of the radio-loudness/brightness-profile connection in AGN make it worthy of further study. In particular, it is important to identify whether the link persists in an optically selected sample of AGN. This is be-cause the Capetti & Balmaverde sample was radio-selected, so that it is still possible that there exists a population of AGN which inhabit core galaxies but are sufficiently radio-quiet that they were not selected. Clearly it is technically very difficult to measure central brightness profiles for op-tically luminous AGN, but in any case the Capetti & Bal-maverde sample is dominated by AGN with relatively low optical luminosities, i.e. predominantly optically classified as Low Ionisation Nuclear Emission Regions (LINERs) or other Low Luminosity Active Galactic Nuclei (LLAGNs).
In order to search for such AGN in nearby galaxies, Ho et al. (1995) conducted an optical spectroscopic survey of the nuclei of bright, nearby galaxies in the Northern hemi-sphere, the so-called Palomar spectroscopic survey of nearby galaxies. Their survey included 197 galaxies that are con-firmed to contain an AGN, as measured by their emission line ratios. This gives us an optically selected sample of low-luminosity AGNs, in contrast to Capetti & Balmaverde’s radio-selected sample. In this paper, we use availableHST
images to analyse the brightness profiles of the Palomar sur-vey active galaxies, using the S´ersic/Core-S´ersic
classifica-tion scheme rather than the core/power-law classificaclassifica-tion obtained from the Nuker model. We then use these results to investigate how the radio properties of these AGNs are related to their S´ersic/Core-S´ersic classification, which al-lows us to show whether Capetti & Balmaverde’s results are reproduced in a relatively complete sample of optically-selected AGN using this alternative classification scheme.
2 SAMPLE AND DATA REDUCTION
2.1 The Palomar spectroscopic survey of nearby galaxy nuclei
To reliably detect the presence of a galaxy core it must be nearby so that a core could easily be resolved by the
HST. The Palomar spectroscopic survey of nearby galaxy nuclei (Ho et al. 1995) uses a flux-limited sample of 488 bright Northern galaxies, with BT 6 12.5 mag and
decli-nationsδ >0◦, and naturally satisfies our requirement for nearby galaxies. Spectroscopic observations of these galaxies show that they include 197 AGNs. Nagar et al. (2005) con-ducted a high resolution radio survey of all of these AGNs, which will enable us to compare their radio properties to their Core/S´ersic classification. For spiral galaxies it is the brightness profile of the bulge component that determines this classification, however late-type spiral galaxies have rel-atively small bulges compared to the disk component, which will make it more difficult to classify them. Therefore we take as our sample the 150 AGNs in Nagar et al. (2005) for which the host galaxy is of Hubble typeT 63.
Ho et al. (1997) list various parameters for the galax-ies in the Palomar sample, such as distances, Hubble types, AGN classification and bulge and total B-band ab-solute magnitudes, which we use in this paper. However, where galaxies have more recent distance estimates listed in Tonry et al. (2001) and Paturel et al. (2002), we have used these values, and updated the absolute magnitudes and lu-minosities accordingly. The [Oiii] and Hβnarrow line
lumi-nosities for the AGN were obtained using the combination of unreddened line ratio data and Hαfluxes in Table 2 of Ho et al. (1997). We dereddened these fluxes by applying the extinction curve of Cardelli, Clayton & Mathis (1989), assuming the Balmer decrement to be 3.1.
We also estimated black hole masses for the AGN in our subset of the Palomar sample using the central ve-locity dispersions measured by Ho et al. (2009). We con-verted velocity dispersion to black hole mass using the relation: log(MBH/M⊙) = 8.13 + 4.02 log(σ/200kms−1)
(Tremaine et al. 2002). For consistency this method was used for all of the galaxies, including those for which direct kinematic measurements were also available.
2.2 HST data reduction
HST images of the galaxies in our sample were obtained from the public archive. Previous studies (e.g. Rest et al. 2001) have demonstrated that many early-type galaxies con-tain dust structures that may affect the brightness profiles. It is especially important to deal with the effects of dust in the AGN sample we study here, since dust structures are al-most ubiquitous in LLAGN (Gonz´alez Delgado et al. 2008)
and are probably more common in LLAGN than in normal galaxies (Martini et al. 2003). Therefore to minimise the ef-fects of dust we preferred to use images taken in the near-infrared using NICMOS, with the F160W filter. However, for many of the galaxies in our sample NICMOS images were unavailable, so for these we used images taken in the optical using WFPC2 or ACS. Only broadband filters were used, and preference was given to filters at longer wavelengths — any shorter than F555W were rejected. Using different fil-ters might affect our results if the brightness profile depends on the wavelengths at which the galaxy is observed, however Ravindranath et al. (2001) showed that the classification of a galaxy as core or power-law, based on Nuker fits, is in-dependent of the wavelength that is used. We were able to obtain suitable images for 110 galaxies in our sample; the basic properties of these galaxies are presented in table 1. As described in Section 2.1 the data presented in this ta-ble were obtained from Ho et al. (1997), although data was only available for 107 of the 110 Palomar survey galaxies for which we were able to obtainHSTimages.
The images from WFPC2 and ACS were calibrated us-ing the standard On The Fly Reprocessus-ing (OTFR) sys-tem1,2, however the NICMOS images calibrated in this way
contained a “pedestal”, which is a time-variable bias that is different in each quadrant. It is believed that this is caused by small temperature changes, which are different in each quadrant because they use separate amplifiers. To correct for the pedestal the standard CalnicA software that is used in the NICMOS OTFR system3was applied using IRAF to
the raw images, omitting all of the steps after and including flat field correction. The task BIASEQ in IRAF was then used to equalise the different biases in the 4 quadrants. Fi-nally, CalnicA was again applied using all of the steps after and including flat field correction, and omitting the steps that had already been performed. The final images still con-tain a bias, but this is now constant over the whole image and so can be accounted for by including a constant back-ground level when fitting the profile model to the image. These NICMOS images also contain several bad pixels — some of these are cold pixels, which appear dark because they have an abnormally low sensitivity; and some of these are hot pixels, which appear bright because they have an abnormally high dark current. There are also regions, called grots, that appear dark because flecks of antireflective paint scraped off of the optical baffles have reduced their sensi-tivity. These pixels are identified in the data quality files and are masked in the following analysis. The NIC2 cam-era also has a coronographic hole for observing targets that are close to bright objects, but when it is not used it still appears in the image as a bright patch, caused by emission from warmer structures that are behind it. This hole moves over time, which results in 2 patches in the image due to us-ing reference files that were taken at a different time. These regions have been masked.
1 http://www.stsci.edu/instruments/wfpc2/Wfpc2 dhb/WFPC2 longdhbcover.html 2 http://www.stsci.edu/hst/acs/documents/handbooks/ DataHandbookv5/ACS longdhbcover.html 3 http://www.stsci.edu/hst/nicmos/documents/handbooks/ DataHandbookv7/
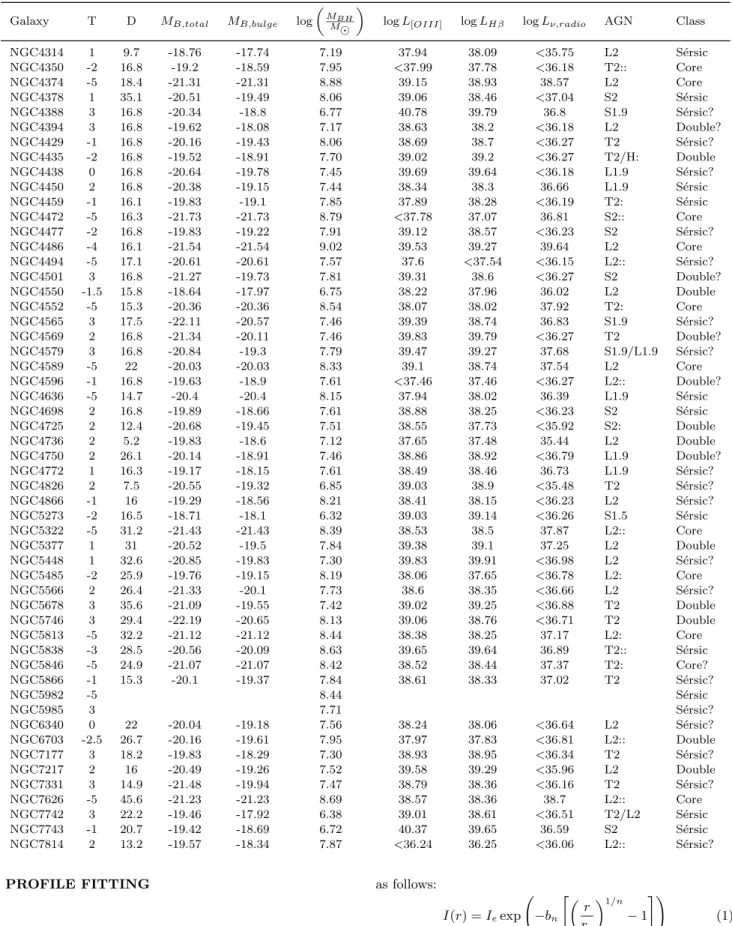
Table 1.Basic properties of the galaxies in our sample for whichHSTimages were obtained.
Galaxy T D MB,total MB,bulge log
MBH M⊙
logL[OIII] logLHβ logLν,radio AGN Class
IC0356 2 18.1 -21.12 -19.89 7.70 39.27 38.94 <36.29 T2 S´ersic? NGC0315 -4 65.8 -22.22 -22.22 8.86 39.44 39.61 40.09 L1.9 Core? NGC0404 -3 3.3 -16.65 -16.18 5.32 37.69 37.6 <34.92 L2 Double NGC0474 -2 32.5 -20.59 -19.98 7.78 38.7 38.34 <36.98 L2:: S´ersic NGC0488 3 29.3 -21.43 -19.89 8.03 38.69 38.74 <36.71 T2:: S´ersic NGC0524 -1 24 -20.73 -20 8.54 <37.55 37.87 36.71 T2: Core NGC0660 1 11.8 -18.92 -17.9 7.35 40.28 39.96 <35.88 T2/H: S´ersic? NGC2273 0.5 28.4 -20.25 -19.32 7.61 41.23 40.5 37.39 S2 S´ersic? NGC2681 0 17.2 -20.3 -19.44 7.07 39.23 39.49 <36.40 L1.9 S´ersic? NGC2683 3 7.7 -19.82 -18.28 7.38 37.72 37.27 <35.51 L2/S2 S´ersic? NGC2685 -1 16.2 -19.23 -18.5 6.81 39.23 38.77 <36.15 S2/T2: S´ersic NGC2768 -5 22.4 -21.05 -21.05 7.96 38.43 38.24 37.39 L2 Double? NGC2787 -1 7.5 -17.76 -17.03 8.15 37.74 38.02 36.37 L1.9 Double? NGC2832 -4 9.03 Core NGC2841 3 12 -20.82 -19.28 8.31 38.57 38.31 36.26 L2 Core NGC2859 -1 25.4 -20.38 -19.65 8.02 38.53 38.1 <36.59 T2: Double? NGC2985 2 22.4 -20.77 -19.54 7.52 37.85 38.07 <36.48 T1.9 S´ersic NGC3169 1 19.7 -20.51 -19.49 8.03 39.46 39.03 37.2 L2 Double NGC3190 1 22.4 -20.31 -19.29 8.02 38.67 38.35 36.38 L2 S´ersic? NGC3193 -5 34 -20.93 -20.93 8.08 38.46 38.06 <37.02 L2: Core NGC3227 1 16.5 -19.91 -18.89 7.46 40.3 40.41 36.88 S1.5 S´ersic NGC3245 -2 20.9 -19.95 -19.34 8.21 39.27 39.49 <36.42 T2: S´ersic NGC3368 2 10.4 -20.28 -19.05 7.35 38.85 38.63 <35.81 L2 S´ersic? NGC3379 -5 10.6 -19.94 -19.94 8.19 37.96 37.69 <35.83 L2/T2:: Core NGC3414 -2 25.2 -20.15 -19.54 8.42 39.14 38.8 36.96 L2 S´ersic NGC3489 -1 12.1 -19.26 -18.53 7.12 38.73 38.27 <35.94 T2/S2 S´ersic? NGC3507 3 19.8 -19.86 -18.32 6.65 39.09 39.11 <36.55 L2 S´ersic? NGC3516 -2 37.9 -20.75 -20.14 7.96 40.44 41 37.05 S1.2 S´ersic NGC3607 -2 22.8 -21 -20.39 8.39 39.48 39.16 36.64 L2 Core NGC3608 -5 22.9 -20.11 -20.11 8.06 38.24 37.77 <36.67 L2/S2: Core NGC3623 1 7.3 -19.67 -18.65 7.48 37.65 37.28 <35.46 L2: S´ersic? NGC3626 -1 20 -19.89 -19.16 7.58 39.19 39.15 <36.56 L2: S´ersic? NGC3627 3 9.1 -20.66 -19.12 7.30 39.37 38.95 36.16 T2/S2 S´ersic? NGC3628 3 7.7 -20.12 -18.58 6.47 37.04 36.82 35.89 T2 S´ersic? NGC3675 3 12.8 -20.02 -18.48 7.05 37.83 37.73 <35.99 T2 Double? NGC3705 2 17 -19.9 -18.67 7.18 38.71 38.7 <36.32 T2 Double? NGC3718 1 17 -19.96 -18.94 7.72 38.14 38.17 37.27 L1.9 S´ersic NGC3898 2 21.9 -20.38 -19.15 8.19 38.74 38.42 <36.46 T2 Core NGC3900 -1 29.4 -20.17 -19.44 7.50 37.83 37.62 <36.89 L2: S´ersic NGC3945 -1 22.5 -20.41 -19.68 8.05 38.53 38.19 36.8 L2 Double NGC3982 3 17 -19.47 -17.93 6.37 40.52 39.33 <36.24 S1.9 S´ersic NGC3998 -2 14.1 -19.26 -18.65 8.86 39.85 39.96 37.83 L1.9 Double NGC4013 3 17 -19.92 -18.38 6.67 37.18 37.33 <36.24 T2 S´ersic? NGC4111 -1 15 -19.28 -18.55 7.60 39.15 39.25 <36.24 L2 Double? NGC4125 -5 23.9 -21.22 -21.22 8.35 38.74 38.59 <36.53 T2 Double NGC4143 -2 15.9 -19.11 -18.5 8.17 38.47 38.73 36.7 L1.9 Double NGC4150 -2 13.7 -18.29 -17.68 6.68 37.94 38 <36.05 T2 S´ersic NGC4151 2 14.2 -20.05 -18.82 6.87 41.2 40.78 37.33 S1.5 S´ersic NGC4168 -5 16.8 -19.07 -19.07 7.98 37.69 37.91 36.72 S1.9: Core NGC4192 2 16.8 -21.11 -19.88 7.40 40.18 39.99 <36.34 T2 S´ersic NGC4203 -3 15.1 -19.29 -18.82 7.82 38.44 38.69 37.12 L1.9 S´ersic NGC4220 -1 17 -18.93 -18.2 7.01 39.28 38.9 <36.38 T2 Double? NGC4261 -5 31.6 -21.14 -21.14 8.89 39.6 39.23 39.31 L2 Core NGC4278 -5 16.1 -20.06 -20.06 8.59 39.26 39.35 38.14 L1.9 Core NGC4281 -1 35.1 -20.57 -19.84 8.52 <38.29 38.12 <36.87 T2:: S´ersic? NGC4293 0 17 -20.23 -19.37 7.12 39.4 39.21 36.38 L2 Double?
From left to right, columns show: Galaxy name; numerical Hubble type index; distance (Mpc); total B-band absolute magnitude of galaxy; bulge B-band absolute magnitude of galaxy; log black hole mass; log [Oiii] luminosity (erg s−1); log Hβluminosity
(erg s−1); log 15 GHz radio luminosity (erg s−1); AGN optical spectral classification (S:Seyfert, L:LINER, T:transition, numbers
denote type 1/2/intermediate, multiple classifications denote intermediate types, : and :: denote uncertain and highly uncertain classifications. See Ho et al. (1997) for details); nuclear surface brightness profile classification, based on S´ersic, Core-S´ersic and Double-S´ersic fits (see text). For brightness profile classifications with a question mark, the fits were uncertain.
Table 1–continuedBasic properties of the galaxies in our sample for whichHSTimages were obtained.
Galaxy T D MB,total MB,bulge log
MBH M⊙
logL[OIII] logLHβ logLν,radio AGN Class
NGC4314 1 9.7 -18.76 -17.74 7.19 37.94 38.09 <35.75 L2 S´ersic NGC4350 -2 16.8 -19.2 -18.59 7.95 <37.99 37.78 <36.18 T2:: Core NGC4374 -5 18.4 -21.31 -21.31 8.88 39.15 38.93 38.57 L2 Core NGC4378 1 35.1 -20.51 -19.49 8.06 39.06 38.46 <37.04 S2 S´ersic NGC4388 3 16.8 -20.34 -18.8 6.77 40.78 39.79 36.8 S1.9 S´ersic? NGC4394 3 16.8 -19.62 -18.08 7.17 38.63 38.2 <36.18 L2 Double? NGC4429 -1 16.8 -20.16 -19.43 8.06 38.69 38.7 <36.27 T2 S´ersic? NGC4435 -2 16.8 -19.52 -18.91 7.70 39.02 39.2 <36.27 T2/H: Double NGC4438 0 16.8 -20.64 -19.78 7.45 39.69 39.64 <36.18 L1.9 S´ersic? NGC4450 2 16.8 -20.38 -19.15 7.44 38.34 38.3 36.66 L1.9 S´ersic NGC4459 -1 16.1 -19.83 -19.1 7.85 37.89 38.28 <36.19 T2: S´ersic NGC4472 -5 16.3 -21.73 -21.73 8.79 <37.78 37.07 36.81 S2:: Core NGC4477 -2 16.8 -19.83 -19.22 7.91 39.12 38.57 <36.23 S2 S´ersic? NGC4486 -4 16.1 -21.54 -21.54 9.02 39.53 39.27 39.64 L2 Core NGC4494 -5 17.1 -20.61 -20.61 7.57 37.6 <37.54 <36.15 L2:: S´ersic? NGC4501 3 16.8 -21.27 -19.73 7.81 39.31 38.6 <36.27 S2 Double? NGC4550 -1.5 15.8 -18.64 -17.97 6.75 38.22 37.96 36.02 L2 Double NGC4552 -5 15.3 -20.36 -20.36 8.54 38.07 38.02 37.92 T2: Core NGC4565 3 17.5 -22.11 -20.57 7.46 39.39 38.74 36.83 S1.9 S´ersic? NGC4569 2 16.8 -21.34 -20.11 7.46 39.83 39.79 <36.27 T2 Double? NGC4579 3 16.8 -20.84 -19.3 7.79 39.47 39.27 37.68 S1.9/L1.9 S´ersic? NGC4589 -5 22 -20.03 -20.03 8.33 39.1 38.74 37.54 L2 Core NGC4596 -1 16.8 -19.63 -18.9 7.61 <37.46 37.46 <36.27 L2:: Double? NGC4636 -5 14.7 -20.4 -20.4 8.15 37.94 38.02 36.39 L1.9 S´ersic NGC4698 2 16.8 -19.89 -18.66 7.61 38.88 38.25 <36.23 S2 S´ersic NGC4725 2 12.4 -20.68 -19.45 7.51 38.55 37.73 <35.92 S2: Double NGC4736 2 5.2 -19.83 -18.6 7.12 37.65 37.48 35.44 L2 Double NGC4750 2 26.1 -20.14 -18.91 7.46 38.86 38.92 <36.79 L1.9 Double? NGC4772 1 16.3 -19.17 -18.15 7.61 38.49 38.46 36.73 L1.9 S´ersic? NGC4826 2 7.5 -20.55 -19.32 6.85 39.03 38.9 <35.48 T2 S´ersic? NGC4866 -1 16 -19.29 -18.56 8.21 38.41 38.15 <36.23 L2 S´ersic? NGC5273 -2 16.5 -18.71 -18.1 6.32 39.03 39.14 <36.26 S1.5 S´ersic NGC5322 -5 31.2 -21.43 -21.43 8.39 38.53 38.5 37.87 L2:: Core NGC5377 1 31 -20.52 -19.5 7.84 39.38 39.1 37.25 L2 Double NGC5448 1 32.6 -20.85 -19.83 7.30 39.83 39.91 <36.98 L2 S´ersic? NGC5485 -2 25.9 -19.76 -19.15 8.19 38.06 37.65 <36.78 L2: Core NGC5566 2 26.4 -21.33 -20.1 7.73 38.6 38.35 <36.66 L2 S´ersic? NGC5678 3 35.6 -21.09 -19.55 7.42 39.02 39.25 <36.88 T2 Double NGC5746 3 29.4 -22.19 -20.65 8.13 39.06 38.76 <36.71 T2 Double NGC5813 -5 32.2 -21.12 -21.12 8.44 38.38 38.25 37.17 L2: Core NGC5838 -3 28.5 -20.56 -20.09 8.63 39.65 39.64 36.89 T2:: S´ersic NGC5846 -5 24.9 -21.07 -21.07 8.42 38.52 38.44 37.37 T2: Core? NGC5866 -1 15.3 -20.1 -19.37 7.84 38.61 38.33 37.02 T2 S´ersic? NGC5982 -5 8.44 S´ersic NGC5985 3 7.71 S´ersic? NGC6340 0 22 -20.04 -19.18 7.56 38.24 38.06 <36.64 L2 S´ersic? NGC6703 -2.5 26.7 -20.16 -19.61 7.95 37.97 37.83 <36.81 L2:: Double NGC7177 3 18.2 -19.83 -18.29 7.30 38.93 38.95 <36.34 T2 S´ersic? NGC7217 2 16 -20.49 -19.26 7.52 39.58 39.29 <35.96 L2 Double NGC7331 3 14.9 -21.48 -19.94 7.47 38.79 38.36 <36.16 T2 S´ersic? NGC7626 -5 45.6 -21.23 -21.23 8.69 38.57 38.36 38.7 L2:: Core NGC7742 3 22.2 -19.46 -17.92 6.38 39.01 38.61 <36.51 T2/L2 S´ersic NGC7743 -1 20.7 -19.42 -18.69 6.72 40.37 39.65 36.59 S2 S´ersic NGC7814 2 13.2 -19.57 -18.34 7.87 <36.24 36.25 <36.06 L2:: S´ersic? 3 PROFILE FITTING 3.1 Galaxy Models
We fitted the brightness profiles of all galaxies in our sample with two models. The S´ersic (1968) model is parameterised
as follows: I(r) =Ieexp −bn " r re 1/n −1 #! (1) This model is described by three parameters: the effective radius re, the intensity at the effective radius Ie, and the
profile. For 16n610, the quantitybncan be approximated
by bn ≈1.9992n−0.3271 (Caon et al. 1993). We also use
the Core-S´ersic model introduced by Graham et al. (2003), which combines a S´ersic profile at large radii with a power law near the centre:
I(r) =I′hI+rb r αiγ/α exp " −bn rα+rbα rα e 1/αn# (2) This model uses six parameters, including the S´ersic index
n and effective radius re of the outer S´ersic profile. The
inner power law profile has a logarithmic slopeγ, and the break radiusrbis the radius separating the inner power law
and outer S´ersic profiles. The parameter α determines the sharpness of the transition between the two profiles, with a high value ofαindicating a sharp transition. The intensityI′ is related to the intensity at the break radius,Ib, as follows:
I′=Ib2−γ/αexp " bn 21/αrb re 1/n# (3) The quantitybnis calculated as in the S´ersic model.
As noted in section 2.1 we excluded late type spiral galaxies from our sample as their brightness profiles are dominated by the disc, however there are still several early type spiral galaxies in our sample. It is possible that there is still a significant contribution from the disc component in the central surface brightness profiles of these galaxies, so for all of the spiral and lenticular galaxies in our sample we also added an exponential disc component to the model.
The profiles of several galaxies in our sample showed an unresolved nuclear source due to the AGN. For these galaxies a central point source was added to the S´ersic and Core-S´ersic models.
Cˆot´e et al. (2007) demonstrate that low and intermedi-ate luminosity early-type galaxies often contain a resolved nuclear source, for example a compact spheroidal or flat-tened stellar component. They model the brightness profiles of these galaxies using a Double-S´ersic model:
I(r) =Ie,1exp −bn1 " r re,1 1/n1 −1 #! +Ie,2exp −bn2 " r re,2 1/n2 −1 #! (4) The inner S´ersic model (parameterised byIe,1,re,1 andn1)
describes the resolved nuclear component while the outer S´ersic profile (parameterised byIe,2,re,2 andn2) describes
the host galaxy. The brightness profiles of several galaxies in our sample showed a central excess above a single S´ersic profile that was too extended to be described by a point source, so these galaxies were also fitted with this Double S´ersic model.
Using the fits with the S´ersic and Core-S´ersic laws, we classified a galaxy as ‘Core’ if it satisfied the following cri-teria (based on those used by Trujillo et al. 2004):
(i) The Core-S´ersic fit must give a lower reducedχ2than the S´ersic fit. We note that Trujillo et al. (2004) required that the reducedχ2 of the Core-S´ersic fit must be at least a factor of 2 less than that of the S´ersic fit, however we found that very few galaxies in our sample satisfied such a strict criterion. This discrepancy is likely due to differences in how the data points are weighted in the fits, as they use
equal weights whereas we weight the data points using their Poissonian errors, which are larger at smaller radii.
(ii) To ensure that the core is well sampled by the data the break radiusrb must be greater than the radius of the
second data point.
(iii) The slope of the inner power law profile,γ, must be less than the logarithmic slope of the best-fit S´ersic model within the break radius.
Galaxies for which the Double-S´ersic model gave the lowest reducedχ2 were classified as ‘Double’ galaxies (i.e. contain a resolved nuclear source). All other galaxies were classified as ‘S´ersic’ galaxies.
3.2 Extracting 1D Profiles
The 1D semi-major axis brightness profiles of each galaxy were extracted using the ELLIPSE task in IRAF, which fits elliptical isophotes to the galaxy images. Regions of dust that were visible in the images were masked from these fits. The position angle and ellipticity were free to vary with each isophote, enabling radial variations in these quantities, such as isophotal twists, to be accounted for.
3.3 Fitting Procedure
The S´ersic, Core-S´ersic and (where necessary) Double-S´ersic models were fitted to the 1D brightness profiles by minimis-ing theχ2 statistic using theSherpa4 modelling and fitting
software package, which is a part of theChandraInteractive Analysis of Observations (CIAO5) software. The data points
were weighted in these fits using their Poissonian errors. To accurately reproduce the brightness profile at small radii it is necessary to account for the point spread function (psf) of the instrument used. For each image we created a 2D model of the psf at the position of the galaxy’s centre on the detector using the Tiny Tim software6. It was necessary to create a separate psf model for each image because the psf depends on the position on the detector. The ELLIPSE task in IRAF was used to extract the 1D profile of the psf, then the galaxy model was convolved with this psf inSherpa
before fitting to the observed brightness profile.
In the Core-S´ersic model the parameters α, n and γ
tend to be degenerate. Trujillo et al. (2004) recommend that
αshould be fixed at a large value to force an abrupt transi-tion between the outer S´ersic and inner power-law profiles, however we found that in several galaxies the profile was poorly fitted by such a fixed-αmodel, but it was well fitted if α was free to vary. Therefore we fixed α at α = 50 to obtain an initial fit and then we allowedαto vary freely to obtain the final fit. We investigated how robust the parame-ters were for the free-αfits and we found that the parameters of the outer S´ersic component were uncertain in some of the galaxies, particularly those with a low value ofα. This may also be caused by the limited radial extent of the fitting regions, which were comparable to the effective radius re
in some galaxies. However, the uncertainties inγ were rela-tively small, and the break radiirbof the Core-S´ersic models
4 http://cxc.harvard.edu/sherpa/ 5 http://cxc.harvard.edu/ciao/
were well within the fitting region, so the classifications as Core or S´ersic were robust.
3.4 Results
We were able to obtain fits for all 110 galaxies in our sample, however we are only confident in 62 of these fits, which are reported in table 2. 44 of the remaining galaxies showed large regions of dust that made the fits uncertain, even after we had masked most of this dust. The profiles of the remaining 4 galaxies could not be well described by a S´ersic, Core-S´ersic or Double-Core-S´ersic model. We report these fits in table 3, however they will be discarded for most of the following analysis. We present examples of confident fits using the S´ersic, Core-S´ersic and Double-S´ersic models in fig. 1 and two uncertain fits in fig. 2, showing for each the galaxy image and the radial profiles of the galaxy and the best fitting model.
We included an exponential disc component in the mod-els for the spiral and lenticular galaxies in our sample, how-ever in many cases this component was negligible. We there-fore only include the disc component parameters in tables 2 and 3 for the galaxies where it is significant.
To enable us to compare our results with previous stud-ies such as Capetti & Balmaverde (2005), which used the Nuker classification scheme, we also fitted the Nuker model to all galaxies in our sample. If we assume that ‘intermedi-ate’ as well as ‘core’ galaxies from the Nuker scheme cor-respond to ‘Core-S´ersic’ galaxies and ‘Double-S´ersic’ and ‘S´ersic’ galaxies both correspond to ‘power-law’ galaxies in the Nuker scheme then the Nuker classifications of the galax-ies in our sample agree with those that we present in table 2 for 82% of the galaxies for which we have a confident fit. This suggests that while the classification of many galaxies in our sample remain unchanged when we use the Nuker model, there are still some discrepancies between the two classification schemes.
4 DISCUSSION
Of the 62 galaxies for which we are confident in the bright-ness profile fits, we have 21 Core galaxies, 26 S´ersic galax-ies and 15 Double-S´ersic galaxgalax-ies. We only have both lu-minosity data and a confident classification for 60 of the 197 galaxies in the Palomar sample that are confirmed as AGN hosts, so we need to verify that we have not intro-duced any observational biases, for example if bright galax-ies are more likely to be imaged withHSTthen there would be a disproportionately large number of them in our final sample. In fig. 3 we compare the distributions of the Hub-ble type, bulge B band magnitude, nuclear radio luminos-ity and [Oiii] line luminosity for the 60 galaxies in our fi-nal sample, the 107 galaxies for which we have a confident or uncertain fit and luminosity data, and the 197 galax-ies hosting AGN in the Palomar sample, that were stud-ied in Nagar et al. (2005) (the Nagar sample). We used the ASURV Rev 1.2 software (LaValley, Isobe & Feigelson 1992) to test the significance of correlations and differences be-tween distributions for censored data, which includes non-detections with limits. This software implements the meth-ods presented in Feigelson & Nelson (1985) for univariate
problems and Isobe, Feigelson & Nelson (1986) for bivariate problems.
According to the generalised Wilcoxon tests the distri-butions of Hubble type in our final sample and the Nagar sample are inconsistent with being drawn from the same dis-tribution at the 99.99 per cent confidence level. We can see in fig. 3, top left panel, that our final sample has a higher pro-portion of elliptical galaxies, which is to be expected because we discarded all late spirals, and a disproportionately high number of the fits for early spirals were uncertain because they are more likely to contain dust. Using the generalised Wilcoxon tests, we also find that the distributions of bulge magnitude in our final sample and the Nagar sample are only marginally inconsistent with being drawn from the same dis-tribution at the 90 per cent confidence level. There are a small number of galaxies in the Nagar sample with very dim bulges that we missed because we discarded late type spirals. Also, we were more likely to findHSTimages for brighter galaxies. Of the galaxies for which we did obtainHSTdata, a high proportion of those with intermediate bulge magni-tudes had uncertain Nuker fits, probably because these tend to correspond to later type galaxies which are more likely to be dusty. According to the generalised Wilcoxon tests the distributions of nuclear radio luminosities in our final sam-ple and the Nagar samsam-ple are also marginally inconsistent with being drawn from the same distribution at the 90 per cent confidence level. From fig. 3, bottom left panel, we can see that there is a higher proportion of the small number of AGNs with higher radio luminosities in our final sample. Finally, using the generalised Wilcoxon tests we find that the distributions of [Oiii] line luminosities in our final
sam-ple and the Nagar samsam-ple are consistent with being drawn from the same distribution, although we can see in fig. 3, bottom right panel, that the galaxies with the lowest [Oiii]
line luminosities do not appear in our final sample. 4.1 Double-S´ersic Galaxies
We find 15 galaxies that are best fit by a Double-S´ersic model. Previous studies (e.g. Cˆot´e et al. 2007) attributed the inner S´ersic component in such models to a resolved stellar nucleus, with a radius≈0.02re, wherere is the
ef-fective radius of the outer component. However, several of the Double-S´ersic galaxies in our sample have inner compo-nents with a much larger radius. This suggests that they might not be due to resolved stellar nuclei, for example some of them may instead be inner discs or nuclear bars (Erwin & Sparke 2002). We studied the isophotes of the galaxies and we did not find any with flattened isophotes towards the centre, which suggests that nuclear bars are unlikely. However, searching through the literature we find that inner discs have been discovered in some of the galax-ies in our sample, for example NGC 3945 (Moiseev et al. 2004) and NGC 7217 (Zasov & Sil’chenko 1997). We there-fore cannot be certain whether the Double-S´ersic galaxies in our sample contain resolved stellar nuclei, or if they instead contain other nuclear structures such as inner discs. 4.2 Black hole mass and bulge magnitude
Fig. 4, left panel, shows the distributions of central black hole mass for Core, S´ersic and Double-S´ersic galaxies. The
Figure 1.Galaxy images (top row) and radial brightness profiles (bottom row) for a confident S´ersic fit (NGC7742; left), Core fit (NGC 3379; centre) and Double S´ersic fit (NGC7217; right).
Figure 2.Galaxy images (top row) and radial brightness profiles (bottom row) for a fit that is uncertain due to dust (IC 356; left) and a fit that is uncertain because the galaxy has a complex profile (NGC 4111; right).
Table 2.Best fit parameters of the Core, S´ersic and Double S´ersic galaxies from the confident fits.
Core Galaxies
Galaxy Instrument Filter µ′a rbb γ n reb α mptc NGC524 NICMOS F160W 13.32 0.18 0.11 2.80 14.88 134.14 -NGC2832 NICMOS F160W 13.51 0.64 0.11 2.90 9.03 4.69 -NGC2841 NICMOS F160W 10.05 0.17 0.35 5.03 77.48 102.27 -NGC3193 WFPC2 F702W 5.39 0.26 0.19 9.36 302.17 1.54 -NGC3379 NICMOS F160W 10.89 1.19 0.06 2.90 6.93 1.3 -NGC3607 NICMOS F160W 13.38 0.22 0.00 1.93 7.63 1.00 -NGC3608 WFPC2 F814W 9.00 0.31 0.29 6.65 71.59 4.01 -NGC3898 NICMOS F160W 9.44 0.22 0.27 4.79 17.77 4.60 -NGC4168 WFPC2 F702W 14.63 0.49 0.00 3.67 41.84 1.30 23.05 NGC4261 NICMOS F160W 11.30 1.55 0.00 3.10 7.06 1.87 21.50 NGC4278 NICMOS F160W 9.26 0.81 0.13 5.38 48.56 3.22 22.90 NGC4350 NICMOS F160W 7.19 0.55 0.25 5.77 18.99 2.22 -NGC4374 NICMOS F160W 11.20 1.86 0.12 3.20 12.36 1.88 20.64 NGC4472 NICMOS F160W 10.86 1.76 0.00 4.35 52.52 2.11 24.33 NGC4486 WFPC2 F814W 10.89 6.68 0.27 5.32 117.19 3.38 16.90 NGC4552 NICMOS F160W 11.67 0.36 0.14 2.71 6.98 7.73 -NGC4589 NICMOS F160W 10.57 0.14 0.00 4.64 21.19 2.12 -NGC5322 ACS F814W 5.73 1.23 0.41 8.14 93.09 2.62 -NGC5485 ACS F814W 16.14 0.32 0.13 2.74 19.79 113.48 -NGC5813 WFPC2 F814W 6.06 0.74 0.16 8.86 215.30 3.88 -NGC7626 NICMOS F160W 9.26 0.47 0.30 5.39 19.73 2.79 -S´ersic Galaxies Galaxy Instrument Filter µa
e n reb µe,disc re,disc mcpt NGC474 NICMOS F160W 18.12 2.09 4.22 - - 20.37 NGC488 NICMOS F160W 20.26 3.53 22.83 - - 22.05 NGC2685 WFPC2 F814W 20.93 3.91 29.76 - - -NGC2985 NICMOS F160W 19.50 3.45 16.52 - - 20.77 NGC3227 NICMOS F160W 17.80 4.07 3.63 - - 17.89 NGC3245 NICMOS F160W 17.59 3.03 6.02 - - 19.52 NGC3414 WFPC2 F814W 22.38 5.95 48.81 - - -NGC3516 NICMOS F160W 16.64 1.43 2.24 - - 17.17 NGC3718 NICMOS F160W 15.95 1.50 1.04 18.05 4.78 19.21 NGC3900 NICMOS F160W 22.22 6.55 38.11 - - -NGC3982 NICMOS F160W 19.60 2.47 4.84 - - 20.17 NGC4150 NICMOS F160W 18.21 3.10 4.52 - - -NGC4151 NICMOS F160W 18.76 4.30 9.00 - - 15.13 NGC4192 NICMOS F160W 16.76 1.93 5.27 20.76 369.78 15.51 NGC4203 ACS F814W 21.49 4.30 22.92 - - 21.22 NGC4314 NICMOS F160W 22.90 5.41 154.78 - - -NGC4378 WFPC2 F606W 19.75 2.78 5.93 21.51 24.46 -NGC4450 WFPC2 F814W 25.61 8.01 502.69 - - -NGC4459 NICMOS F160W 18.12 3.56 8.62 - - -NGC4636 NICMOS F160W 17.87 1.20 7.21 - - -NGC4698 WFPC2 F814W 16.65 2.03 1.64 18.81 11.65 20.60 NGC5273 NICMOS F160W 17.85 1.66 2.08 - - 19.90 NGC5838 NICMOS F160W 20.50 5.21 37.30 - - -NGC5982 NICMOS F160W 17.86 2.03 5.54 - - -NGC7742 NICMOS F160W 19.94 4.64 9.55 - - -NGC7743 NICMOS F160W 20.17 6.34 9.66 - -
-a Corrected for extinction using values from Ho et al. (1997) and converted to the Johnson V band, assuming that the
galaxy has the spectrum of a K2 giant.
b Measured in arcsec.
c Point source magnitude, corrected for extinction using values from Ho et al. (1997) and converted to the Johnson V band,
Table 2–continuedBest fit parameters of the Core, S´ersic and Double S´ersic galaxies from the confident fits.
Double S´ersic Galaxies
Galaxy Instrument Filter µae1 n1 rbe1 µea2 n2 rbe2 µe,disc re,disc mcpt NGC404 NICMOS F160W 19.74 15.72 2.55 24.97 6.35 712.26 - - -NGC3169 NICMOS F160W 14.90 0.81 0.38 17.24 1.60 6.72 - - -NGC3945 WFPC2 F814W 17.12 1.57 1.10 18.67 1.04 9.33 - - 20.60 NGC3998 ACS F814W 17.11 3.04 0.35 19.66 2.90 9.75 - - -NGC4125 NICMOS F160W 16.55 1.04 0.84 18.46 2.32 17.56 - - -NGC4143 NICMOS F160W 18.24 0.48 3.25 17.69 2.51 5.59 - - 21.12 NGC4435 NICMOS F160W 16.12 0.59 0.39 16.94 1.64 5.52 - - 19.56 NGC4550 NICMOS F160W 16.96 0.16 1.92 19.12 3.56 5.10 - - -NGC4725 NICMOS F160W 15.20 1.06 0.13 18.70 2.83 14.10 - - -NGC4736 NICMOS F160W 16.14 0.56 8.25 17.98 3.54 19.42 - - -NGC5377 NICMOS F160W 15.06 0.95 0.26 16.91 0.63 2.81 20.41 440.82 -NGC5678 NICMOS F160W 15.68 0.16 0.02 23.47 6.07 133.73 22.11 367.00 -NGC5746 NICMOS F160W 17.44 0.16 1.41 17.56 2.09 6.74 19.06 623.32 20.61 NGC6703 WFPC2 F814W 20.57 0.82 10.87 21.95 6.22 25.78 - - -NGC7217 NICMOS F160W 16.52 0.93 0.79 19.60 2.64 20.05 20.51 167.78 -−5 0 5 10 0 10 20 N Hubble Type −15 −20 0 20 40 60 N MB, bulge 34 36 38 40 0 20 40 N Log Lν, rad 36 38 40 42 0 10 20 30 40 N Log L[OIII]
Figure 3.Histograms showing the distributions of Hubble type (top left), bulge B band magnitude (top right), nuclear radio luminosity (bottom left) and [Oiii] line luminosity (bottom right) in our final sample (dotted line), the galaxies for which we have a confident or
uncertain fit and luminosity data (dashed line) and the Nagar sample (solid line). The arrows denote numbers of galaxies in the histogram bins which are limits only.
Table 3.Best fit parameters of the Core, S´ersic and Double S´ersic galaxies from the uncertain fits.
Core Galaxies
Galaxy Instrument Filter µ′a rbb γ n rbe α mptc Uncertainty NGC315 WFPC2 F814W 12.51 0.89 0.00 5.06 100.29 3.27 21.27 Dusty NGC5846 WFPC2 F702W 11.23 1.24 0.00 6.54 419.02 4.40 - Dusty
S´ersic Galaxies Galaxy Instrument Filter µa
e n rbe µe,disc re,disc mcpt Uncertainty IC356 WFPC2 F814W 25.83 9.16 1491.05 21.32 2904.34 - Dusty NGC660 ACS F814W 19.25 0.23 8.98 - - - Dusty NGC2273 NICMOS F160W 16.17 0.74 1.82 19.55 15.45 18.76 Dusty NGC2681 NICMOS F160W 23.12 12.35 103.2 - - - Complex NGC2683 NICMOS F160W 22.79 6.17 184.16 19.43 369.32 - Dusty NGC3190 ACS F814W 18.85 1.97 9.54 - - - Dusty NGC3368 NICMOS F160W 17.89 2.42 14.26 - - 16.81 Dusty NGC3489 WFPC2 F814W 19.51 4.22 15.24 - - - Dusty NGC3507 WFPC2 F606W 21.01 4.8 7.95 21.75 43.06 - Dusty NGC3623 WFPC2 F814W 21.16 5.81 63.13 19.68 579.52 - Dusty NGC3626 NICMOS F160W 16.67 2.32 3.14 - - 17.87 Dusty NGC3627 NICMOS F160W 17.79 2.78 10.46 19.57 344.24 - Dusty NGC3628 NICMOS F160W 25.21 5.6 5850.16 - - - Dusty NGC4013 WFPC2 F814W 19.37 0.18 7.9 20.55 228.1 - Dusty NGC4281 WFPC2 F606W 25.97 8.71 509.97 - - - Dusty NGC4388 NICMOS F160W 24.09 7.79 121.02 - - - Dusty NGC4429 WFPC2 F606W 22.78 4.52 134.39 - - 17.43 Dusty NGC4438 WFPC2 F814W 18.58 3.42 12.99 - - - Dusty NGC4477 WFPC2 F606W 21.3 3.58 35.93 - - - Dusty NGC4494 WFPC2 F814W 33.22 17.85 46101.91 - - - Dusty NGC4565 NICMOS F160W 16 1.44 3.9 18.3 61.7 18.66 Dusty NGC4579 WFPC2 F791W 19.24 3.32 9.77 20.22 48.67 19.39 Dusty NGC4772 WFPC2 F606W 23.7 6.27 68.5 21.68 36.77 - Dusty NGC4826 NICMOS F160W 16.68 2.21 6.87 19.5 80.47 - Dusty NGC4866 ACS F814W 33.20 13.65 33227.88 - - - Dusty NGC5448 NICMOS F160W 17.36 1.49 2.56 20.71 130.06 - Dusty NGC5566 WFPC2 F606W 17.16 0.86 5.23 - - - Dusty NGC5866 NICMOS F160W 18.26 1.77 23.21 - - - Dusty NGC5985 NICMOS F160W 19.56 2.03 4.91 - - 22.46 Complex NGC6340 ACS F814W 20.28 3.44 5.07 22.14 27.77 - Dusty NGC7177 NICMOS F160W 18.16 1.89 5.97 - - - Dusty NGC7331 NICMOS F160W 22.96 8.09 344.32 18 21.64 - Dusty NGC7814 NICMOS F160W 17.82 1.91 13.16 - - - Dusty
Double S´ersic Galaxies Galaxy Instrument Filter µa
e1 n1 rbe1 µae2 n2 rbe2 µe,disc re,disc mcpt Uncertainty NGC2768 WFPC2 F814W 17.14 1.00 0.44 24.88 5.98 547.44 - - - Dusty NGC2787 WFPC2 F814W 16.74 1.54 0.58 19.78 2.20 20.34 - - - Dusty NGC2859 ACS F814W 20.00 0.16 0.31 20.20 2.32 9.46 - - - Complex NGC3675 NICMOS F160W 19.14 0.17 8.96 21.11 5.51 42.71 21.11 1141.66 - Dusty NGC3705 WFPC2 F814W 14.32 0.4 0.22 20.58 4.01 28.64 20.82 215.19 - Dusty NGC4111 NICMOS F160W 17.58 0.16 1.41 18.75 3.69 19.13 - - - Complex NGC4220 ACS F814W 20.60 2.25 5.57 20.29 0.14 46.12 - - - Dusty NGC4293 NICMOS F160W 16.4 0.43 0.82 29.77 8.65 25512.11 22.23 282.46 17.99 Dusty NGC4394 ACS F814W 19.83 0.16 1.02 21.45 3.81 9.06 22.03 24.62 - Dusty NGC4501 WFPC2 F606W 15.97 0.73 0.64 19.06 1.11 12.09 22.08 202.65 19.89 Dusty NGC4569 NICMOS F160W 15.15 3.72 0.72 15.86 0.59 2.36 18.95 22.24 18 Dusty NGC4596 WFPC2 F606W 15.54 0.89 0.07 22.45 4.22 66.19 - - - Dusty NGC4750 NICMOS F160W 14.46 0.16 0.07 17.6 1.36 2.39 20.36 157.09 - Dusty
a Corrected for extinction using values from Ho et al. (1997) and converted to the Johnson V band, assuming that the
galaxy has the spectrum of a K2 giant.
b Measured in arcsec.
c Point source magnitude, corrected for extinction using values from Ho et al. (1997) and converted to the Johnson V band,
0 2 4 N 0 2 4 N 6 7 8 9 0 2 4 N Log MBH/Msol 0 2 4 6 N 0 2 4 6 N −160 −18 −20 −22 2 4 6 N MB, bulge
Figure 4.Histograms showing the distributions of central black hole mass (left) and bulge B band magnitude (right) for Core galaxies (top), S´ersic galaxies (middle) and Double-S´ersic galaxies (bottom).
black hole masses of the Core galaxies are typically higher than those of the S´ersic or Double-S´ersic galaxies, for exam-ple the median of logMBH/M⊙is 8.39 for the Core galaxies, compared to 7.57 and 7.84 for the S´ersic and Double-S´ersic galaxies respectively. We also find that the most massive black holes are almost exclusively found in Core galaxies — with the exception of one Double-S´ersic galaxy, NGC 3998, all SMBHs with logMBH/M⊙&8.5 are found in Core galax-ies. Conversely, all SMBHs with logMBH/M⊙ . 7.6 are found in S´ersic or Double-S´ersic galaxies. This is consistent with previous studies (e.g. Capetti & Balmaverde 2006).
Fig. 4, right panel, shows the distributions of bulge B band magnitude for Core, S´ersic and Double-S´ersic galaxies. The bulges of Core galaxies are generally brighter than those of S´ersic or Double-S´ersic galaxies, although they overlap significantly — for all Core galaxies MB,bulge.−18.6, and
for all S´ersic galaxiesMB,bulge&−20.4. Most Double-S´ersic
galaxies are within the same range as the S´ersic galaxies, although there are two examples that are more luminous and one that is much less luminous. Capetti & Balmaverde (2005) found a similar trend in K band magnitudes, although they also found core galaxies covering a much broader range of magnitudes. It is also worth noting that, with the ex-ception of one Double-S´ersic galaxy, NGC 4125, all galaxies with bulge B magnitudes below -21 are Core galaxies.
We note that the most massive black holes being found in Core galaxies is to be expected as they are at the more luminous end of the luminosity function (e.g. Ferrarese et al. 2006b, and also confirmed for our sample by Figure 4, right panel), so they also tend to have larger velocity dispersions (Faber & Jackson 1976) and hence black hole masses, which we derived from the velocity dispersions.
4.3 Radio-Loudness
The radio-loudness of an AGN is typically measured as the ratio of the radio to optical luminosity of the nucleus, how-ever we were only able to extract a point source in 23 of the galaxies for which we are confident in the Core/S´ersic fits, so this would limit the number of nuclei for which we can measure the radio-loudness. Furthermore this could bias any
0 2 4 6 8 N 0 2 4 6 8 N 0 2 4 6 8 N 0 2 4 6 8 0 2 4 6 8 0 2 4 6 8 −4 −3 −2 −1 0 0 2 4 6 8
Log Lν, rad/L[OIII]
Figure 5.Histograms showing the distribution ofLν,rad/L[OIII]
for Core galaxies (top), S´ersic galaxies (middle) and Double-S´ersic galaxies (bottom). The arrows denote numbers of galaxies in the histogram bins which are limits only.
correlations that we observe because we would be preferen-tially selecting bright, type 1 nuclei that are unobscured by nuclear dust. We therefore use the narrow [Oiii] line
lumi-nosity instead of the total optical lumilumi-nosity of the nucleus, because we have this data for most of the galaxies in our sample, and since [Oiii] line emission originates from the
narrow line region, there should not be a bias between type 1 and type 2 nuclei.
In Fig. 5 we show the distribution of the radio-loudness
Lν,radio/L[OIII]for Core, S´ersic and Double-S´ersic galaxies.
According to the generalised Wilcoxon tests the distribu-tions of radio-loudness in Core and S´ersic galaxies are in-consistent with being drawn from the same distribution at the 99.9 per cent confidence level, while the distributions of radio-loudness in S´ersic and Double-S´ersic galaxies are con-sistent with being drawn from the same distribution. This confirms that the radio-loudness of an AGN is related to whether its host galaxy is classified as a Core galaxy. We can see in fig. 5 that the most radio-loud AGNs are hosted
in Core galaxies, however AGNs with log(Lν,radio/L[OIII]).
−0.8 can be found in both Core and S´ersic galaxies. This large overlap has not been observed in previous studies, for example Capetti & Balmaverde (2006) found that almost all core galaxies were more radio-loud than the power-law galaxies (classified using the Nuker scheme), with very little overlap. Their sample was restricted to early-type galaxies whereas our sample also included early spiral galaxies, how-ever excluding the spirals in our sample did not recover the obvious split that they observed. The optical nuclear lumi-nosities reported in Capetti & Balmaverde (2006) are higher for power-law galaxies than for core galaxies, however the lowest [Oiii] line luminosities of power-law galaxies are as
low as those of core galaxies, although they do extend to higher [Oiii] line luminosities than core galaxies. This
sug-gests that the discrepancy between the correlation that we observe and that observed by Capetti & Balmaverde (2006) is due to the different definitions used for the radio-loudness. To test this possibility we looked at the galaxies for which we were able to extract a point source in the profile fitting and we used this point source to determine the ratio of nuclear radio luminosity to nuclear optical continuum luminosity,
Lν,radio/Lo. For these galaxies we then compared the
dis-tributions of bothLν,radio/LoandLν,radio/L[OIII]for Core,
S´ersic and Double-S´ersic galaxies; these results are presented in Fig. 6. According to the generalised Wilcoxon tests the distributions of Lν,radio/Lo in Core and S´ersic galaxies are
inconsistent with being drawn from the same distribution at the 99.99 per cent confidence level, while the distributions ofLν,radio/L[OIII]are inconsistent at the 99.9 per cent level.
Furthermore, we can see from Fig. 6 that there is no overlap between the Core and S´ersic subsamples when we use the nu-clear optical continuum luminosity. This demonstrates that the split between Core and S´ersic galaxies is clearer when we useLν,radio/Lo.
We also looked at using the narrow Hβ line luminos-ity instead of [Oiii]. Fig. 7 shows that using this definition for the radio-loudness produces the same difference between Core and S´ersic galaxy radio-loudness distributions that was observed when [Oiii] was used.
4.4 Correlations of radio-loudness with black hole mass and bulge magnitude
We saw in § 4.2 that the distributions of both the black hole mass and the bulge B band magnitude are different for Core and S´ersic galaxies, so this could lead to the observed trends of radio-loudness with the Core/S´ersic classification if radio-loudness is dependent on one of these properties. To test this possibility we plot radio-loudness against the black hole mass and the bulge B band magnitude; these plots are presented in Fig. 8.
Using Spearman’s rho to test the correlation between radio-loudness and black hole mass, we find that there is a correlation at the 99.99 per cent confidence level, with galaxies hosting high mass black holes generally being more radio-loud. Similar correlations have been demonstrated by previous studies of AGN, for example radio-loud quasars are found to contain systematically more massive black holes than radio-quiet quasars (Laor 2000; McLure & Jarvis 2004), and Doi et al. (2006) found a best-fit plane in the three dimensional space of radio-loudness, black hole mass
0 2 4 6 N 0 2 4 6 N 0 2 4 6 0 2 4 6 0 2 4 6 −4 −3 −2 −1 0 0 2 4 6 N Log Lν, rad/LHβ
Figure 7.Histograms showing the distribution ofLν,rad/LHβfor Core (top), S´ersic (middle) and Double-S´ersic (bottom) galaxies. The arrows denote numbers of galaxies in the histogram bins which are limits only.
and Eddington ratio for a sample of 48 LLAGN taken from the Palomar spectroscopic survey. In fig. 8, left panel, we can see that there is still considerable scatter between these variables, which suggests that other factors may be involved. We also used Spearman’s rho to test the correlation be-tween radio-loudness and bulge B band magnitude, and we found that there is a correlation at the 99 per cent con-fidence level, with luminous galaxies generally being more radio loud. However, fig. 8, right panel shows that there is also scatter between these two variables, which again sug-gests that there may be other factors involved.
It is possible that the scatter in the correlations of radio-loudness with bulge magnitude and black hole mass can be explained by the Core/S´ersic/Double-S´ersic classification. To test correlations with this classification we parameterised the galaxies using the central deficit or excess in the surface brightness profile compared to the inward extrapolation of the outer S´ersic component, using the ∆0.02 parameter
in-troduced by Cˆot´e et al. (2007). This parameter is defined as ∆0.02= logLG/LS, whereLG is the total luminosity of the best fit galaxy model within a radius of 0.02re and LS is the total luminosity of the outer S´ersic component in this region. Core galaxies have ∆0.02 < 0, S´ersic galaxies have
∆0.02 = 0 and Double-S´ersic galaxies have ∆0.02 > 0. We
then tested the partial correlations for both black hole mass and bulge magnitude with radio loudness and ∆0.02, using
the cens tau code 7, which uses the methods presented in Akritas & Siebert (1996) to search for partial correlations in censored data. These partial correlations test whether there are residual correlations between radio-loudness and ∆0.02
after the overall correlations have been accounted for. Zero partial correlation between the bulge magnitude, radio-loudness and ∆0.02is rejected at the 99 per cent
con-fidence level, and zero partial correlation between the black hole mass, radio-loudness and ∆0.02 is rejected at the 99.99
per cent confidence level. These results suggest that there is a significant residual correlation between the radio-loudness
0 1 2 3 4 N 0 1 2 3 4 N 0 1 2 3 4 0 1 2 3 4 −5 −4 −3 −2 −1 0 0 1 2 3 4 N Log Lν, rad/Lo 0 1 2 3 N 0 1 2 3 N 0 1 2 3 0 1 2 3 0 1 2 3 −4 −3 −2 −1 0 0 1 2 3 N
Log Lν, rad/L[OIII]
Figure 6. Histograms comparing the distributions ofLν,radio/Lo (left panel) andLν,radio/L[OIII] (right panel) for the Core (top),
S´ersic (middle) and Double-S´ersic (bottom) galaxies for which we were able to extract a point source. The arrows denote numbers of galaxies in the histogram bins which are limits only.
6 7 8 9 −4 −3 −2 −1 0 Log L ν , rad /L [OIII] Log MBH/Msol −18 −20 −4 −3 −2 −1 0 Log L ν , rad /L [OIII] MB, bulge
Figure 8.Radio-loudnessLν,rad/L[OIII]plotted against black hole mass (left panel) and against bulge B band magnitude (right panel).
Core galaxies are represented by filled squares, S´ersic galaxies by empty circles and Double-S´ersic galaxies by empty triangles.
of an AGN and the classification of its host galaxy as Core, S´ersic or Double-S´ersic, after the effects of bulge magni-tude and black hole mass have been accounted for. How-ever, Doi et al. (2006) demonstrated that the radio-loudness correlates with both the black hole mass and the accre-tion rate in a sample of 48 LLAGN, so we also need to consider whether ∆0.02 correlates with the accretion rate.
We used the ratio of [Oiii] line luminosity to Eddington
luminosity, log(L[OIII]/LEdd), as a proxy for the
accre-tion rate and tested the partial correlaaccre-tion of ∆0.02 with
log(L[OIII]/LEdd) and black hole mass, following the same
method as above. We found that ∆0.02 is partially
corre-lated with log(L[OIII]/LEdd) at the 99.99 per cent
confi-dence level. Therefore it is possible that the partial correla-tion between radio-loudness and ∆0.02 arises because Core
galaxies tend to have a higher central black hole mass and a lower accretion rate. This possibility needs further inves-tigation. The correlation between accretion rate and the classification of the host galaxy as Core, S´ersic or Double-S´ersic is illustrated in fig. 9, where we plot logLν,rad/L[OIII]
against logL[OIII]/LEdd for the Core, S´ersic and
Double-S´ersic galaxies.
5 CONCLUSIONS
In this paper we have studied the brightness profiles of el-liptical and early type spiral galaxies in the Palomar spec-troscopic survey that are confirmed as AGN hosts. We fit-ted S´ersic, Core-S´ersic and, where necessary, Double-S´ersic models, plus a point source where needed, to the 1D semi-major axis brightness profiles extracted from high resolution
HSTimages of these galaxies. By comparing these fits we were able to classify the galaxies as Core, S´ersic or Double-S´ersic galaxies, and then we investigated how other proper-ties of the host galaxy and the AGN relate to this classifi-cation.
We found that Core galaxies were generally more lu-minous and hosted higher mass black holes than S´ersic and Double-S´ersic galaxies, although there was considerable
−9 −8 −7 −6 −5 −4 −4 −3 −2 −1 0 Log L ν , rad /L [OIII]
Log L[OIII]/LEdd
Figure 9. Radio-loudness Lν,rad/L[OIII] plotted against the
[Oiii] line luminosity as a fraction of the Eddington luminosity,
L[OIII]/LEdd, for Core galaxies (filled squares), S´ersic galaxies
(empty circles) and Double-S´ersic galaxies (empty triangles).
overlap between these subsamples. These results agree with previous studies (e.g. Capetti & Balmaverde 2006, who used the Nuker classification scheme).
To measure the radio-loudness of the AGNs we took the ratio of nuclear radio luminosity to [Oiii] line luminosity,
be-cause we could only estimate the optical continuum luminos-ity of the AGN for approximately one third of the galaxies, for which we could extract a point source in the profile fit-ting. Furthermore, using the [Oiii] line luminosity prevents bias against faint nuclei that are more difficult to extract. Using this definition of the radio-loudness we found that Core galaxies were generally more radio-loud than S´ersic and Double-S´ersic galaxies, in agreement with the results of Capetti & Balmaverde (2006) for a radio-selected sam-ple of AGN based on the Nuker scheme. However, we found significantly more overlap between these subsamples com-pared to Capetti & Balmaverde (2006). This difference is most likely because we use a different definition of the radio loudness, as we find that there is much less overlap when we use the nuclear optical continuum luminosity. Therefore we conclude that the radio-loudness/brightness-profile connec-tion uncovered for radio-selected AGN also applies to our optically-selected sample.
We also looked at how the radio-loudness, defined us-ing the [Oiii] line luminosity, correlated with the black hole
mass and bulge B band magnitude of the host galaxies. We found that, while the radio -loudness does show correlations with both black hole mass and bulge magnitude, which could explain at least some of the correlation between brightness-profile and radio-loudness, we still found a significant partial correlation with the classification of the host galaxy bright-ness profile as Core or S´ersic. However, the host galaxy clas-sification is also correlated with the accretion rate, so it is possible that the observed connection between brightness-profile and radio-loudness arises because Core galaxies tend to have a higher black hole mass and a lower accretion rate. This possibility requires further investigation.
ACKNOWLEDGMENTS
AJR acknowledges the support of a Nuffield Foundation Undergraduate Research Bursary. PU is supported by an STFC Advanced Fellowship, and funding from the European Community’s Seventh Framework Programme (FP7/2007-2013) under grant agreement number ITN 215212 Black Hole Universe. This work is based on observations made with the NASA/ESA Hubble Space Telescope, and ob-tained from the Hubble Legacy Archive, which is a col-laboration between the Space Telescope Science Institute (STScI/NASA), the Space Telescope European Coordinat-ing Facility (ST-ECF/ESA) and the Canadian Astronomy Data Centre (CADC/NRC/CSA). We also thank the ref-eree, Laura Ferrarese, for useful comments that have im-proved this paper.
REFERENCES
Akritas, M. G., & Siebert, J. 1996, MNRAS, 278, 919 Balmaverde, B., & Capetti, A., A&A, 447, 97
Best, P. N., Kauffmann, G., Heckman, T. M., Brinchmann, J., Charlot, S., Ivezic, Z., White, S. D. M., 2005, MNRAS, 362, 25
Caon, N., Capaccioli, M., & D’Onofrio, M. 1993, MNRAS, 265, 1013
Capetti, A., & Balmaverde, B., 2005, A&A, 440, 73 Capetti, A., & Balmaverde, B. 2006, A&A, 453, 27 Capetti, A., & Balmaverde, B. 2007, A&A, 469, 75 Cardelli, J. A., Clayton, G. C., Mathis, J. S., 1989, ApJ,
345, 245
Cˆot´e et al., 2007, ApJ, 671, 1456 Crane, P., et al. 1993, AJ, 106, 1371
Doi, A., Kameno, S., & Inoue, M., 2006, J. Phys.: Conf. Ser. 54 335
Erwin, P., & Sparke, L. S. 2002, AJ, 124, 65 Faber, S. M., & Jackson, R. E. 1976, ApJ, 204, 668 Faber, S. M., et al. 1997, AJ, 114, 1771
Feigelson, E. D., & Nelson, P. I. 1985, ApJ, 293, 192 Ferrarese, L., van den Bosch, F. C., Ford, H. C., Jaffe, W.,
& O’Connell, R. W. 1994, AJ, 108, 1598 Ferrarese, L., & Merritt, D. 2000, ApJ, 539, L9
Ferrarese, L., et al. 2006a, in Proc. IAU Symp. 238, Black Holes: from Stars to Galaxies — Across the Range of Masses, ed. V. Karad & G. Matt (Cambridge: Cambridge Univ. Press), in press (astro-ph/0612139)
Ferrarese, L., et al. 2006b, ApJS, 164, 334
Forbes, D. A., Franx, M., & Illingworth, G. D. 1995, AJ, 109, 1988
Gebhardt, K. et al. 2000, ApJ, 539, L13
Gonz´alez Delgado, R. M., P´erez, E., Cid Fernandes, R., & Schmitt, H., 2008, AJ, 135, 747
Graham, A. W., Erwin, P., Trujillo, I., & Asensio Ramos, A. 2003, AJ, 125, 2951
Graham, A. W. 2004, ApJ, 613, L33
Ho, L. C., Filippenko, A. V., & Sargent, W. L. W. 1995, ApJS, 98, 477
Ho, L. C., Filippenko, A. V., & Sargent, W. L. W. 1997, ApJS, 112, 315
Ho, L. C., Greene, J. E., Filippenko, A. V., & Sargent, W. L. W. 2009, ApJS, 183, 1
Isobe, T., Feigelson, E. D., & Nelson, P.I. 1986, ApJ, 306, 490
Jaffe, W., Ford, H. C., O’Connell, R. W., van den Bosch, F. C., & Ferrarese, L. 1994, AJ, 108, 1567
King, I. R. 1966, AJ, 71, 64 Kormendy, J. 1985, ApJ, 292, L9 Laor, A., 2000, ApJ, 543, L111 Lauer, T. R. 1985, ApJ, 292, 104 Lauer, T. R., et al. 1995, AJ, 110, 2622
LaValley, M., Isobe, T., & Feigelson, E. D. 1992, BAAS, 24, 839
Martini, P., Regan, M. W., Mulchaey, J. S., & Pogge, R. W., 2003, ApJ, 589, 774
McLure, R. J., & Jarvis, M. J., 2004, MNRAS, 353, L45 Moiseev, A. V., Vald´ev, J. R., & Chavushyan, V. H. 2004,
A&A, 421, 433
Nagar, N. M., Falcke, H., & Wilson, A. S. 2005, A&A, 435, 521
Paturel, G., Teerikorpi, P., Theureau, G., Fouqu´e, P., Musella, I., Terry, J. N., 2002, A&A, 389, 19
Ravindranath, S., Ho, L. C., Peng, C. Y., Filippenko, A. V., & Sargent, W. L. W. 2001, AJ, 122, 653
Rest, A., van den Bosch, F. C., Jaffe, W., Tran, H., Tsve-tanov, Z., Ford, H. C., Davies, J., & Schafer, J. 2001, AJ, 121, 2431
S´ersic, J. L. 1968, Atlas de Galaxias Australes (C´ordoba: Obs. Astron., Univ. Nac. C´ordova)
Tonry, J. L., et al.., 2001, ApJ, 546, 681 Tremaine, S., et al., 2002, ApJ, 574, 740
Trujillo, I., Erwin, P., Asensio Ramos, A., & Graham, A. W. AJ, 127, 1917
van der Marel, R. P. 1999, Galaxy Dynamics, ASP Con-ference Series, 182, ed. Merritt, D., Sellwood, J. A., & Valluri, M.


![Figure 8. Radio-loudness L ν,rad /L [OIII] plotted against black hole mass (left panel) and against bulge B band magnitude (right panel).](https://thumb-us.123doks.com/thumbv2/123dok_us/1073228.2642824/15.918.116.802.498.750/figure-radio-loudness-oiii-plotted-black-panel-magnitude.webp)
![Figure 9. Radio-loudness L ν,rad /L [OIII] plotted against the [Oiii] line luminosity as a fraction of the Eddington luminosity, L [OIII] /L Edd , for Core galaxies (filled squares), S´ ersic galaxies (empty circles) and Double-S´ ersic galaxies (empty tri](https://thumb-us.123doks.com/thumbv2/123dok_us/1073228.2642824/16.918.98.423.141.396/loudness-luminosity-fraction-eddington-luminosity-galaxies-galaxies-galaxies.webp)
