Finance and growth: Evidence from South Asia
Item type Article
Authors Patra, Sudip; Ghosh Dastidar, Sayantan
Citation Ghosh Dastidar, S. and Patra, S. (2018) 'Finance and growth: Evidence from South Asia', Jindal Journal of Business Research, DOI: 10.1177/2278682118761747
DOI 10.1177/2278682118761747
Publisher Sage
Journal Jindal Journal of Business Research
Rights Archived with thanks to Jindal Journal of Business Research
Downloaded 29-Apr-2018 19:11:33
Item License http://creativecommons.org/licenses/by-nc-nd/4.0/
Finance and Growth: Evidence from South Asia
Sudip Patra1O. P. Jindal Global University, India Sayantan Ghosh Dastidar2
University of Derby, UK
Abstract: The paper examines the empirical relationship between financial development and economic
growth for five South Asian countries over the time period 1990-2015 using both panel model approach and time series analysis. We employ multiple proxies for financial development, namely, foreign direct investment, total debt service, gross domestic savings, domestic credit to private sector by banks and domestic credit provided by financial sector to test the relationship. The panel model results indicate that there is an overall positive association between finance and growth for South Asia through the FDI and savings channels. The country-specific analyses suggest that the growth effects of financial channels are most pronounced in Sri Lanka whereas, on the other hand, financial development plays no role in the Indian growth process in the short run. Bangladesh, Nepal and Pakistan lie somewhere in between this spectrum with every country exhibiting unique growth paths which highlights the heterogeneity of the region.
Keywords: Finance, Growth, South Asia, Granger causality, panel investigation
JEL classifications: G10; O10; O11; O43; O47; O57
1O. P. Jindal Global University, Haryana, India. E-mail: spatra@jgu.edu.in
2Corresponding Author. Kedleston Road, Derby DE22 1GB, United Kingdom. Tel: +44 01332 593474.
Email: s.dastidar@derby.ac.uk. Orchid No: 0000-0002-3174-9335 The usual disclaimer applies.
1.
Introduction
The theory of finance led growth is well established in the growth and development literature. The main proposition of the theory is that financial intermediation through efficient markets or banking system can improve the allocation of resources in an economy, especially the capital allocation for productive projects, which, in turn, promotes production and faster economic growth (Estrada, et al., 2010). However, financial development is a multi-dimensional concept and there are multiple channels through which it can influence growth. It is quite possible that, as our findings predict, a specific channel such as FDI or Gross domestic savings (% of GDP) is operative in one country but not in the other. Consequently, the nature of the finance-growth relationship may differ from country to country. This heterogeneity of channels of finance led growth has been relatively less studied for South Asia.
Most of the existing evidence on the finance-growth nexus has been generated from the developed economies, where the financial markets and banking systems are already on a relatively higher development stage (Levine, 2005). On the other hand, for the developing countries, the causality between growth and financial development may not be so pronounced because of underdeveloped financial markets. Consequently, there has been relatively less research done for developing countries, especially for the South Asian economies, on this issue (see Section 2.2.1 for details).
To the best of our knowledge, there exists only one study (Rana and Barua, 2015) which attempts to explore the relationship for South Asia. Moreover, there exists no previous study which tries to highlight the heterogeneity in South Asia, as far as the finance-growth association is concerned. From a policy perspective, conducting the latter research is important because there are a few limitations of cross-country and panel studies. Panel model estimates mask vital cross-country differences and at best show an average relationship for the sample of countries and thus, often do not correspond to country-specific estimates (Levine and Zervos, 1996 and Luintel and Khan, 2004). Pesaran and Smith (1995) also point out the heterogeneity of coefficients across countries. Moreover, as Levine (2003) says, it is difficult to establish the direction of causality between different financial variables and growth through panel analysis. Hence, it can be argued that generalisations based on panel estimates may provide incorrect inferences for most countries of the panel which, in turn, may impair the policy relevance of such results.
Given this backdrop, the current paper utilises both panel model as well as time series approaches as the latter may provide deeper insight on the issue since all these economies (Bangladesh, India, Nepal, Pakistan and Sri Lanka) are on different growth levels and trajectories. The current paper makes two specific contributions: Firstly, it extends the thin literature on the average relationship between finance and economic growth in the context of South Asia, by examining the same over the time period 1990-2015 using a panel model approach; secondly, this is one of the earliest investigations of country specific finance led growth paths for South Asian countries by employing Granger causality approach. The findings
of the paper suggest that the region is quite heterogeneous, and one size fit all policy does not hold good for the member nations.
The rest of the paper is structured as follows: Section 2 reviews the relevant literature in this area, Section 3 is dedicated to model formulation and variable description, Section 4 presents the econometric results along with discussion and, finally, Section 5 concludes with policy recommendations.
2 Review of the Literature
2.1 Theoretical background
In this section, we will briefly review the specific channels which can lead to growth. There are two basic components of a financial system, one, the traditional financial intermediaries or the banking system, and two, the direct finance mode or the stock and bond markets. The more efficient a financial system is, the better is the allocation of resources which, in turn, increases return on investments, leading to faster capital accumulation and eventually rapid economic growth (Estrada et al., 2010).
Demirgüç-Kunt and Levine (2008) emphasise mainly on the reduction of the information and transaction costs via financial intermediation and say that the five core functions of a financial system are to:
i) Ex-ante information production for the investments and thus resulting in capital allocation; ii) Ex post monitoring of the investments to mitigate bad debts or moral hazard issues; iii) Diversification of funds hence managing risk;
iv) Mobilising and pooling saving; and
v) Reducing the transaction costs hence easing the exchange of goods and services.
Financial institutions reduce the cost of processing information and help in the allocation of funds towards most profitable investments. Without such institutions, it would have been costly for the investors to acquire information about firms, managers and market conditions. Thus, improvement of information leads to efficient allocation of funds towards the most productive firms thereby increasing the return on investments and accelerating the rate of economic growth (Greenwood and Jovanovic, 1990). An efficient financial system also affects growth positively through the technological advancement channel. For instance, financial intermediaries may promote innovation in an economy by channelising funds to those entrepreneurs who are most likely to engage in product or process innovation (Blackburn and Hung, 1998).
Demirgüç-Kunt and Levine (2008) argue that better monitoring by the banks may create a better corporate governance mechanism in the firms which may help in reducing the bad debt problem. Bencivenga and Smith (1993) also show that financial intermediaries that improve
corporate governance will reduce credit rationing and thereby lift productivity and economic growth.
Financial instruments, namely, derivatives, SWAPS, options and various combinations of them can in principle diversify risk, or hedge risk for investors and firms, thus promoting more trade. Pooling of funds and savings may also perform a critical role in the growth process. Financial systems that are more effective at pooling the savings of individuals can fund a larger number of large-scale investments which leads to better exploitation of economies of scale thereby affecting economic growth positively. An efficient mobilisation of savings can also lead to better allocation of resources and accelerate innovation.
Finally, there is a strong consensus in the growth literature that specialisation promotes learning-by-doing and boosts productivity and is therefore beneficial for economic development (see, for example, McKinnon, 1973; North, 1981). However, the higher the specialisation the higher will be the number of transactions which are costly. Financial markets that can lower these transaction costs will facilitate deeper specialisation thereby leading to faster growth.
2.2 Empirical Evidence
There exists a vast gamut of literature which examines the association between the two variables and also tries to identify the particular channels through which financial development leads to higher growth. Broadly speaking, the literature can be classified into the following strands: cross-country studies, time series, panel investigations and industry or firm level studies (Levine, 2005).
One of the earliest studies in this area was by Goldsmith (1969) who shows a positive correlation between financial development and the level of economic activity using data on 35 countries. The seminal paper of King and Levine (1993a) builds on Goldsmith’s work. Using data on 77 countries for the period 1960-1989, King and Levine observe a positive and significant relationship between financial development and long-run growth. King and Levine (1993b) examine the finance-growth nexus for 80 countries over the time period 1960-1989 and report that various measures of financial development are strongly associated with economic growth. Rajan and Zingales (1998) find that financial development reduces costs of external finances to firms and consequently industrial sectors develop faster in those countries which have more developed financial markets. Atje and Jovanovic (1993) report a positive relationship between stock market development and growth in economic activity. Levine and Zervos (1998) construct numerous measures of stock market development to assess the relationship between stock market development and growth in a sample of 42 countries over the period 1976–1993. They report that stock market development affects growth positively. Estrada et al. (2010) examine the relationship for a sample of 92 countries using total liquid liabilities, bank credit and stock market capitalisation as proxies for financial depth. The paper finds that financial development has a robust and positive impact on growth and furthermore, there is no evidence of significant differences between developing countries and industrialised countries in terms of the finance–growth nexus.
On the other hand, there exists a set of studies which report a lack of any significant relationship between finance and growth or even report a negative relationship. Utilising data on 85 countries for the period 1960-1990, Berthélemy and Varoudakis (1997) report a negative relationship between financial depth and growth. In contrast with Atje and Jovanovic (1993), Harris (1997) finds no hard evidence that the level of stock market activity helps to explain the growth in per capita output. Thus, it could probably be asserted that the overall empirical evidence on the finance-growth relationship, especially in the context of panel or cross-country studies, is inconclusive.
There are a few problems with cross-country and panel estimations. Firstly, such studies report an average relationship between financial development and growth and do not take the individual country characteristics into account. This approach is acceptable if the relationship does not vary significantly across countries (Demetriades and Andrianova, 2003). However, if the relationship is driven by one or two ‘outliers’ then such results would be inappropriate for non-outlier countries from a policy perspective. In other words, such studies will not be suitable for effective policy prescriptions. For instance, Zhu, Ash and Pollin (2002) show that the Levine-Zervos finding, that stock market liquidity affects GDP growth positively, is not robust to alternative specifications. Once the ‘East-Asian Tigers’ are excluded from the sample, the growth effect of stock market liquidity disappears. Secondly, it is hard to determine the directions of causality. Therein lies the importance of time series studies.
Demetriades and Hussein (1996), one of the earlier time series studies in this field, examine the finance-growth relationship for 16 countries for the period 1960-1990. The study reports that the direction of causality varies considerably across countries. While there is bi-directional causality in seven countries, there is also evidence of reverse causality in six cases (El Salvador, Greece, Pakistan, Portugal, South Africa and Turkey). Odedokun (1996) show that the growth-promoting effects of financial intermediation are more pronounced in low-income than in high-income less-developed countries. De Gregorio and Guidotti (1995) report a negative relationship between financial development and growth in 12 Latin American countries during the time period 1950-1985. Rioja and Valev (2004) show that the nature of the relationship between financial development and growth vary according to the level of the former. They suggest that there are three distinct regions of financial development. In the low region (countries with very low levels of financial development), improvements in financial markets have an ambiguous effect on growth. In the intermediate region, the effect is large and positive whereas in the high region the effect is positive but smaller.
2.2.1 Evidence from South Asia
There exist a few studies which attempt to examine the finance-growth link in the context of South Asian countries. Rana and Barua (2015) examine the finance-growth link for the five developing South Asian economies of Bangladesh, India, Nepal, Pakistan and Sri Lanka for the time period 1974-2012. Using, domestic credit provided by financial sector, total debt services, gross domestic savings, broad money and trade balance as proxies for financial
development, they find that growth of total debt services and domestic savings have a significant impact on economic development of these countries. Singh (2008) examines the relationship for India for the period 1951–52 to 1995–96 and reports a bi-directional causality between the two. Ray (2013) also reports a positive and significant effect of financial development on the economic growth of India. Applying Johansen cointegration and error correction modelling technique, Perera and Paudel (2009) conclude that there is not enough evidence to suggest that financial development affects economic growth positively in Sri Lanka. Khan et al. (2015) examine the empirical relationship between financial development and economic growth in Pakistan over the period 1971–2004 and find that economic growth is an outcome of the former.
From the above discussion, it can be inferred that there is very limited empirical work (both time series and panel studies) on the financial development-economic growth relationship in the context of the South Asian countries. To the best of our knowledge, there exists no study which has previously identified the nature of heterogeneity in the South Asian countries. This study, therefore, aims to extend the literature in this direction.
3. Model specification and Variable Description
In order to test the finance-growth relationship, we adopt the augmented Solow model proposed by Mankiw et al. (1992). The model can be expressed as follows:
GDPit = β0+ β1Tradeit + β2PCapitalit + β3HCapitalit + β4Labourit + eit (1) where, for country ‘i’ at time ‘t’,
‘GDP’ represents Gross Domestic Product (GDP) growth rate (constant 2010 US$), ‘Trade’ denotes trade openness which is calculated as (exports+imports as % of GDP), ‘Pcapital’ is a proxy for physical capital stock which is Gross fixed capital formation (% of GDP), ‘Hcapital’ is average years of schooling which acts a proxy for human capital stock, ‘Labour’ is the size of the labour force and e is the error term.
We augment Equation (1) with several proxies for financial development as well as a lagged dependent variable to control for any potential autocorrelation problem. The econometric model used in the panel model analysis looks as follows:
GDPit = β0+β1L.GDPit+β2Tradeit+β3PCapitalit+β4HCapitalit+β5Labourit+β6Financeit+eit (2) where, ‘L.GDP’ is the lagged dependent variable and ‘Finance’ denotes the 5 proxies for financial development used in this study namely:
i) Foreign direct investment, net inflows (% of GDP), ii) Total debt service (% of GNI),
iii) Gross domestic savings (% of GDP),
iv) Domestic credit to private sector by banks (% of GDP) and v) Domestic credit provided by financial sector (% of GDP)
All the variables in our model have been expressed in their natural logarithms. The sample includes the five South Asian countries of Bangladesh, Nepal, India, Pakistan and Sri Lanka. The time period under consideration is from 1990 till 2015. Earlier years could not be incorporated in the analysis because of data unavailability for some of the South Asian countries.
In addition to the aforementioned proxy variables, we re-estimated Equation (2) using ‘Branches of commercial banks per 1,000 km2’and ‘Outstanding loans with commercial banks (% of GDP)’ as alternative finance variables. However, data on these two variables were only available from 2004 onwards which is inappropriate for a times series analysis. Furthermore, these 2 variables did not seem to exert any significant influence on growth when we examined the finance-growth link using panel model approach. So, we dropped these two variables from the study.3 Data on all the variables in our model (except, that on Branches of commercial banks and Outstanding loans with commercial banks which come from IMF Financial Access Survey) have been obtained from the World Development Indicators (World Bank, 2016). The econometric analysis has been conducted at two levels. Firstly, we investigate for an average relationship between financial development and economic growth for entire South Asia by employing panel model approach. We start by estimating Equation (2) using a fixed effects model but we find the problem of autocorrelation in the estimates. Hence, we re-estimate using Feasible Generalised Squares (FGSL) method. FGLS method allows estimation in the presence of first-order autocorrelation within panels, heteroskedasticity or cross-sectional correlation across panels (Beck and Katz, 1995).
Secondly, we re-examine the finance-growth nexus (see Equations 3-8 below) for each country using Vector Autoregression (VAR) method and Granger Causality approach. The aim of doing the time series analysis is twofold: firstly, it allows us to highlight the heterogeneity in South Asia, as far as the finance-growth link is concerned and, secondly, it aids in determining the direction of causality between the two variables for each country. As discussed in Section 2, there are a few limitations of panel studies. If the nature of association between finance and growth varies across countries in the sample, running a panel regression will not highlight these differences. Consequently, such “general” results cannot be used to provide policy prescription for a particular country. In this respect, time-series analysis provides a much better insight (Chatterji et al., 2014).
The VAR system of equations, that we estimate, can be presented as follows:
GDPit = β0+β1Tradeit+β2PCapitalit+β3HCapitalit+β4Labourit+β5Financeit+e1it (3)
Tradeit= α0+ α1GDPit+ α2PCapitalit+ α3HCapitalit+ α4Labourit+ α5Financeit+e2it (4)
PCapitalit= µ0+ µ1GDPit+ µ2Tradeit+ µ3HCapitalit+ µ4Labourit+ µ5Financeit+e3it (5)
HCapitalit= Ω0+ Ω1GDPit+ Ω2Tradeit+ Ω3PCapitalit+ Ω4Labourit+ Ω5Financeit+e4it (6)
Labourit= π0+ π1GDPit+ π2Tradeit+ π3PCapitalit+ π4HCapitalit+ π5Financeit+e5it (7)
Financeit= σ0+ σ1GDPit+ σ2Tradeit+ σ3PCapitalit+ σ4HCapitalit+ σ5Labourit+e6it (8)
where, e1it to e6it are the error terms; number of lags=2
We estimate Equations 3-8 for each country and for each of the 5 financial variables which enter the VAR system separately. On the basis of the VAR estimations, we then calculate the short-run Granger causality between each financial variable and growth for all the countries in our sample.
4. Results and Discussion
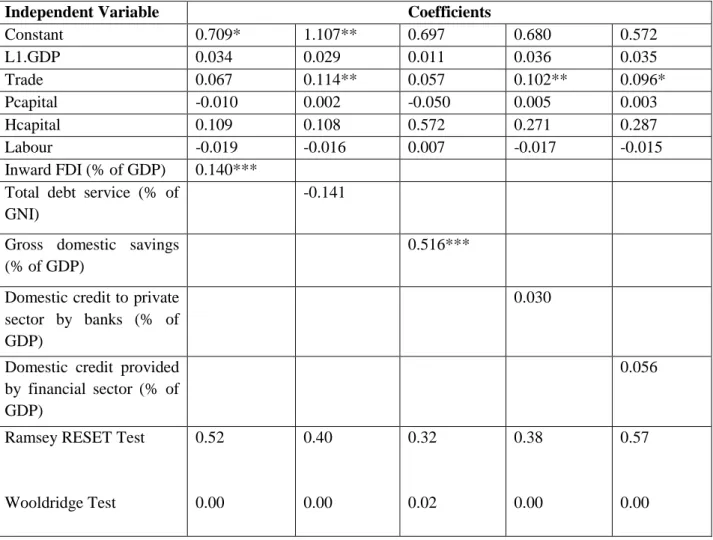
Table 1 provides results for the Fixed effect estimation results (see Equation 2) for the five economies in the South Asia.
Table 1: Panel Fixed Effects Model Results, 1990-2015
Independent Variable Coefficients
Constant 0.709* 1.107** 0.697 0.680 0.572 L1.GDP 0.034 0.029 0.011 0.036 0.035 Trade 0.067 0.114** 0.057 0.102** 0.096* Pcapital -0.010 0.002 -0.050 0.005 0.003 Hcapital 0.109 0.108 0.572 0.271 0.287 Labour -0.019 -0.016 0.007 -0.017 -0.015 Inward FDI (% of GDP) 0.140***
Total debt service (% of GNI)
-0.141
Gross domestic savings (% of GDP)
0.516***
Domestic credit to private sector by banks (% of GDP)
0.030
Domestic credit provided by financial sector (% of GDP)
0.056
Ramsey RESET Test
Wooldridge Test 0.52 0.00 0.40 0.00 0.32 0.02 0.38 0.00 0.57 0.00
Note: The dependent variable is GDP growth. *, **, *** denote statistical significance at 10%, 5% and 1% respectively. Heteroskedasticity-robust standard errors have been used. All regressions include time trend. The mean variance inflation factor (vif) values are considerably lower than 10 for each of the estimating equations which confirm the absence of any multicollinearity problem. The last row reports the P-values of the tests.
We find no significant impact of the lagged GDP on the current growth rate, though the signs of the regression coefficients are all positive, which means an insignificant positive impact on the current growth rate. There is a large literature which theorises trade as an important macroeconomic channel through which developing economies may develop on their growth paths. The obtained results lend some support to that literature since we find significant and positive impact of the trade variable on the growth rate of GDP in three of the models estimated. However, the effect is not very robust (see Table 2 also). In the case of human capital as another control, the impact is insignificant and positive for all the models, which further confirms that the growth path overall for the region may be more finance and trade led. Similarly, we do not find any significant growth effects of labour force size or physical capital formation.
The specific impacts of the financial development variables on the growth rate are as below: 1. The results indicate that FDI affects GDP growth positively in South Asia. Moreover,
the magnitude of the coefficient on FDI (0.140) is larger than that of coefficients of other potential growth determinants. This finding, that lends support to the FDI led growth theory, is expected since the South Asian economies have been increasingly adopting pro-economic liberalisation and private sector policy framework since the 1990s (see ADB, 2003; ADB, 2012 and Government of Bangladesh, 2014 Budget Document). However, there are significant regulatory and country-specific differences which get revealed in country-specific time series study, as shown later.
2. The impact of total debt service is insignificant and negative on the average which is in contrast to the finding of the other paper on these South Asian economies-Rana and Barua (2015). We argue that the lack of any growth effect of total debt service reflects the inefficiency in the financial sector of some of these economies, particularly India and Pakistan (see the time series results also). For instance, Indian banks’ Net NPA ratio (as a percentage of net advances) have continuously increased in recent years from 1.7% in 2012 to 8.5% in 2016 (Reserve Bank of India, 2016). On the other hand, nonperforming loans (as a percentage of total gross loans) have increased from 2.45% in 2008 to 7.6% in 2016 (World Bank, 2016). Such trends imply a lack of efficiency of financial intermediation, which may have offset the potential growth effects of the debt channel. Reddy (2002) cites legal impediments, time-consuming nature of asset disposal process and manipulation by debtors using political influence as the reasons behind such high levels of industrial bad debts in India.
A similar picture is observed in Pakistan too where over the last decade the percentage of nonperforming loans in total gross loans has mounted from 7.3% in 2006 to 11.1% in 2016 (World Bank, 2016). Historically, state-owned banks in these developing economies have channelled depositors’ money mainly to the favoured sectors, like agriculture sector, which has been less profitable and productive, thus adding to the problem of bad loans (Shaikh, 2003). Moral hazard issues like waiving of farmer loans before elections have also played a significant role in this regard since at times the loan waivers are granted primarily to rich farmers with political influence.
3. There is a strong positive impact of the gross domestic savings on the growth rate of the economies at an average. This finding suggests that these economies are domestic
investment driven at large since the banking sectors are largely devoted to allocating domestic savings into specific sectoral investments.
4. Though the impact of the domestic credit provided by the banks to the private sector is positive on the growth, the impact is insignificant, which may also reveal that the impediments for the private firms for accessing financial capital are still present and that the government largely drives the investments in these economies.
5. Similar insignificant positive impact is found for the domestic credit provided by the financial sector as a whole for the region, which is indicative of the fact that there is still a significant room for development for the financial sectors in these economies. The Wooldridge test indicated towards the presence of autocorrelation in the Fixed effects results. So, we re-estimated our model using the FGLS approach (see Table 2).
Table 2: FGLS Estimation Results, 1990-2015
Independent Variable Coefficients
Constant 0.586** 0.767*** -0.234 1.07** 0.250 L1.GDP 0.085 0.096 0.041 0.089 0.092 Trade 0.054 0.060 0.022 0.065 0.060 Pcapital 0.141*** 0.137*** 0.028 0.143*** 0.131*** Hcapital 0.109 0.201 0.122 0.184 0.206 Labour -0.022 -0.003 0.004 -0.002 0.001 Inward FDI (% of GDP) 0.117**
Total debt service (% of GNI)
-0.022
Gross domestic savings (% of GDP)
0.470***
Domestic credit to private sector by banks (% of GDP)
-0.110
Domestic credit provided by financial sector (% of GDP)
0.144
Note: The dependent variable is GDP growth. *, **, *** denote statistical significance at 10%, 5% and 1% respectively. All regressions include time trend.
Our findings regarding the relationship between different financial variables and economic growth remain unchanged. As mentioned earlier, the average association between trade and growth for South Asia is fragile and the effect of trade disappears in the new results indicating its sensitivity to the choice of estimation methods. We find that, besides finance, physical capital accumulation has a positive relationship with GDP growth rate. Next, we conduct country-specific time series analysis to understand the nature of the relationship between
different finance variables and growth for individual South Asian economies. Granger causality tests have been employed to understand the short-term causality between the growth and finance, along with the other macroeconomic control variables.
4.1 Bangladesh
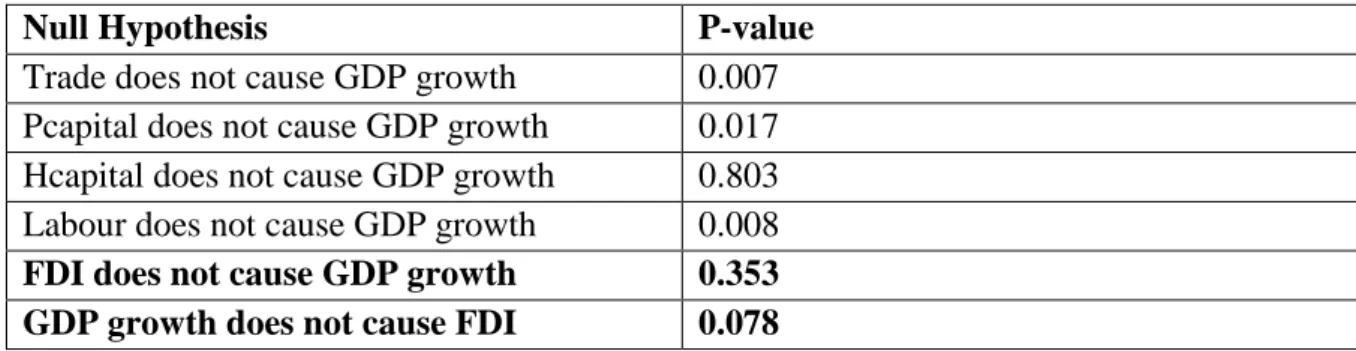
Tables 3-5 provides the Granger causality results for Bangladesh. We find that there is a causality running from the two financial channels namely, debt and savings towards GDP growth rate. There is no significant causality flowing from FDI to GDP growth. However, the reverse causality from GDP growth to FDI is very significant. The last finding supports the view that initial growth phase of any low-income country may be an important driving factor for further FDI flow into the economy.
The predictability of the other macro variables is in line with the standard economic theories, which specifically shows that GDP growth is caused by trade, labour force size and the physical capital level.
Table 3: Granger Causality Test Results for Bangladesh (FDI and Growth)
Null Hypothesis P-value
Trade does not cause GDP growth 0.007 Pcapital does not cause GDP growth 0.017 Hcapital does not cause GDP growth 0.803 Labour does not cause GDP growth 0.008 FDI does not cause GDP growth 0.353 GDP growth does not cause FDI 0.078
Table 4: Granger Causality Test Results for Bangladesh (Total Debt Services and Growth)
Null Hypothesis P-value
Trade does not cause GDP growth 0.117 Pcapital does not cause GDP growth 0.018 Hcapital does not cause GDP growth 0.562 Labour does not cause GDP growth 0.001 Debt does not cause GDP growth 0.075
The finding, that the Debt service level does predict the growth of GDP, can reflect the financial development of the economy, by suggesting that there is an allocation efficiency of the banking sector since the debt servicing also shows that the problem of bad debts is low. The finding
lends support to the finance-led growth theories since the causality implies faster growth via returns from investments.
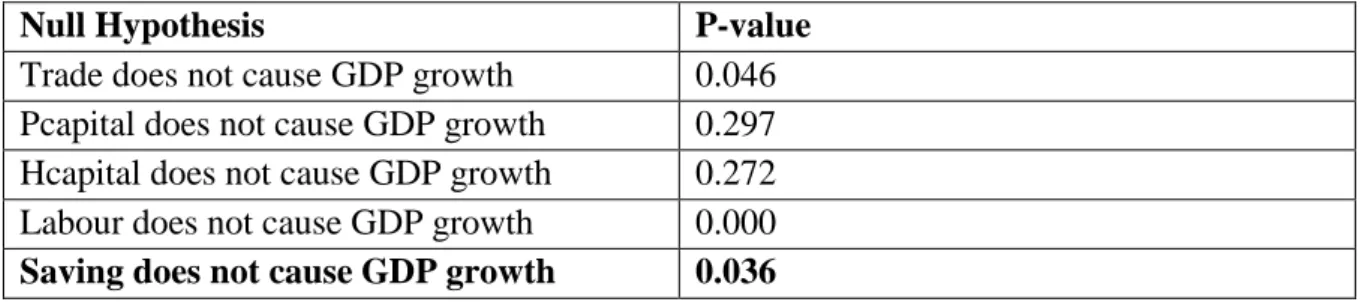
Table 5: Granger Causality Test Results for Bangladesh (Saving and Growth)
Null Hypothesis P-value
Trade does not cause GDP growth 0.046 Pcapital does not cause GDP growth 0.297 Hcapital does not cause GDP growth 0.272 Labour does not cause GDP growth 0.000 Saving does not cause GDP growth 0.036
The Table 5 results suggest that domestic savings have generated growth in the economy for the time period under consideration. This variable is a typical financial development variable for the developing economies since their growth trajectory is still in the beginning phase and is led by the efficient saving accumulation by the banking sector or financial sector at large. Overall, it can be asserted that the case of Bangladesh supports finance-growth nexus and it is interesting to identify a savings and debt led channel for growth which may be different from other economies at a similar stage of growth.
Other finance variables such as Domestic credit provided by financial sector (% of GDP) and Domestic credit to private sector by banks (% of GDP) do not granger cause GDP growth as these variables came out to be insignificant with P-values 0.510 and 0.251 respectively. Since credit is a size measure so the lack of any effect of the credit variables may imply that the country needs to increase access to industrial credit for its firms as the current provisions are clearly not sufficient.
4.2 India
Table 6: Granger Causality Test Results for India (FDI and Growth)
Null Hypothesis P-value
Trade does not cause GDP growth 0.009 Pcapital does not cause GDP growth 0.158 Hcapital does not cause GDP growth 0.926 Labour does not cause GDP growth 0.345 FDI does not cause GDP growth 0.609 GDP growth does not cause FDI 0.022
Table 7: Granger Causality Test Results for India (Other Finance Variables and Growth)
Null Hypothesis P-value
Debt does not cause GDP growth 0.353
Domestic credit provided by financial sector does not cause GDP growth
0.257 Domestic credit to private sector by banks 0.701
Saving does not cause GDP growth 0.986
Tables 6 and 7 provides Granger causality results for India. Contrary to past studies (Singh, 2008; Ray 2013), we find that financial development is not playing any role in the growth process of India, at least not in short run. If anything, there is a reverse causality from FDI towards growth implying that initial growth rates may motivate the overseas investors to invest in the country.
The rate of credit formation has been increasing persistently in India. However, at the same time, there is a rising value of bad loans or non-performing assets in India as discussed before. As can also be seen in Table 8 below, on one hand, domestic credit provided by financial sector and that provided to private sector increased rapidly but on the other hand, total debt service deteriorated between 1990 and 2010 (from 2.39% to 1.49% of GDP) indicating a rise in non-performing loans.
Table 8: Selected Financial Indicators for India Year Total debt service (%
of GNI)
Domestic credit to private sector by banks (% of GDP) Domestic credit provided by financial sector (% of GDP) 1990 2.39 24.49 49.97 2000 2.26 27.85 51.18 2010 1.49 51.14 71.94 2015 2.34 52.23 76.75
Source: World Bank (2016)
Hence, it can be argued that the efficiency of resource allocation is more important rather than the volume from the point of view of economic growth. In India, the problem of crony capitalism may have been partly responsible for this situation by which financial resources get diverted to unproductive investments thereby reducing their growth potential (see Mazumdar, 2008 also).
Trade seems to be the main driver of growth which is expected since India started to undertake major trade reforms since 1991 and rapidly opened up its economy for world trade. Applied Tariff rates fell from 56.4% in 1992 to 10.1% in 2013 (World Bank, 2016). In all the estimating equations, we failed to reject the null that Trade does not Granger cause GDP growth. We
obtained P-values 0.018, 0.042, 0.038 and 0.040 for VAR estimations with credit, private credit , saving and debt respectively. Other variables such as physical capital, Human capital and Labour always came out to be statistically insignificant.
4.3 Nepal
Table 9: Granger Causality Test Results for Nepal (FDI and Growth)
Null Hypothesis P-value
Trade does not cause GDP growth 0.010 Pcapital does not cause GDP growth 0.001 Hcapital does not cause GDP growth 0.021 Labour does not cause GDP growth 0.418 FDI does not cause GDP growth 0.003 GDP growth does not cause FDI 0.000
There is a very significant bi-directional causality between FDI and growth, which gets support from the earlier studies on Nepal such as UNCTAD (2003) which says that the FDI inflows have been successful in job creation. Furthermore, FDI seems to be the most important financial development variable for Nepal which indicates that the economy is driven by a handful of sectors such as apparel manufacturing and tourism which depend on the FDI inflow. Table 10: Granger Causality Test Results for Nepal (Other Finance Variables and Growth)
Null Hypothesis P-value
Debt does not cause GDP growth 0.032
Domestic credit provided by financial sector does not cause GDP growth
0.832 Domestic credit to private sector by banks 0.301
Saving does not cause GDP growth 0.132
Table 10 reports the results for the other variables in case of Nepal, one variable which is significant is the Debt servicing level. As found earlier in the case of Bangladesh, this finding reflects that there is some level of allocation efficiency of the banking or the financial system, which also means less severity of the bad debt problem like that in the case of India or Pakistan. Among the other explanatory variables, trade and physical capital have significant predictive power for the future GDP growth. The former finding can be attributed to Nepal’s liberal trade policies. For instance, the country reduced the unweighted average rate of import tariff drastically from 111% in 1989 to 16% by 1992; and the number of tariff slabs fell from more than 100 in the 1980s to only 5 in 1996 (RIS, 2002). The human capital effect is fragile; the variable comes out as insignificant in all other cases and marginally significant at 10% level (results available upon request) when we use ‘Domestic credit to private sector by banks’ as the finance proxy in the VAR estimation. That is not surprising given Nepal’s niche sectors are
tourism and agricultural products which are typically labour-intensive sectors (UNCTAD, 2003).
4.4 Pakistan
Table 11: Granger Causality Test Results for Pakistan (FDI and Growth)
Null Hypothesis P-value
Trade does not cause GDP growth 0.437 Pcapital does not cause GDP growth 0.273 Hcapital does not cause GDP growth 0.000 Labour does not cause GDP growth 0.000 FDI does not cause GDP growth 0.291 GDP growth does not cause FDI 0.014
Table 12: Granger Causality Test Results for Pakistan (Other Finance Variables and Growth)
Null Hypothesis P-value
Debt does not cause GDP growth 0.417
Domestic credit provided by financial sector does not cause GDP growth
0.381 Domestic credit to private sector by banks does not cause GDP
growth
0.931 GDP growth does not cause Domestic credit to private sector by
banks
0.053
Saving does not cause GDP growth 0.083
GDP growth does not cause Saving 0.043
Table 11 provides results for Granger causality between the FDI and growth variable for Pakistan, along with the other macro variables. Only the savings channel seem to be causing growth in Pakistan though the effect of the savings channel is very marginal. There is significant problem of crony capitalism in Pakistan as well (Shaikh, 2003) which renders some of the other channels like the ‘total debt service’ and credit channels ineffective. Like in the earlier cases of India and Bangladesh, we find a significant reverse causality between FDI and growth.
Human capital and labour are very significant variables for causing GDP growth. The latter finding reflects characteristics of economies in the beginning phase of growth trajectories.
4.5 Sri Lanka
Table 13: Granger Causality Test Results for Sri Lanka (All Finance Variables and Growth)
Null Hypothesis P-value
FDI does not cause GDP growth 0.012
Debt does not cause GDP growth 0.001
Domestic credit provided by financial sector does not cause GDP growth
0.002 Domestic credit to private sector by banks 0.001
Saving does not cause GDP growth 0.081
Table 14: Granger Causality Test Results for Sri Lanka (Other Variables and Growth)
Null Hypothesis P-value
Finance Variable=FDI
Trade does not cause GDP growth 0.318
Pcapital does not cause GDP growth 0.007
Hcapital does not cause GDP growth 0.075
Labour does not cause GDP growth 0.033
Finance Variable=Debt
Trade does not cause GDP growth 0.064
Pcapital does not cause GDP growth 0.083
Hcapital does not cause GDP growth 0.112
Labour does not cause GDP growth 0.278
Finance Variable= Domestic credit provided by financial sector
Trade does not cause GDP growth 0.719
Pcapital does not cause GDP growth 0.927
Hcapital does not cause GDP growth 0.125
Labour does not cause GDP growth 0.796
Finance Variable=Saving
Trade does not cause GDP growth 0.069
Pcapital does not cause GDP growth 0.556
Hcapital does not cause GDP growth 0.736
Labour does not cause GDP growth 0.627
Finance Variable= Domestic credit to private sector by banks
Trade does not cause GDP growth 0.503
Pcapital does not cause GDP growth 0.562
Hcapital does not cause GDP growth 0.004
Among all the South Asian economies, the finance-led growth path seems to be most prominent in Sri Lanka. All the financial development variables are found to be significant predictors of the future GDP growth (Table 13). Thus, it can be argued that Sri Lanka is the classic finance led growth case in South Asia where the financial intermediation theory gets very good support. Furthermore, financial development seems to be the robust determinant of growth as the effects of all the other explanatory variables seem to be fragile and sensitive to model specifications. Table 15 summarises the findings of Granger causality analysis below.
Table 15: Different financial channels and growth in South Asia
Channels Bangladesh India Nepal Pakistan Sri Lanka
FDI X X √ X √
Debt √ X √ X √
Domestic credit provided by financial sector
X X X X √
Domestic credit to private sector by banks
X X X X √
Gross domestic savings √ X X √ √
Note: ‘X’ denotes the absence of granger causality from financial variable towards growth and ‘√’ denotes the presence of the same.
Consequently, we ask the following question: Why is the finance-led growth so pronounced in the case of Sri Lanka, as compared to other South Asian countries? In other words, is it a size effect or an efficiency effect?
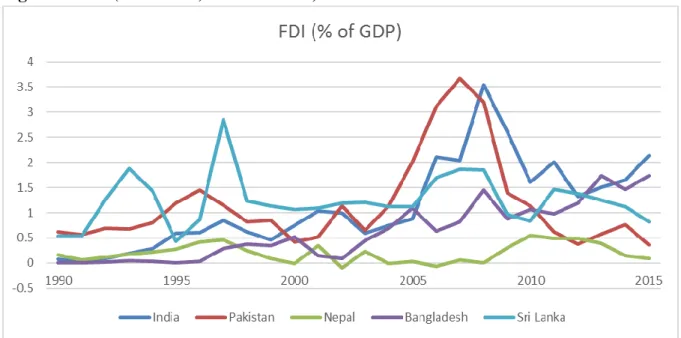
Figures 1-5 present the five financial variables (FDI, Debt, Domestic credit provided by financial sector, Domestic credit to private sector by banks and Gross domestic savings) for the five economies.
Figure 1: FDI (% of GDP) in South Asia, 1990-2015
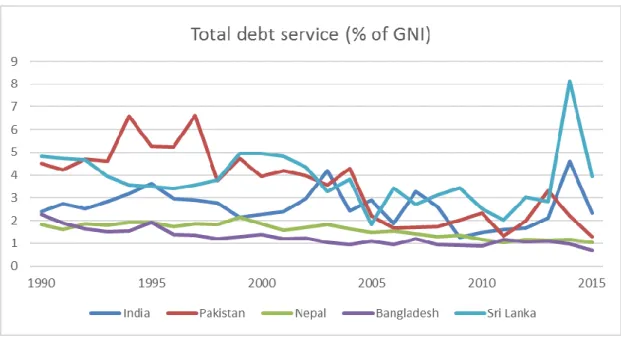
Figure 2: Total debt service (% of GNI) in South Asia, 1990-2015
Source: World Bank (2016)
Figure 3: Domestic credit by financial sector in South Asia, 1990-2015
Figure 4: Domestic credit to private sector in South Asia, 1990-2015
Source: World Bank (2016)
Figure 5: Gross domestic savings (% of GDP) in South Asia, 1990-2015
Source: World Bank (2016)
Among all the South Asian economies, Pakistan seems to be the worst performer as far as expansion of the financial sector is concerned. We say this because, in ‘FDI’ and ‘Domestic credit to private sector’, the country has shown significant decline relative to the size of the economy, unlike the other economies which have all exhibited an upward trend during the considered time period. Hence, it is no surprise that we do not detect any growth effect of the
financial variables, except savings (very marginal effect). But even savings as % of GDP has slightly declined over time.
The debt services (% of GNI) reveal some interesting findings. The variable has declined for all the five countries with the highest decline in Pakistan (from 4.5% in 1990 to 1.3% in 2015). These figures probably show that the financial sectors in entire South Asia suffer from misallocation of resources only the extent of inefficiency differs from country to country. As discussed earlier, India outperforms other economies in the region in terms of volume of credit creation (see Figures 3-5) but the growth effects of the financial development are offset by problems such as crony capitalism. The most (in)famous example that can be cited here is that of Vijay Mallya (ex-chairman of United Spirits Ltd. and Chairman of United Breweries Group), one of the leading businessmen of India, who fled the country in March 2016 leaving behind unpaid debt worth INR 9000 crore (£1.1 million approx.) from 17 banks including government-owned State Bank of India. More importantly, it was not a case of making a loss in business but of money laundering (Asthana, 2016). He had allegedly syphoned off the loan money abroad. None of the banks had even bothered to complain to the Central Bureau of Investigation (CBI) of India and only went to the court after he had escaped from India to the UK. Moreover, Mallya is just one amongst many. Anand (2016) reports that 29 government-owned banks wrote off debt worth INR 1.14 lakh crore (£13.8 billion approx.) between financial years 2013 and 2015. According to many sources including eminent economists such as Luigi Zingales, the ex-governor of India’s Central Bank (Reserve Bank of India), Raghuram Rajan, was compelled to leave his position at RBI because he was working towards eliminating the inefficiency of the Indian banking system which is burdened by bad loans. This did not go down well with some of the big business houses and consequently, political pressure was deployed upon him leading to his departure (Jain et al., 2016; The Economic Times, 2016; Venu, 2016).
That leaves us with a comparison between Bangladesh and Sri Lanka. We find that FDI causes GDP growth in Sri Lanka but not in the former. This is slightly counter-intuitive since Bangladesh experienced an annual average growth rate of around 4000% in inward FDI between 1990 and 2015 whereas Sri Lanka experienced an overall increase of around 58% during the same period (World Bank, 2016). However, in the case of Bangladesh, FDI has promoted the growth of imports (mainly that of intermediate goods) at a rate which is almost equal to that of exports (Hossain, 2008). That is why we do not observe any growth effect of FDI in Bangladesh in the short to medium run and the effect probably becomes significant only in the long run. Hossain (2008) says that the effect of FDI on trade balances could be negative in the medium run for Bangladesh depending on the relative magnitude of the two forces (import and export channels). Hussain and Haque (2016) also show that there is a long-run relationship between FDI and economic growth in the case of Bangladesh.
Furthermore, our results indicate that credit creation is promoting growth in Sri Lanka but not in Bangladesh. We argue that institutional inefficiency and incidence of corruption are holding back Bangladesh’s financial sector. According to the Corruption Perception Index published yearly by Transparency International, Bangladesh (rank=25) had a much higher corruption than
Sri Lanka (rank=37)4 in 2015. According to Worldwide Governance Indicators produced by World Bank, Sri Lanka also overall has the best public and legal institutions in South Asia. Table 16: Institutional Quality in South Asian countries
Country Institutional Quality
Government Effectiveness5* Regulatory Quality6 Rule of law7
Bangladesh -0.73 -0.93 -0.70
India 0.10 -0.39 -0.06
Nepal -1.04 -0.79 -0.70
Pakistan -0.66 -0.62 -0.79
Sri Lanka 0.01 -0.05 0.07
Source: Kauffman et al. (2010)
Note: *For each indicator, the score ranges from approximately -2.5 (weak) to 2.5 (strong) institutions.
The above table indicates that Bangladesh scores comprehensively below Sri Lanka, as far as institutional efficiency is concerned. Like in most developing countries, the financial sector in Bangladesh is dominated by government-owned banks. Bangladesh Krishi Bank ex-chairman K.I. Khaled, in his 2010 paper presented at a workshop organised by the International Business Forum of Bangladesh, cites political influence over loan allocations and lack of skills and honesty of the bank officials as the prime reasons behind corruption in the country’s banking sector. Government-owned banks are vulnerable places, where governmental and politically influential people bring in undue pressure thus hindering the effective performance of the system.
Overall, if we place the initial panel data analysis against the country specific Granger causality analysis, one fact is clarified that the average results cannot predict the heterogeneity obtained in the latter findings. There are different growth trajectories for every country in South Asia thus necessitating country-specific policy recommendations. Moreover, the extent of corruption and institutional quality differs significantly across the countries which, in turn, affect the effectiveness of the financial development. In the context of finance-led growth, the findings of this paper are in line with the findings of early papers such as Rioja and Valev (2004) who show that growth effects of financial sector vary significantly across regions and one size fit all policy, therefore, may not promote economic development in all countries.
4Corruption Perception index by Transparency International-100 (very clean) to 0 (highly corrupt).
5Government Effectiveness=Reflects perceptions of the quality of public services, the quality of the civil service
and the degree of its independence from political pressures, the quality of policy formulation and implementation, and the credibility of the government's commitment to such policies.
6Regulatory Quality=Reflects perceptions of the ability of the government to formulate and implement sound
policies and regulations that permit and promote private sector development.
7Rule of law=Reflects perceptions of the extent to which agents have confidence in and abide by the rules of
society, and in particular the quality of contract enforcement, property rights, the police, and the courts, as well as the likelihood of crime and violence.
5.
Conclusion
The paper examines the empirical relationship between financial development and economic growth for five South Asian countries over the time period 1990-2015. The panel model results indicate that financial development promotes growth in South Asia through the FDI and savings channels. The other channels are not contributing towards growth for the overall region. In fact, we find the effect of total debt service to be negative (though insignificant) which is probably driven by India and Pakistan. In these two countries, the problem of bad debt is a serious issue as performing assets (as a percentage of net advances) and non-performing loans (as a percentage of total gross loans) have been exhibiting an upward trend over the last decade or so.
The Granger causality analysis clearly depicts the heterogeneity in the region, as far as the finance-growth nexus is concerned. Sri Lanka comes out as a very good case for the financial sector led growth theory as there is a causality running from all the financial variables, that this study considers, towards economic growth. We argue this is because Sri Lanka has lower corruption and better legal and government institutions as compared to all other South Asian economies, thus making it possible for the country to take better advantage of the expansion of its domestic financial sector.
Quantitatively speaking, Bangladesh is experiencing a faster growth in most of the financial variables (such as FDI) as compared to Sri Lanka but corruption and government ineffectiveness are holding it back from realising the growth effects from all the financial channels.
In terms of overall growth of credit and domestic savings, India outperforms all its neighbours. But the econometric results indicate that financial development does not cause growth in India, at least not in the short run. This finding bears testimony to the fact that mere credit formation will not be sufficient to boost growth. The Indian policymakers need to address the issue of misallocation of resources resulting from crony capitalism to ensure that the funds are allocated to profitable investments. The most important determinant of growth during the considered time period seems to be trade openness which is expected because India started adopting widespread trade reforms from 1991 onwards.
Pakistan seems to be the worst performer in the region, as far as development of the financial sector is concerned. The volume of credit creation, FDI and savings (as % of GDP or GNI) are shrinking over time, unlike all the other South Asian countries who are exhibiting an upward trend. We find that financial sector promotes growth in Pakistan only through the savings channel but the effect is very marginal. Moreover like India, Pakistan suffers from gross misallocation of resources thus rendering both size and efficiency effect of financial development ineffective.
Besides Sri Lanka, Nepal seems to be the only country in the sample where FDI causes growth. UNCTAD (2003) also observes in its Investment Policy Review report that FDI inflows have been successful in job creation in the labour-intensive manufacturing sectors (such as textiles and garment) and tourism of Nepal. However, the level of FDI is still very low in Nepal; it was only about 1% of GDP in 2015 (World Bank, 2016). So, the country should consider further opening up its economy to foreign investments to boost productivity and growth. Among other findings, there is strong evidence of reverse causality from FDI towards growth in South Asia which can be generalised to infer that, for developing countries, some level of initial GDP growth is necessary for building up a credible investment climate and attracting foreign investors.
References
Anand, U. (2016). “Rs 1.14 lakh crore of bad debts: The great government bank write-off”. The Indian Express, 9th Feb, 2016.
Asthana, S. (2016). “Mallya's case should be made a test case for exposing crony capitalism”. Business Standard, 10th Mar, 2016.
Atje, R. and B. Jovanovic (1993). “Stock markets and development”. European Economic Review, 37(2-3), pp 632-640.
Beck, N., and J. N. Katz (1995). “What to do (and not to do) with Time-Series Cross-Section Data”.
The American Political Science Review, 89(3), pp 634-647.
Bencivenga, V.R., and B.D. Smith. (1993). “Some Consequences of Credit Rationing in an Endogenous
Growth Model.” Journal of Economic Dynamics and Control, 17 (1-2), pp 97–122.
Blackburn, K., and V.T.Y. Hung (1998). “A Theory of Growth, Financial Development, and Trade”.
Economica, 65 (257), pp 107–24.
Chatterji M., S. Mohan, and S. Ghosh Dastidar (2014). "Relationship Between Trade Openness And
Economic Growth Of India: A Time Series Analysis," Journal of Academic Research in Economics,
6(1), pp 45-69.
De Gregorio, J. and P. Guidotti (1995). “Financial Development and Economic Growth,” World
Development, 23 (3), pp 433-48.
Demetriades, P. O. and K. Hussein (1996). “Does Financial Development Cause Economic Growth?
Time-series Evidence from 16 Countries,” Journal of Development Economics, 51(2), pp 387-411.
Demetriades P. and S. Andrianova (2003). “Finance and Growth: What we know and what we need to know”. Working Paper, University of Leicester.
Accessed at: https://www.le.ac.uk/economics/research/RePEc/lec/leecon/dp03-15.pdf
Demirgüç-Kunt, A., and R. Levine (2008). “Finance, Financial Sector Policies, and Long-Run Growth”.
Working Paper No. 11, Commission on Growth and Development,The World Bank, Washington, DC.
Estrada, G., D. Park, and A. Ramayandi (2010). “Financial Development and Economic Growth in
Goldsmith, R.W. (1969). “Financial Structure and Development”. Yale University Press, New Haven, CT.
Government of Bangladesh (2014).Budget Document, Chapter 14, Ministry of Finance, Bangladesh.
Accessed at: http://www.mof.gov.bd/en/budget/12_13/ber/en/chapter-14_en.pdf
Greenwood, J., and B. Jovanovic (1990). “Financial Development, Growth, and the Distribution of
Income”. Journal of Political Economy, 98(5), pp 1076–1107.
Harris, R.D.F. (1997) “Stock Markets and Development: A Re-assessment”. European Economic
Review, 41(1), pp 139-146.
Hossain, M.A. (2008). “Impact of Foreign Direct Investment on Bangladesh’s Balance of Payments:
Some Policy Implications”. Bangladesh Bank Research Policy Note.
Accessed at: https://www.bb.org.bd/pub/research/policynote/pn0805.pdf
Hussain M.E. and M. Haque (2016). “Foreign Direct Investment, Trade, and Economic Growth: An
Empirical Analysis of Bangladesh”. Economies, 4(2), pp 1-14.
International Monetary Fund (2016). Financial Access Survey,
Accessed at: http://data.imf.org/?sk=E5DCAB7E-A5CA-4892-A6EA-598B5463A34C
Jain, R., R. K. Singh and S. Choudhury, “Inside the 'constant quibbling' and drama that led to India's central bank chief's departure”. Business Insider UK, 19th June, 2016.
Khaled, K.I. (2010). “Reducing corruption in accessing industrial credit”. Keynote Paper, International Business Forum of Bangladesh (IBFB) workshop on 'Industrial credit and corruption in SCBs’. Khan, M.A., A. Qayyum and S.A. Sheikh (2005). “Financial Development and Economic Growth: The
Case of Pakistan”. The Pakistan Development Review, 44 (4 Part II), pp 819–837.
Kaufmann, D., A. Kraay and M. Mastruzzi (2010). "The Worldwide Governance Indicators : A
Summary of Methodology, Data and Analytical Issues". World Bank Policy Research Working Paper,
No. 5430.
King, R.G., and R. Levine (1993a). “Finance and growth: Schumpeter might be right”. Quarterly
Journal of Economics, 108(3), pp 717–738.
King, R.G., and R. Levine (1993b). “Finance, Entrepreneurship, and Growth: Theory and Evidence”.
Journal of Monetary Economics, 32(3), pp 513–42.
Levine, R. (2003). “More on Finance and Growth: More Finance, More Growth?”. Federal Reserve
Bank of St. Louis Review, 85 (4), pp 31-46.
Levine, R. (2005) "Finance and Growth: Theory and Evidence," Handbook of Economic Growth, in: Philippe Aghion & Steven Durlauf (ed.), Handbook of Economic Growth, edition 1, volume 1, chapter 12, pp 865-934.
Levine, R. and S. Zervos (1998). “Stock Markets, Banks and Economic Growth”. American Economic
Mankiw, N. G., D. Romer, and D. N. Weil (1992). “A contribution to the empirics of
economic-growth”. Quarterly Journal of Economics, 107(2), pp 407–437.
Mazumdar, S. (2008). “Crony Capitalism and India: Before and After Liberalization”. ISID Working
Paper No. 2008/04, Institute for Studies in Industrial Development.
McKinnon, R. I. (1973) “Money and capital in economic development”. Brookings Institute, Washington, DC.
North, D. C. (1981). “Structure and change in economic history”, W.W. Norton, New York, NY. Odedokun, M. O. (1996). “Alternative Econometric Approaches for Analyzing the Role of the Financial
Sector in Economic Growth: Time Series Evidence from LDC’s,” Journal of Development Economics,
50 (1), pp 119-46.
Perea, n. and R.C. Paudel (2009). “Financial development and economic growth in Sri Lanka”, Applied
Econometrics and International Development, 9 (1), pp 157-164.
Rajan, R. and L. Zingales (1998). “Financial dependence and growth”, American Economic Review,
88(3), pp 559-586.
Rana, R.H. and S. Barua (2015). “Financial Development and Economic growth: Evidence from a panel
study on South Asian countries”. Asian Economic and Financial Review, 5(10), pp 1159-1173.
Ray, S. (2013). “Does financial development promote economic growth in India?” International
Journal of Economics Practices and Theories, 3(3), pp 140-151.
Reddy, P. (2002). “A comparative study of Non Performing Assets in India in the Global context - similarities and dissimilarities, remedial measures”. Working Paper, Indian Institute of Management, Ahmedabad.
Accessed at: http://unpan1.un.org/intradoc/groups/public/documents/APCITY/UNPAN013132.pdf
Reserve Bank of India (2016). Banking sector at a glance, Database on Indian economy.
Rioja, F. and N. Valev (2004). “Does one size fit all?: a reexamination of the finance and growth
relationship”. Journal of Development Economics, 74(2), pp 429-447.
RIS (2002). “South Asian Development and Cooperation Report 2001/02”. Research and Information System for the Non-Aligned and Other Developing Countries, New Delhi, India.
Shaikh,S. A. (2003). “Value Maximization of Non-Performing Loans (NPL) and Distressed Assets – Pakistan’s Experience (October 1999 – October 2003)”, Forum for Asian Insolvency Reform, OECD.
Accessed at: https://www.oecd.org/daf/ca/corporategovernanceprinciples/20212569.pdf
Singh, T. (2008). “Financial development and economic growth nexus: A time-series evidence from
India”. Applied Economics, 40(12), pp1615-1627.
The Economic Times. (2016). “Raghuram Rajan being attacked for fighting crony capitalism: Colleague”. 12th June, 2016.
Transparency International (2015). “Corruption Perception Index”.
UNCTAD (2003). “Investment Policy Review: Nepal”. United Nations Conference on Trade and Development, United Nations Publications, Geneva.
Venu, M.K. (2016). “Saving Crony Capitalists From Raghuram Rajan”. The Wire, 20th June, 2016.
World Bank (2016). World Development Indicators, World Bank.
Zhu, A., M. Ash, and R. Pollin (2004). “Stock Market Liquidity and Economic Growth: a Critical